A Refereed Monthly International Journal of Management
To Determine Consumer Purchasing Behavior: Internet Shopping Orientation in India
PARTICULARS ABOUT AUTHORS
(1) MR. L. K. PATWA (*)
(*) Assistant Professor,
Sacred Heart Degree College
Naipalapur, Sitapur, Uttar-Pradesh
(2) MR. KUSH KUMAR PATWA (**)
(**) Assistant Professor,
Kanpur Institute of Management Studies,
Lucknow-Kanpur Highway U.P.
(3) DR. AJAY VERMA (***)
(***) Assistant Professor,
FASC, Mody University Science & Technology,
Lakshmangarh, Sikar, Rajasthan,
ABSTRACT
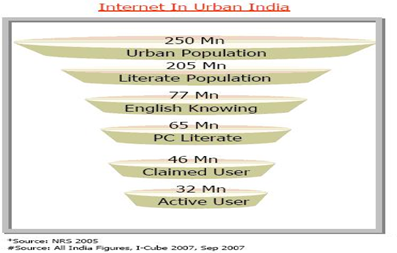
Customer acceptance of innovations necessitates behavioral research aimed at examining and predicting behavior and behavioral intentions. Due to low penetration of internet in India (around 4% according to Business Today, 5.2% according to Nasscom s projection for 2005 and 7.1% in November 2008 according to internet World Stats usage and populations statistics) as compared to other countries (China 22.4%, Taiwan 66.1%), internet shopping can be considered as an innovation for the Indian customer. Customer demand for the internet is a key factor that may ultimately drive widespread acceptance of the internet by retailers. Whether the customer has access and how they use or perceive internet shopping in a way will affect its ultimate acceptance. Therefore, this study examines internet shopping acceptance in developing countries; in this case India. The exponential growth of internet penetration in India and increased e-commerce activity both on consumer side as well as corporate side during last few years provides the impetus to investigate this phenomenon among potential online shoppers. The study tests a comprehensive Technology Acceptance Model incorporating shopping profiles and security and privacy concerns exploring their effects on successful adoption of internet shopping in India.
Keywords: Internet shopping, E-commerce, E-business, Internet business.
INTRODUCTION
In the last few years, the pervasive myth that building internet retail sites will automatically trigger customer patronage has been laid to rest. The demise of thousands of internet businesses that banked on slick websites and multi-million-rupees advertisement campaigns is a painful but educative reminder that for all the hype, the internet is just another channel for business. Irrefutably, the digital channel offers some unique advantages over other media including interactive communications, rapid comparison shopping, lower transaction costs, innovative arrangements for the sampling and consumption of digital products, and the elimination of time and spatial barriers. However, this new medium of commerce has its own drawbacks such as reduced opportunities for sensory shopping, social shopping, face-to-face interactions with sales personnel, and the postponement of the consumption or enjoyment of tangible goods. The inherent limitations of the internet have been compounded by poorly designed internet storefronts, limited product selection, poor customer service, tedious checkout procedures, botched orders, tardy deliveries, security lapses and privacy invasions.
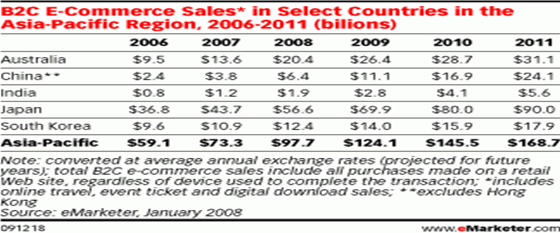
Statistics on E-Commerce activity
RESEARCH OBJECTIVES
1) Identifying various shopping orientations among potential internet shoppers.
2) Evaluating the effect of a consumer’s shopping orientation on his/her Perceived Usefulness for and Attitude towards using internet shopping.
3) Evaluating the effect of a consumer’s Knowledge about internet shopping on his/her Perceived Usefulness and Perceived Ease of Use of internet shopping.
4) Evaluating the effect of a consumer’s Security concerns on his/her Actual Behavior.
REVIEW OF LITERATURE
Internet shopping is still in evolutionary stage in India and very few studies have undertaken research exploring customer acceptance and diffusion of internet shopping in India. Although there has been a dearth of internet shopping related studies in Indian context, theoretical exploration can be based on various international studies carried out in other countries.
According to Ajzen and Fishbein (1980) behavioral beliefs link the actual behavior of interest to expected outcomes. A behavioral belief is subjective probability that the behavior will produce a given outcome. Although a person may hold many behavioral beliefs with respect to any behavior, only a relatively small number are readily accessible at a given moment.
Taylor Nelson Sofres (TNS) Interactive third annual global e-commerce report was part of TNS Interactive Global E-commerce Report 2002, which was based on more than 42,000 interviews in 37 countries. Findings indicated that about 27 per cent of users in India have not purchased goods or services online because they think it is too difficult and lack of knowledge on such aggravates the situation and hence, it is safer buying goods or services in a store.
Parikh (2006a) aimed at identifying various shopping orientations prevailing among the internet users and classified internet users into five shopping profiles: socializing, home, mall, economic and civil. These studies were aimed at diffusion of internet in India as a country rather than acceptance and diffusion of internet among Individual customers.
Dutta and Roy (2003, 2004); Kshetri (2002); and Dholakia et al. (2003) also compared internet diffusion in India and China & proposed that policies for stimulating internet diffusion must address both, infrastructure expansion as well as sectoral absorption in a balanced manner. For infrastructure expansion policies need to be crafted to stimulate private sector investment
The working paper Dholakia et al. (2003) examined several factors that are likely to influence the broadband-potential in the two countries. Their analysis indicates that factors such as higher-income, higher propensity of Chinese consumers adopt new technologies, higher-investment in the telecom sector. On the other hand, India’s position in the global IT map as a major provider of IT services is likely to trigger the demand for broadband.
RESEARCH METHODOLOGY
This chapter discusses the research methodology adopted in separate sections. The first part discusses the scales used for developing the instrument (questionnaire) for the research; Second, data collection method including sampling and the tools of data collection. A four-page questionnaire was used as the research instrument. Attribute level scales were a combination of scales earlier used in similar other research. The full questionnaire was first pre-tested in an iterative manner among ease sample of colleagues and friends drawn from the general public.
DATA COLLECTION AND SAMPLE
Following is a summary of the data collection strategy and the sample
1) Sampling Element: Individual shoppers (Controlled for education, marital status, age group, gender, household income, the product shopped-internet Shopping of Electronic Gadgets and Home Appliances)
2) Geographical extent: Two Cities of India (Rajasthan, Delhi). These cities have already major developments in organized retail & due to high penetration of Internet; there is higher probability of receiving reliable responses contributing to the overall reliability.
3) Sampling Technique: Non-probability sampling technique (Convenience sampling)
4) Sample size: 530 Respondents, 21 responses were discarded due to incomplete information or visibly manipulative data. A sample size of 500 was deemed appropriate.
5) Data Collection Instrument: The questionnaire covered the constructs proposed in the model and standard (and reliable) scales available were used for measuring each construct. Separate statements covering the control variables were added towards the end of the questionnaire.
6) Data collection process: The respondents were explained the purpose of the study in brief and handed over the questionnaire for the duration of one week. The purpose of giving them the questionnaire for one week was to give them enough time to understand the questions and respond properly. At the end of this time, the questionnaires were collected back.
FINDINGS AND ANALYSIS
Reliability of the Survey Instrument
To test the reliability of the overall instrument, Cronbach’s coefficient α was computed. The reliability coefficients are shown in Table 1. The results in the table show that the overall reliability of the instrument is quite satisfactory (α=0.81). As the instrument has 48 items, it would definitely give high reliability of the overall instrument. To check the reliability of the instrument critically, the reliability of each sub-scale was tested and theresults are also shown in Table 1. Any α value above 0.7 is considered as satisfactory and the results show that the sub-scales are also quite reliable.
Table 1: Reliability of the Survey Instrument
|
Construct
|
Α
|
KMO
|
Barlett’s test of sphericity: Significance:
|
|
Overall Scale
|
0.81
|
0.98
|
0.00
|
|
Shopping Orientations (1-13)
|
0.73
|
0.78
|
0.00
|
|
Perceived Usefulness (14-19)
|
0.93
|
0.93
|
0.00
|
|
Perceived Ease of Use (20-25)
|
0.91
|
0.93
|
0.00
|
|
Attitude Towards Using (27-34)
|
0.78
|
0.96
|
0.00
|
|
Knowledge (35-38)
|
0.91
|
0.83
|
0.00
|
|
Security/Privacy (S) (39-46)
|
0.95
|
0.96
|
0.00
|
|
Actual Behavior (47-48)
|
0.82
|
0.70
|
0.00
|
Construct Validity through Factor analysis
The applicability of the factor analysis was verified by executing KMO test and Barlett’s test of sphericity. The results of these tests are summarized in Table 1 above. All exploratory factor analysis was performed using the principal components factoring method and Varimax rotation with the Kaiser normalization. Table 2 depicts the factor analysis results of shopping orientation variables (variables 1-13).
Construct Validity through Factor analysis
To test the validity of the factors (constructs) within each sub-scale, to identify various profiles for shopping orientations and to reduce data in the proposed model structure, exploratory factor analysis was performed. The applicability of the factor analysis was verified by executing KMO test and Barlett’s test of sphericity. The results of these tests are summarized in Table 1 above. Table 2 depicts the factor analysis results of shopping orientation variables (variables 1-13).
Table 2: Factor Analysis Results for Shopping Orientations
|
Scale
items
|
|
Component
|
|
1
|
2
|
3
|
4
|
|
1
|
I like to shop from home (for example, using mail-order catalogues, the TV or the internet)
|
-0.74
|
-0.32
|
0.35
|
0.14
|
|
2
|
I shop from home because I cannot find what I want in local stores
|
-0.81
|
-0.25
|
0.28
|
0.20
|
|
3
|
Shopping from home is more convenient than going to the store
|
-0.74
|
-0.27
|
0.32
|
0.19
|
|
4
|
I make it a rule to shop at a number of stores before I buy
|
-0.08
|
0.84
|
-0.09
|
0.15
|
|
5
|
I can save a lot of money by shopping around
|
-0.12
|
0.83
|
-0.03
|
0.03
|
|
6
|
I like to have a great deal of information before I buy
|
-0.04
|
0.83
|
-0.10
|
0.16
|
|
7
|
I enjoy going to big shopping malls
|
0.20
|
-0.38
|
-0.81
|
0.04
|
|
8
|
Shopping malls are the best places to shop
|
0.19
|
-0.38
|
-0.81
|
-0.00
|
|
9
|
I like to go shopping with a friend
|
0.21
|
-0.18
|
-0.72
|
0.33
|
|
10
|
I often combine shopping with lunch or dinner at a restaurant
|
0.13
|
-0.08
|
-0.77
|
0.15
|
|
11
|
Shopping gives me a chance to get out and do something
|
0.32
|
-0.11
|
-0.73
|
0.30
|
|
12
|
I like to shop where people know me
|
0.10
|
-0.00
|
0.27
|
-0.82
|
|
13
|
I owe it to my community to shop at local stores
|
0.07
|
0.02
|
0.27
|
-0.83
|
|
|
Eigen Values
|
2.96
|
2.89
|
2.70
|
1.88
|
|
|
% of Variance
|
27.33%
|
22.86%
|
20.54%
|
17.54%
|
|
|
Cumulative % of Variance
|
27.33%
|
50.19%
|
70.73%
|
88.27%
|
The item loadings for three factors representing home, economic and personalizing shopping orientations were as expected. However, the items measuring mall and socializing shopping orientations loaded on a single factor and were labeled mall socializing orientation. Cronbach’s alpha for the home, economic, mall socializing, and local shopping orientation factors were 0.89, 0.83, 0.69, and 0.74 respectively. All the four factors had Eigen values more than 1 and they accounted for 88% of the variance. The three items in the home orientation factor covered preferences for shopping from home like convenience and choices. Choice related statement specifically, “I shop from home because I cannot find what I want in local stores” showed the highest loading (0.81). The three items in the economic orientation factor covered characteristics of shoppers who are price sensitive like saving money by shopping around and preference of colleting a lot of information before making a purchase decision. All three statements loaded quite well but the shopping around statement specifically, “I make it a rule to shop at a number of stores before I buy” showed the highest loading (0.84). The five items in the mall socializing orientation factor covered characteristics of shoppers who prefer to go out in malls for shopping, who like to be accompanied by their friends for shopping and combine lunch or dinner with shopping to complete the experience. Shopping for these people is a socializing activity. Although all five items loaded on a single factor, there is visible difference in the loadings for mall related items (items 7-8, loadings >0.80) and for socializing related items (items 9-11, loadings <0.81). This was not unexpected as in the original scale they were proposed as part of separate factors.
Table 3: Descriptive Statistics, Inter-Correlations and Reliability Estimates for the Shopping Orientations Factors
|
|
M
|
SD
|
1
|
2
|
3
|
4
|
|
Home
|
25.70
|
8.98
|
(.93)
|
|
|
|
|
Economic
|
20.47
|
6.96
|
.82**
|
(.91)
|
|
|
|
Mail Socializing
|
16.09
|
5.30
|
.75**
|
.66**
|
(.80)
|
|
|
Personalizing
|
4.70
|
1.82
|
.40**
|
.40**
|
.32**
|
(.58)
|
Note. N=509.Coefficient alpha on the diagonal. The mean of the composite scale is 66.96, the SD is 20.30 and the Cronbach’s alpha is 0.95, **p<0.01, two-tailed, *p<0.05, two-tailed.
For better understanding of this procedure, a standard SPSS output is provided in Appendix J for the Attitude Towards Using (A) construct of the proposed model for this research. The variables representing this construct are variables 27 to 34 of the questionnaire. These variables were reduced in one factor using the least squares regression approach mentioned above. The output shows the inverse of the correlation matrix, KMO and Bartlett’s tests for testing the applicability of factor analysis for data reduction and component score coefficient matrix mentioned above. The main advantage of the regression method is that it maximizes validity. This means that the procedure provides the highest correlations between a factor score and the corresponding factor. Regression estimates are not unbiased estimates of true factor scores and could correlate with other factors and factor scores. For evaluating the existence of this problem of multi-collenearity in the current factor scores, Variance Inflation Factor (VIF) and Condition Number were observed as a measure of multi-collenearity in the subsequent analysis.
The following Table 4 clearly shows that the reduced factors are representative of the original variables representing the respective constructs.
Table 4: Percentage of Variance Explained by Factor Scores
|
No.
|
Name of The Variable (Factor Score)
|
% of Variance explained
|
|
1
|
Perceived Usefulness (PU)
|
74
|
|
2
|
Perceived Ease of Use (PEOU)
|
71
|
|
3
|
Attitude Towards Using (A)
|
72
|
|
4
|
Knowledge (K)
|
79
|
|
5
|
Security/ Privacy (S)
|
76
|
|
6
|
Actual Behavior (B)
|
85
|
SUMMARY
The present scale was tested and found to be multi-dimensional. The Shopping orientations scale was tested for it’s nomological, discriminant and construct validity. The scale displays theoretically supported relationships with other variables, demonstrating nomological validity. It is also distinguishable from the construct of knowledge, thus demonstrating discriminant validity. The construct validity test revealed four shopping orientations as compared to the proposed five shopping orientations structure. The shopping orientations were named Home, Economic, Mall-socializing and Personalizing. Items in the other sub-scales were reduced in single dimensions. Each of the sub dimensions as well as the overall scale show a high inter-consistency reliability. To conclude, the given instrument to explore online shopping behavior is tested to be scientifically reliable and valid.
LIMITATIONS OF THE STUDY
This is especially vital for a subject like online shopping behavior that is not static but is a developmental process that changes over time. Since only self-report measures were used, common-method variance and response consistency effects may have biased the observed relationships. Yet, perceptions of usefulness and ease of use are not objective measures. Because perceptions are necessarily self-reported, such measures are the most effective at measuring these cognitions. Thus, this is an unavoidable criticism of the study of online shopping behavior.
CONCLUSION
By extending this shopping behavior construct to online shopping, our study aimed at contributing to the knowledge and understanding of consumer response to electronic modes of shopping. It is becoming increasingly clear that in order to survive and more importantly to succeed, online merchants should embrace and actively pursue fundamental principles of good retailing that apply to any medium. Based on the findings from this study, it is expected that the study of shopping orientations can also help electronic retailers identify and understand those consumers who prefer to shop online and the reasons why. Further, shopping orientation could be used to segment customers and formulate different strategies based on each segment’s relative propensity to adopt and use online shopping. The proposed model provides a robust framework for exploring online shopping behavior in a developing country.
Overall, the research can be utilized by corporate for developing and implementing an effective e-tailing strategy and for targeting the right types of consumers for getting a bigger bang for their buck. At the same time, academicians can revalidate and extend the findings of the research for contributing to the development of an effective e-marketing model for India and for other developing countries.
REFERENCES
1) Ajzen, I., and Fishbein, M. (1980), Understanding Attitude and Predicting Social
Behavior, Englewood Cliffs, NJ: Prentice-Hall, Inc.
2) Dutta, A. and Roy, R. (2003), “Anticipating internet diffusion.” Communication of the ACM, 42(2), 66-71.
3) Dutta, A., and Roy, R. (2004), “The mechanics of internet growth: A developing country perspective”, International Journal of Electronic Commerce, 9(2), 143- 165.
4) Kshetri, N. (2002), “What Determines Internet Diffusion Loci in Developing Countries: Evidence from China and India.” Pacific Telecommunications Review, 23, 3, 40 25-34.
5) Dholakia, R., Dholakia, N., and Kshetri, N (2003), “Gender and internet Usage”, In Hossein Bidgoli (Ed), The Internet Encyclopedia, John Wiley & Sons, Inc.
6) Taylor, S., and Todd, P. (1995), “Decomposition and crossover effects in the theory of planned behavior: a study of consumer adoption intentions”, International Journal of Research in Marketing, 12.
7) Parikh, D. (2006), “Profiling Internet Shoppers: A Study of Expected Adoption of Online Shopping in India”, IIMB Management Review, Vol. 18, No 3.
8) Parikh, D. (2006a), “Psychographic Profiling of Shoppers: A Study of Expected Adoption of Inline Shopping in India” (Paper not published).
9) Shim, S. and Mahoney, M.Y. (1991), “Shopping orientation segmentation of in home electronic shoppers”, International Review of Retail, Distribution & Consumer Research, 1(4), 437-453.
10) Sinha, P.K. (2002), “Segmenting shoppers on their behavior”, working paper, Indian Institute of Management,. Ahmadabad, December.
11) Sinha, P.K. (2003), “Shopping Orientation in The Evolving Indian Market”, Vikalpa: The Journal for Decision Makers, Vol. 28, No. 2 and pp.13–22.
12) Straub, D. (1994), “The effect of culture on IT diffusion: E-mail and FAX in Japan and the U.S.”, Information Systems Research, 5(1), 23-47.

