TTIP and TPP: Impact on Bangladesh and India Economy
|
Dr.Golam Ahmed Faruqui
Professor
School of business studies
Southeast university
Dhaka, Bangladesh
|
Dr.Laila Arjuman Ara
Assistant Professor
School of business studies
Southeast university
Dhaka, Bangladesh
|
Md. Qamruzzaman ACMA
Assistant Professor
School of Business and Economics
United International University
Dhaka, Bangladesh
Email: zamaniba45@uap-bd.edu
|
Abstract
The aim of this paper is to investigate the potential economic impacts of tariff
eliminations under TPP and TTIP on various macro and trade variables of Bangladesh
and Pakistan. In this context, a standard computable general equilibrium (CGE) analysis
has been adopted by using the Global Trade Analysis Project (GTAP) model and database
to explore the aggregate impact as well as sectorial implications . The analysis
evinces that under completely integration in terms of tariff elimination under these
two mega deal, both Bangladesh and India could face tremendous negative impact on
their economy. The analysis also consider that if Bangladesh and India may consider
joining to the TPP to minimize the negative economic impact due to arise from these
mega deals. Such decision produce positive results that Bangladesh and India could
gain significantly in terms of welfare, real GDP as well as exports. This indicates
that Bangladesh and India should try to enter into the TPP deal.
Keywords: TPP, TTIP, India, Bangladesh, GTAP, CGE
JEL Classification:F12, F15, F19
Introduction and Rational of the Study
Trade theory argues that trade liberalization by reducing tariff and non-tariff
barriers promotes efficiency, scale economies and trade flows, thereby, promoting
economic growth. In spite of liberal economic reforms for trade liberalization in
many countries, scholars have identified a variety of country-specific barriers
like domestics’ regulations, supply side capacity, trade facilitation, tariff and
non-tariff barriers, etc. which impede the growth of world trade. In this backdrop,
besides multilateral efforts, regional and bilateral efforts facilitate countries
to address some of these issues.
The Trans-Pacific Partnership (TPP) negotiations are already taking place involving
the U.S. and 11 other countries, which account for about 40 percent of the global
economy. The TPP is a proposed trade agreement under negotiation by (as of August
2013
[update] )
Australia , Brunei
, Chile
, Canada , Japan ,
Malaysia , Mexico
, New Zealand
, Peru , Singapore , the United States , and Vietnam . The TPP intends to enhance trade and investments
among the TPP partner countries, promote innovation, economic growth and development,
and support the creation and retention of jobs.
Recently, the U.S. and the EU reaffirmed their commitment to conclude expeditiously
a comprehensive and ambitious Transatlantic Trade and Investment Partnership (TTIP)
that already accounts for nearly half of global output (EU 2014). On 13 February
2013, the President of the United States, the President of the European Commission
and the President of the European Council made a joint announcement to be effect
that the EU and the USA have agreed to launch negotiations on the TTIP with the
aim of signing an agreement in 2015. The key issues that are considered here relate
to identification of the most important products in the US or the EU imports from
South Asia and how vulnerable the products are to trade diversion/preference erosion.
In this context, an effective free trade agreement (FTA) would force the two countries
to move out of the present commodity-by-commodity approach in negotiation and allow
free market access bilaterally and eliminate all non-tariff barriers within a given
timeframe for all commodities except an agreed short negative list.
There are numerous studies u sing Computable General Equilibrium (CGE) modelling,
like Lee and Itakura (2014), Cheong (2013), Rahman and Cheong (2014) Arif et.al
(2014), Xin (2014), Narayanan and Sachin (2014) and Petri et.al (2011) try quantifying
the impact of TPP and TTIP on different regions. Study by Lee and Itakura (2014)
used GTAP dynamic model to examine welfare impact of Regional Comprehensive Economic
Partnership (RCEP) and TPP on various regions.
Cheong (2013) analyzes the progress on major issues regarding the current TPP negotiations
which are being led by the United States, and draws implications for East Asian
economic integration. The impact of forming the TPP under three scenarios was estimated
using the GDyn, a recursive dynamic computable general equilibrium (CGE) model developed
by the Global Trade Analysis Project (GTAP). The three scenarios are TPP9 (nine
TPP members), TPP12 (12 members), and TPP12+ China (13 members). The paper argues
that the TPP should be promoted for its economic value, not for geopolitical purposes.
It should be open to all Asia and Pacific countries, including the People’s Republic
of China.
Narayanan and Sachin (2014) conducted a comparative analysis of the likely impact
of tariff reduction under TPP of Indian economy under different scenarios, by using
the standard GTAP model and suggested that there are mixed prospects and no strong
reason for India to pursue being part of the TPP.
Arif et.al (2014), examine the impacts of TPP on Turkish economy. By using Global
Trade Analysis Project (GTAP) database and a general equilibrium model, the effects
of various scenarios on GDP and exports are studied. Obtained results show that
Turkey could face losses on GDP up to 1% if the TPP covers only current twelve countries.
Xin (2014) show that most of the macroeconomic indicators are positive like GDP,
consumption, real export, import employment for China, US, Japan but for Vietnam,
Singapore and Australia & New Zealand it is negative, if China becomes a member
of TPP.
Petri et.al (2011) did a quantitative assessment of the Trans-Pacific Partnership
and Asia-Pacific integration by using GTAP database. According to this study, TPP
and an Asian Track could consolidate the “noodle bowl” of current smaller agreements
and provide pathways to a Free Trade Area of the Asia-Pacific (FTAAP). The effects
on the world economy would be small initially, but by 2025 the annual welfare gain
would rise to $104 billion on the TPP track, $303 billion on both tracks and $862
billion with an FTAAP. The study also mentioned that strong economic incentives
would emerge for the USA and China to consolidate the tracks into a region-wide
agreement.
Akhtar and Vivian (2014) conclude their paper and envisioned that the TTIP could
be the largest FTA in the world in terms of economic size and serve a number of
strategic U.S. policy goals. Ham (2013) has explored the logic of TTIP in geopolitical
in nature and global normative convergence. He has shown that the TTIP may have
a rather unpredictable impact on the future of the EU. Jim Rollo et.al (2014) evaluate
some of the potential effects of EU-US TTIP economic integration on the trade in
goods of 43 low-income countries and show that most of the low income countries
will suffer negative impact due to the mega deal.
The above brief review shows that various aspects of TPP and its impact on different
regions have been analyzed. However, not much research has been done to quantify
the impact of TPP and TTIP on South Asian economy. It would be interesting to see
the impact of TPP and TTIP on South Asianeconomy. If these two sets of trade talks
are successfully concluded, most of the South Asian countries may find itself put
in a disadvantageous position. The US and the EU is the major trading partner of
South Asian Countries including India, Bangladesh, Pakistan, Sri Lanka and Nepal
(table 2). Indian Exports to the EU and the USA was US$ 49 billion and US$ 42 billion
while import from the EU and the USA was US$ 48 billion and US$ 23billion respectively
in 2013 (UNCOMTRADE 2014). Bangladesh’s exports to the EU and the USA were US$ 14
billion and US$ 5 billion respectively which is 80 percent of countries total exports
in 2013. The other South Asian countries are similar trend as well.
With this background, the objective of this study is to make a comparative analysis
of likely impact of tariff reduction under TPP and TTIP on various macro and trade
variables of Bangladesh and Indiaeconomy by using GTAP model. The unique contribution
of this paper lies in the evaluation of scenarios wherein Bangladesh and India may
be involved in the TPP as alternative. This has the potential to provide deep insights
to the currently active policy debate on TPP and TTIP for South Asian countries.
The rest of the paper is organized as follows: GTAP methodological caveats are highlighted
in Section 2. Section 3 analyses the results of the simulations. The paper ends
with a brief concluding remarkin Section 4.
Methodology
Before moving into the GTAP methodology, we have a look at the total bilateral trade
flows between the regions involved in this paper (see table 1 and table 2 for details).
The top sources of South Asian’s imports are EU27, Japan, USA, Canada and Australia,
of which the last four are current TPP members. All major South Asian’s top export
destinations include EU27, USA, Japan and Korea. Therefore, South Asian is closely
related to the proposed TPP members and it is important to consider their involvement
in this partnership.
Simple average tariff of the EU against the USA is 4.1 per cent and the average
US MFN tariff against the EU is 3.5 per cent (Europa 2014). These are not high average
tariffs and as such do not suggest a Free Trade Agreement (FTA) would endow major
competitive advantage to either the EU or the USA through transatlantic trade. While
the average tariff between the USA and EU stands 3-4 percent, non-tariff barriers
are extremely high, ranging from 25.5 ~73.3percent. Therefore, elimination of non-tariff
barriers may actually cause more damage to South Asia than elimination of tariffs.
Table 1. Overview of Economies of the TPP and TTIP Countries in 2013
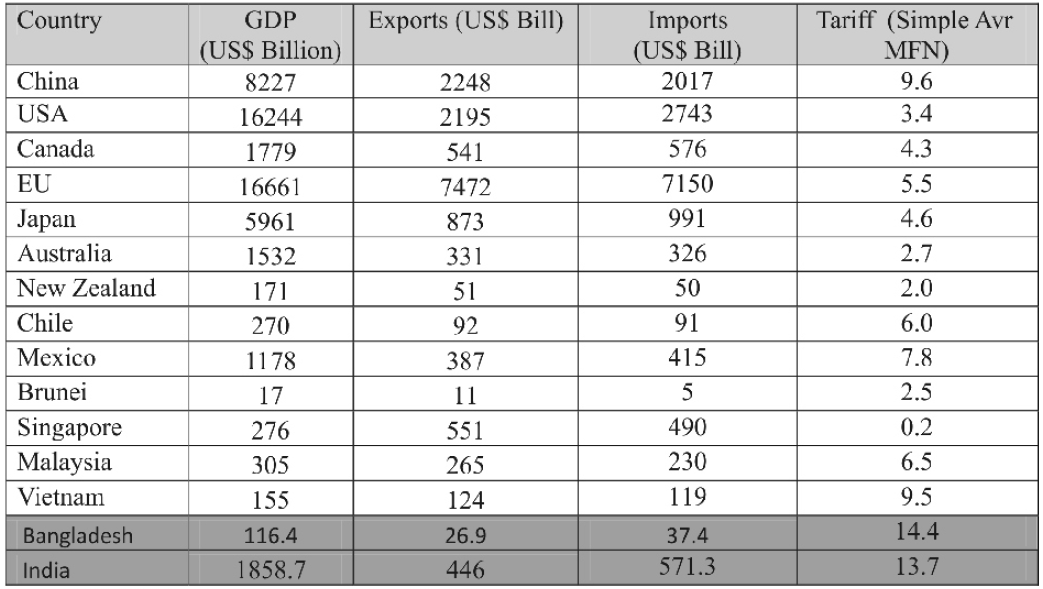
Source: World Development Indicators (2014) and
http://www.wto.org/english/tratop_e/tariffs_e/tariff_data_e.htm
Table 2. Intra-regional Trade among TPP and TTIP countries (
US$ Billion )
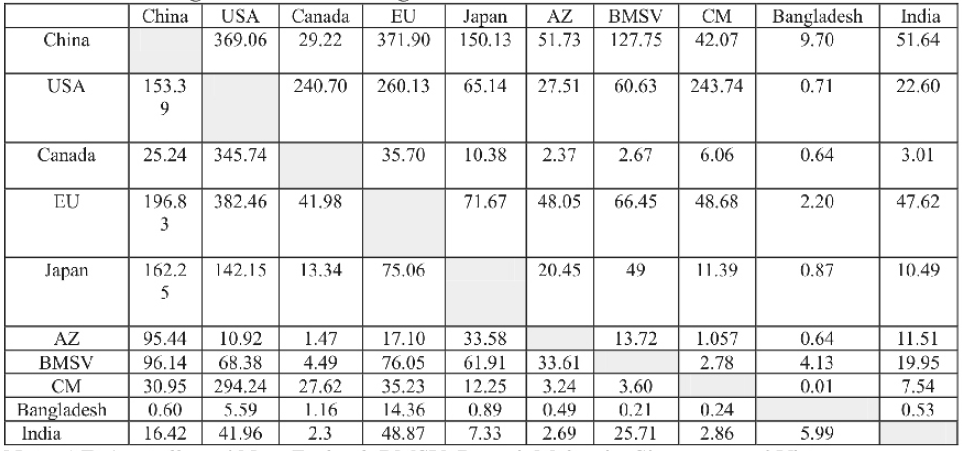
Note: AZ: Australia and New Zealand, BMSV: Brunei, Malaysia, Singapore and Vietnam
CM: Chile and Mexico
Source: UNCOMTRADE 2014
The GTAP Model for Macroeconomic Analysis
The most common modeling technique for estimating economic impacts of a trade agreement
with economy-wide effects involves the computable general equilibrium (CGE) modeling
framework of the Global Trade Analysis Project (GTAP) . The general equilibrium
model is thoroughly documented in Hertel (1997) and in the GTAP database documentation
(Dimaranan, 2006). It is a comparative static multi-regional CGE model.
The basic structure of the GTAP database includes: industrial sectors, households,
governments, and global sectors across countries. Countries and regions in the world
economy are linked together through trade. Prices and quantities are simultaneously
determined in both factor markets and commodity markets. The main factors of production
are skilled and unskilled labor, capital, natural resources and land.
Producers operate under constant returns to scale, where the technology is described
by the Leontief and CES functions. Two broad categories of inputs are identified:
intermediate inputs and primary factors of productions. In the model, firms minimize
costs of inputs given their level of output and fixed technology. First,
producers use composite units of intermediate inputs and primary factors in fixed
proportions following a Leontief production function. At the second level of the
production nest, intermediate input composites are obtained combining imported bundles
and domestic goods of the same input-output group. Trade policy can affect the price
of traded goods relative to domestically produced goods. As a result, a key relationship
for model analysis is the degree of substitution between imported and domestic goods.
This key relationship is commonly identified as the Armington elasticity. It is
assumed that domestically produced goods and imports are imperfectly substituted.
This is modeled using the Armington structure.
Households’ behavior in the model is determined from an aggregate utility function.
The aggregate utility is modeled using a Cobb-Douglas production function with constant
expenditure shares. This utility function includes private consumption, government
consumption and savings. Current government expenditure goes into the regional household
utility function as a proxy for government provision of public goods and services.
Private households’ consumption is explained by a constant difference elasticity
expenditure function.
Domestic support and trade policy (tariff barriers) are modeled as ad valorem equivalents.
These policies have a direct impact on the production and consumption sectors in
the model. In equilibrium, all firms have zero real profit, all households are on
their budget constraint, and global investment is equal to global savings. Changing
the model’s parameters allows one to estimate the impact from a country’s/region’s
original equilibrium position to a new equilibrium position.
The simulation represents what the economy would look like if the policy change
or shock had occurred. The difference in the values of the endogenous variables
in the baseline and the simulation represents the effect of the policy change. All
the policy simulations as well as results reported in the paper, as in other major
models of this type, may be thought of as occurring in one-shot over a time-period
that is needed for equilibrium to be achieved. This time-period is akin to what
is widely thought of by economists as ‘medium run’, possibly 3-5 years in a go.
So the model should be able to foretell the effect on trade and production patterns
if the trade policy was changed. Furthermore, based on the change in welfare, the
policy-maker would be able to judge whether the country benefited from the change
in policy or not.
The GTAP framework has strength because of theoretical rigor, its ability to represent
direct and indirect interactions among all sectors of an economy and precise detailed
quantitative results. The strength of the multi-country CGE model is that incorporates
in an elegant manner, the features of neo-classical general equilibrium and real
international trade models in an empirical framework (Thierfelder, et al., 2007).
However, this study does not adequately capture the service trade reforms and thus
the result may underestimate the potential effect of liberalization where services
sector is to be included. It is to be noted that GTAP model has both static and
dynamic versions. However, in this paper, static GTAP model is used. Gilbert (2013)
mentioned that the static model has disadvantages relative to dynamic techniques,
of not describing the time path, i.e. attention in the analysis is concentrated
on the end outcome rather than the transition. The model’s results may be very sensitive
to the assumptions and data used. Almost all CGE exercises include a sensitivity
analysis to obtain a range of results based on different assumptions or data.
Data and Country and Sectoral Aggregation
The study makes use of Version 8 of the GTAP database which has been released in
2012. Data on regions and commodities are also aggregated to meet the objectives
of this study. Version 8 of the GTAP database covers 57 commodities, 129 regions/countries
and 5 factors of production. For the sake of convenience the 129 regions have been
aggregated to 17 regions and the 57 commodities have been aggregated into 10 as
shown in Annex 1. The regions selected include major nineTPP countries (Australia
and New Zealand as one country), the EU, five South Asia countries, China, Sub Saha
Africa (SSA) and Rest of the World. The study has simulated three different scenarios
including on EU-USA FTA, TPP free trade agreement and a alternative scenario where
if South Asianjoin into the TPP.
Analysis of the Simulation Results: Welfare and Macroeconomic Effects
Based on the model simulations, this section reports the results that show the likely
impacts on important macro-economic variables, economic welfare, industry outputs
and exports. We have analyzedfour different scenarios. Under Scenario I,
elimination of all import tariffs by the EU and the USA and their vice versa, under
Scenario II, all 12 TPP countries eliminates tariff for each
other. We have also adopted one alternative scenario if South Asia joinsinto the
TPP.
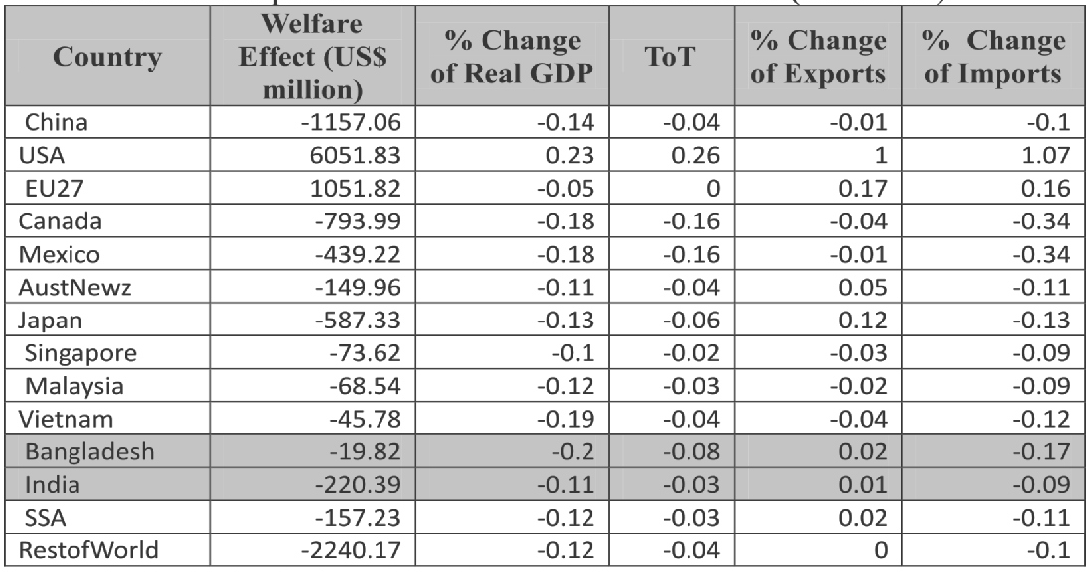
Table 3.Impact of Tariff Eliminations under TPP ( Scenario I
)
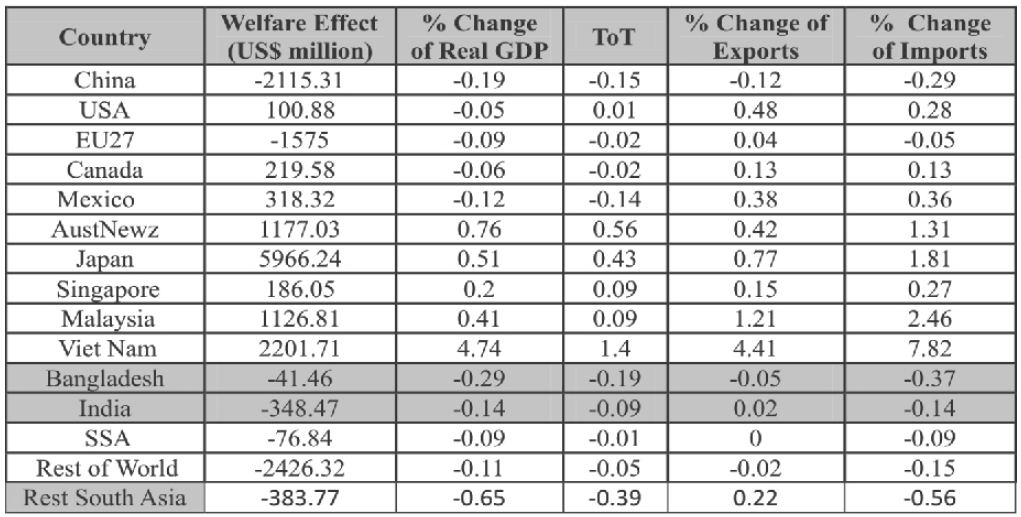
Source : Author’s simulation of GTAP version 8.
The effects of TPP can be assessed at both the macro-economic and sectoral levels
of analysis. The welfare and other macroeconomic effects of the simulations for
the countries/regions concerned are presented in Table 3.
Under Scenario I, if the TTP countries completely eliminate import tariffs
each other. Among south Asian countries, Bangladesh and India could also face tremendous
pressure in terms of export and welfare. In terms of real GDP, Bangladesh may the
biggest suffer,followed by Indiaamong the South Asian countries.Bangladesh
exports are expected to drop by about 0.05 per cent and the welfare loss
equals US $.042billion whereas, Indiaexports are expected to increase
by about 0.02 per cent and the welfare loss equals US $3.49 billion.
In addition to China would experience a fall in real GDP by 0.2 per cent
if the deal becomes realized. However, the biggest welfare gains from this mega
FTA could be by Japan followed by the USA and Vietnam. The EU may lose their welfare
and real GDP significantly. This mega TPP FTA deal could tremendously negatively
affect Bangladesh and India economy and which could be much higher compared to TTIP.
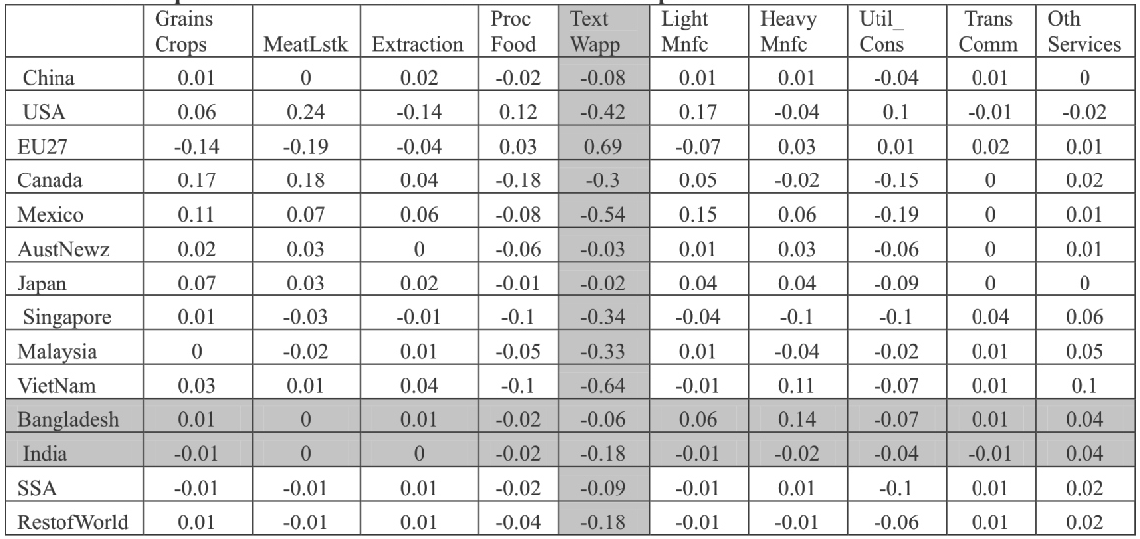
Table 4. Impact of Tariff Eliminations under TPP on Output
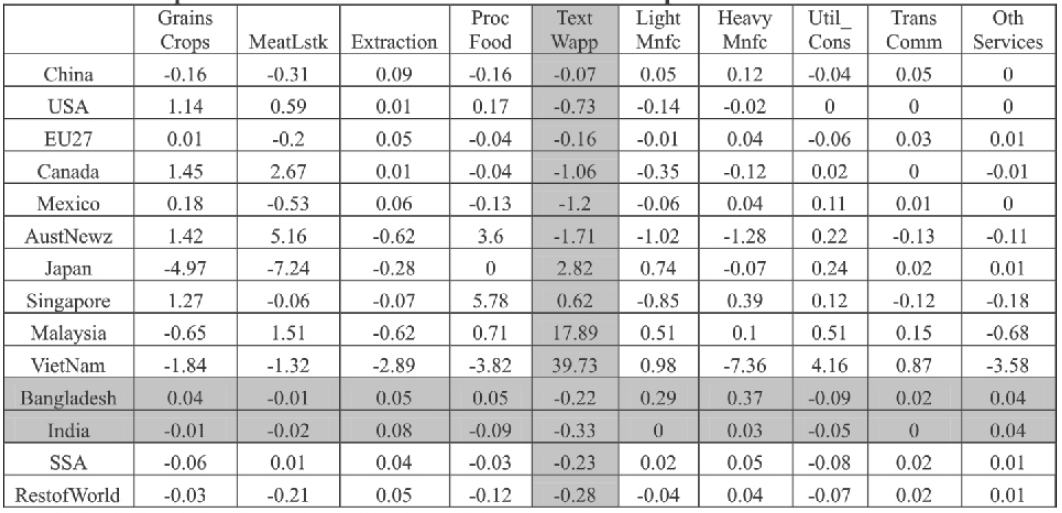
Source : Author’s simulation of GTAP version 8.
The table 4 shows the sectotal analysis under TPP. It shows that under TPP, South
Asian Textiles and Clothing will suffer tremendously and production may fall significantly.
Bangladesh (0.22%) and India (0.33%) could be affected negatively
the most among the South Asian. The production in textiles and clothing of Vietnam
could be increased about 40%.
Under Scenario II (table 5), if the EU and the USA completely eliminates
import tariffs each other, Bangladesh and India would experience a fall in real
GDP and loss welfare but not very significantly compared to TPP. This mega FTA deal
could affect negatively almost all part of the world. However, the biggest welfare
gain by the USA which could be about US $ 6.1 billion and the EU would also gain
welfare significantly. Chinese exports are expected to drop by about 0.01 per cent
and the welfare loss equals US $ 1.2 billion. China would experience a fall in real
GDP by 0.14 per cent if the deal becomes realized.
Table 5.Economic Impact of Tariff Eliminations under TTIP ( Scenario
II )
Source : Author’s simulation of GTAP version 8.
The table 6 under TTIP both Bangladesh and India industry may face some difficulties
for Textile and Clothing industry.The service sector of the USA and the EU may gain
enormously. The TTIP could also heat Chinese textiles and apparels and service industry.
Table 6. Impact of Tariff Eliminations under TTIP on Output
The table 7 shows the economic impact of TTP if South Asian countries able to join
TPP (under scenario III).It shows that Bangladesh and Indiacould gain
significantly in terms of welfare, real GDP as well as exports. This indicates that
Bangladesh and India should try to enter into the TPP deal.
Table 7.Economic Impact of Tariff Eliminations under TPP including SA ( Scenario
III )
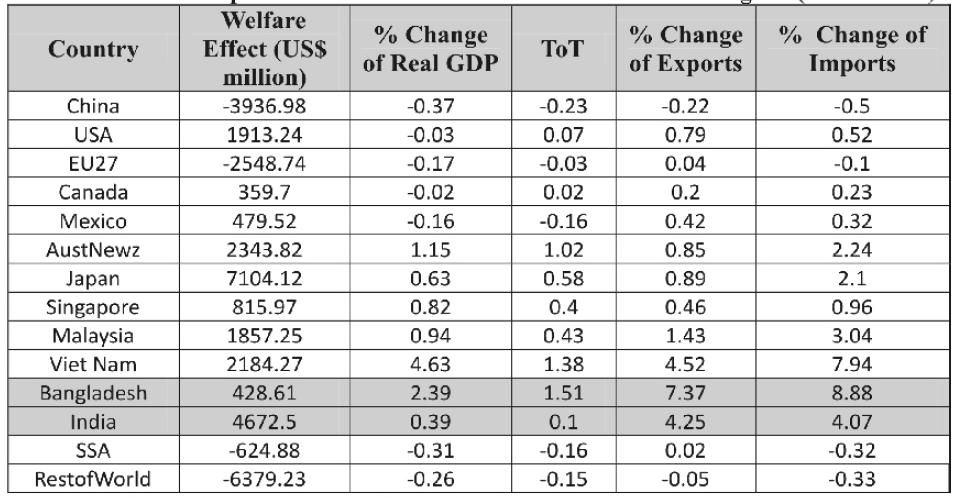
Source : Author’s simulation of GTAP version 8.
The sectotal analysis (table 8) shows the positive pictures. The main textiles and
clothing sector could increase output for Bangladesh(6.59%) and India (6.11%)
tremendously. However, the agricultural and industrial sector may reduce production
in this regards, adverse effects on agricultural sectors could be more negative
if non-tariff measures are taken into consideration
Table 8. Impact of Tariff Eliminations under TTIP on Output
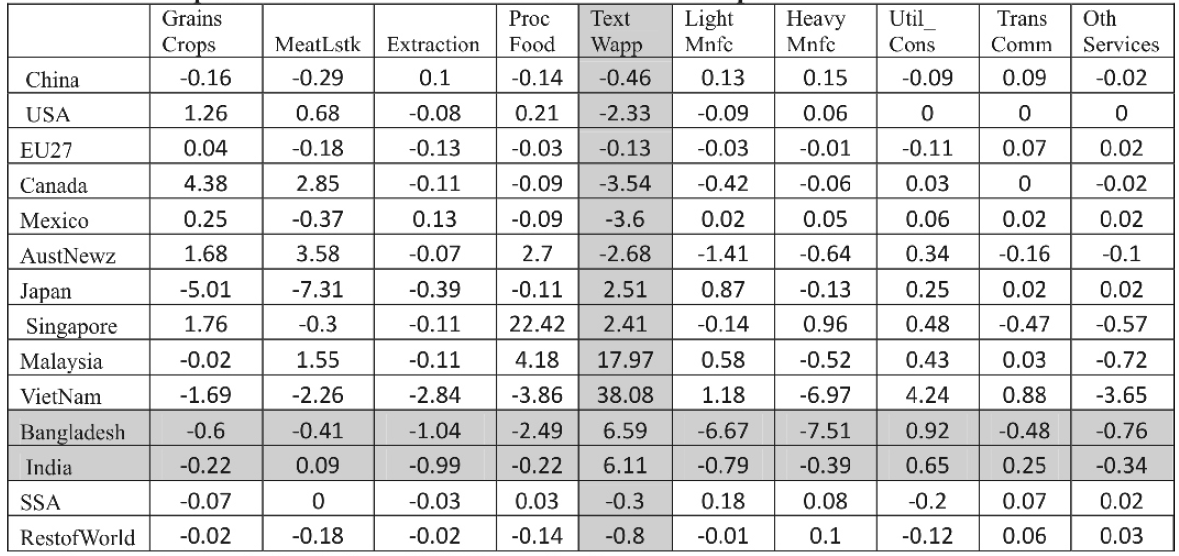
Source : Author’s simulation of GTAP version 8.
Conclusion
The CGE analysis show mix results under three different situation for Bangladesh
and Indian Economy.Under Scenario I, Bangladesh exports are expected
to drop by about 0.05 per cent and the welfare loss equals US $.042
billion whereas, Indiaexports are expected to increase by about 0.02
per cent and the welfare loss equals US $.083 billion. In addition to China
would experience a fall in real GDP by 0.2 per cent if the deal becomes realized.Under
scenario II, Bangladesh and India would also experience a
fall in real GDP and loss welfare but not very significantly compared to TPP. This
mega FTA deal could affect negatively almost all part of the world. Scenario III
shows that Bangladesh and Indiacould gain significantly in terms of welfare,
real GDP as well as exports. This indicates that Bangladesh and India should try
to enter into the TPP deal.
Limitation of the Study
The model’s results may be very sensitive to the assumptions and data used, almostall
CGE exercises include a sensitivity analysis to obtain a range of results based
ondifferent assumptions or data. A second problem with CGE analysis is the lack
of atime dimension. A CGE analysis of an FTAwill not provide results on how long
it willtake for economies to adjust and reach the new equilibrium. Recent work in
CGEmodeling has attempted to include some dynamic effects via financial markets,but
it is a long way from capturing the dynamic features that are most relevant toFTAs.
Moreover, it is difficult to model certain non-tariff barriers to trade, such assanitary,
phytosanitary and technical barriers, or customs issues if these are includedin
an FTA.
References
Akhtar S.I and Vivian C.J (2014) “Transatlantic Trade and Investment Partnership
(TTIP) Negotiations” Congressional Research Service,USA
http://transatlantic.sais-jhu.edu/publications/CRS_TTIP_report_Feb_2014.pdf, accessed
on 27 June 2014
ArifOduncu and MerveMavus and DidemGunes (2014), “The Possible Effects of Trans-Pacific
Partnership on Turkish Economy”, MPRA Paper No. 52917, posted 14. January 2014 08:01
UTC http://mpra.ub.uni-muenchen.de/52917/
Armington, Paul S. (1969) “A Theory of Demand for Products Distinguished by Place
of Production”IMF Staff Papers, V.16, no.1, pp. 159-176
Gasiorek M. et al. (2010) Mid-term Evaluation of the EU’s Generalised System of
Preferences, Centre for Analysis for Regional Integration at Sussex, University
of Sussex.
Gilbert, John (2013), “The Economic impact of new regional trading developments in
the ESCAP region” Asia Pacific development journal vol.20, no. 1, June.
Ham Peter V. (2013) “The Geopolitics of TTIP”, Clingendael Policy Brief No. 23 Netherlands
http://www.clingendael.nl/sites/default/files/The%20Geopolitics%20of%20TTIP%20-%20Clingendael%20Policy%20Brief.pdf
accessed on 27 June,2014
Hertel, T.W. (ed.) (1997), Global Trade Analysis: Modeling and Applications,
Cambridge and New York: Cambridge University Press.
Inkyo Cheong (2013), “Negotiations for the Trans-Pacific Partnership Agreement:
Evaluation and Implications for East Asian Regionalism”, ADBI Working Paper Series,
Working no. 428, Asian Development Bank Institute.
Jim Rollo et.al (2014):“Potential Effects of the Proposed Transatlantic Trade and
Investment Partnership on Selected Developing Countries”, CARIS, University of Sussex,
Brighton, UK
http://tradesift.com/Reports/Potential%20Effects%20of%20the%20Proposed%20Transatlantic%20Trade%20and%20Investment%20Partnership%20on%20Selected%20Developing%20Countries_DFID_Final%20Report_July2013.pdf
, accessed on 27 June2014
Kimura Fukunari, 2006, “International Production and Distribution Networks in East
Asia: Eighteen Facts, Mechanics, and Policy Implications”, Asian Economic
Policy Review, vol. 1, Issue 2, pp 326–344, December
Lee Hiro and Ken Itakura (2014), “TPP, RCEP and Japan’s Agricultural Policy Reforms”,
OSIPP Discussion Paper: DP-2014-E-003.
Mikic, Mia (2009), ASEAN and Trade Integration, Staff Working paper 01/09, TID,
ESCAP (http://www.unescap.org/tid/publication/swp109.pdf )
Narayanan. Badri and Sachin Kumar Sharma (2014) An analysis of Trans-Pacific Atlantic
Partnership (TPP): Implications for Indian Economy, Centre for WTO Studies, Indian
Institute of Foreign Trade, New Delhi, India
Petri, Peter A. ,Michael G. Plummer, and Fan Zhai (2011), “The Trans-pacific partnership
and Asia-pacific integration: A quantitative Assessment”, Economic series no. 119,
East-West centre working papers, October 24
Rahman M.M and Cheong I. (2014) “New Trade Policy of EU: Implication for LDCs”,
Journal of International Trade and Logistics, Vol 12. No. 1. Incheon, Korea
Winters, L Alan , et.al (2009) Innocent
Bystanders: Implications of an EU-India free trade agreement for excluded countries
. Commonwealth Secretariat, United Kingdom
Xin, Li (2013) “Asia-China Economic Integration will be Bright Even without TPP”,
GTAP resource paper 4210
Xin, Li (2014), “A General Equilibrium Analysis of the TPP Free Trade Agreement
With and Without China”, The Journal of Applied Economic Research May 2014 8: 115-136.
Annex 1. Regional and Commodity Aggregation of GTAP Database
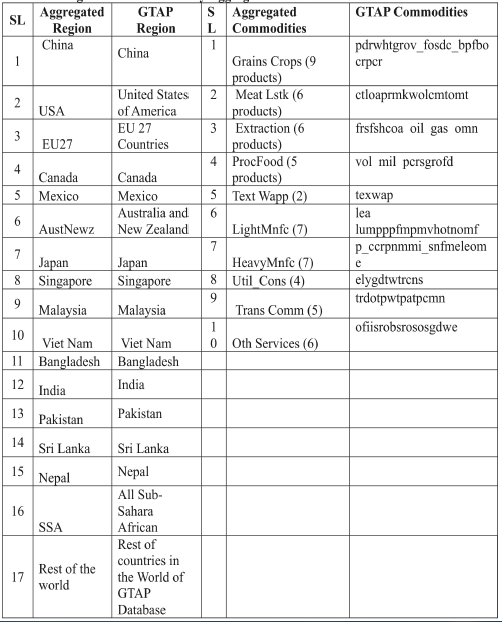
Source: GTAP version 8

