Satisfaction of Students towards Quality in Higher Education-A Study of Higher Education
Sector Punjab (India)
|
HARPREET KAUR
Research Fellow
Department of Commerce
Guru Nanak Dev University, Amritsar (Punjab)
Email: preeti356@yahoo.co.in
|
Dr. G.S. BHALLA
Professor
Department of Commerce
Guru Nanak Dev University, Amritsar (Punjab)
Email: hellogsbhalla@gmail.com
|
Abstract
Education plays a very important role in the growth and prosperity of any nation.
Punjab, a well known state of north India, is a leader in providing education. The
Punjab education system has witnessed a significant expansion in the recent years,
both in terms of number of institutions as well as students enrolment. But, the
quality of education still remains poor. The present study aims to evaluate the
effectiveness of the higher educational institutions in providing quality education,
from the view-point of students in Punjab. The study covers three districts of Punjab
i.e. Amritsar, Jalandhar and Ludhiana. Primary data has been collected to achieve
the objectives of the study. A well structured questionnaire containing 32 items
has been used for the purpose of the study. The respondents have been asked to rate
the quality of education, using a five point likert scale. Descriptive and Exploratory
Factor analysis have been used to analyze the data. Percentages, graphs and diagrams
also have been used for analysis of the study. The factor analysis has resulted
in eight factors showing the satisfaction of students regarding the quality of education
in their institution. As per the results, the availability of infrastructure facilities
as an important factor followed by placement services, education environment, extracurricular
activities, knowledge up gradation, academic facilities, student support services
and academic staff.
Keywords: Education, Punjab, Quality, Satisfaction, Students
Introduction
Education is becoming much more of a “product” with varying customers
and stakeholders, and what the latter now demand is satisfaction and value for money
(Sanhey et.al, 2008). It is education that develop expertise, excellence and knowledge
that leads to the overall development of any economy (Tanmay,2011). Higher education
is the backbone of any society. It is the quality of higher education that decides
the quality of human resources in a country (Mishra,). Quality has become the defining
element of education in the 21st century in the context of new social
realities (NAAC). But, the quality of Indian higher education system lags behind.
The overall quality scenario of higher education in India does not match with the
global quality standards. The quality measures play a vital role in the education
provided by higher educational institutions. In higher education and institutions
must design its basic goals and objectives to satisfy customers by offering market
drive academic and career programs by providing quality teaching and learning environment,
and by providing adequate student support services (Ibekwe; 2006, Kaur; 2010). Quality
could be determined by their internal as well as external resources viz; students
experience, faculty experience, infrastructure facilities, learning resources etc.
In the present paper an attempt has been made to examine the quality of higher education
in Punjab from the viewpoint of students.
Higher Education in Punjab
Higher education department, government of Punjab provided education for undergraduate
and post graduate level in various discipline under the supervision and guidance
of the education minister and principal secretary higher education, government of
Punjab. The state has been also ranked 7th amongst the all Indian states
in terms of education.
Number of Higher Educational Institutions in Punjab
|
Universities
|
12
|
|
Government colleges
|
46
|
|
Government aided colleges
|
136
|
|
Private colleges
|
303
|
Source: Directorate of Public Instruction, Punjab
In general development of higher education in Punjab is seen to be relatively superior
but higher education suffers from several deficiencies. Lack of infrastructure facilities,
excessive tuitions fees, excessive and discriminationary system of Admissions, financial
constraints, quota system, political interference, lack of autonomy and poor quality
research are some problems in higher education. The quality standards in higher
education are low and declining.
Review of Literature
Quality management in education is a priority issue today for research and analysis.
Various studies have been conducted on examining the quality indicators in higher
education. Bagalkoti et al. (2006) investigated the perception
of students regarding quality in higher education. Study was conducted at Karnataka
University in India. A random sample of 90 students was selected. Ratio analysis
was used for analyzing the data. Researcher found the following dimensions of quality
management; 1) mode of entry into the courses; 2) nature of curriculum; 3) quality
of teaching; 4) evaluation process; 5) infrastructure for higher education. Researcher
recommended that multidisciplinary curriculum should be developed to fulfill the
expectations of learner, teachers, parents, employers and society; 2) interactive
teaching learning process should be adopted; 3) appropriate and effective feedback
mechanism should be established. Butt and Rehman (2010) investigated
the determinants of students’ satisfaction in higher education in Pakistan
and their impact on the level of satisfaction. The sample size comprised of 350
students from different private and public sector universities. Study focused on
the factors like; 1) teachers’ expertise; 2) course offered; 3) learning environment
and; 4) classroom facilities. The results of regression analysis revealed that all
factors have significant and positive impact on student’s satisfaction in
higher education. Jenssen et al. (2010) examined the overall satisfaction
of students towards students learning experience. The analysis revealed that the
academic and pedagogic quality of teaching were crucial determinant of students
satisfaction. Khosravi et al. (2013) focused on the determination
of factors affecting student satisfaction of Islamic university of Iran. Sample
size was included 324 undergraduate and 60 graduate students from 10 colleges of
Islamic Azad University. Seven factors were extracted by applying factor analysis.
Academic advising effectiveness as a most important aspect of students’ educational
experience followed by campus support services, campus life, responsiveness to diverse
population, safety and security, campus climate and financial aid effectiveness.
NEED OF THE STUDY
Global competitiveness has necessitated for education industry. With the expansion
of higher educational institutions there is a need to develop quality assurance
measures to improve quality in higher education. In general development of education
in Punjab is seen to be relatively superior but lack of infrastructure facilities,
excessive tuitions fees, excessive and discriminationary system of Admissions, financial
constraints, quota system, political interference, lack of autonomy and poor quality
research are some problems in higher education. An education set up characteristics
a large number of interested parties such as students, faculty, supporting staff,
administration, parents of the students. (Mahapatra and Khan, 2007). Students are
the primary customer and their satisfaction is vital for determining quality dimensions
of higher education. So, the objective of the study is to measure the satisfaction
of students towards quality in higher education in Punjab.
Research Methodology
Primary data has been collected to achieve the objectives of the study. The study
covered three districts of Punjab i.e. Amritsar, Jalandhar and Ludhiana. A well
structured self administered questionnaire has been used for the purpose of the
study. Data have been collected from various colleges of Punjab through purposive
sampling. A total of 210 questionnaires have been distributed and 189 questionnaires
have been received. Out of 189 questionnaires 21 questionnaires were found to be
incomplete so, finally 162 questionnaires have been considered for further analysis
which represents 77.14% of the response rate.
Tools of Analysis
Exploratory Factor analysis and descriptive have been used to analyze the data.
Exploratory Factor analysis is a data reduction tool and represents correlated variables
with a smaller set of derived variables. Appropriateness of the data to apply factor
analysis has been checked with the help of following measures (Kaur, 2010).
Kaiser-Meyer-Olkin Measure of Sampling Adequacy : KMO measure the
sampling adequacy. This measure varies between 0 and 1, and values closer to 1 are
better. A value of .6 is a suggested minimum
Bartlett’s test of sphercity : Bartlett’s test of sphercity
is a test statistics used to examine the hypothesis that the variables are uncorrelated
in the population.
Communalities : communalities are the amount of variance a variable
shares with all the other variables.
Eigenvalue : The Eigenvalue represent the total variance explained
by each factor.
Factor Loadings : Factor loadings are the simple correlation between
the variables and factors.
Development of Research Instrument
The literature review (Kwan and Ng, 1999; Gruber et al., 2010; Tsinidou et al.,
2010; Annamdevula and bellamkonda, 2012; Uche, 2012; Jain et al., 2013; Ahmad and
Masud, 2014) provided the basis for generating questionnaire. Questionnaire divided
into three parts. Part A containing 53 statements related to perception of students
towards quality of higher education. The respondents have been asked to rate the
quality of higher education, using a five point likert scale ranging from “strongly
agree” as 5 to “strongly disagree” as 1. Initial scale was consisting
of 53 items. Exploratory factor analysis has been run to improve the survey questionnaire.
Factor loading more than .45 retained and 32 items retained for further analysis.
Part B contained 3 questions including one open ended question on suggestion about
the quality in higher education. Part C contained demographic profile of the students.
Data Analysis and Interpretation
This section shows the details about the descriptive statistics and the results
of the students’ rating. Tables and graphs have been used to make the data
more understandable. It also gives the details of the factor analysis.
Descriptive Statistics
|
Description
|
Percentages
|
Gender: Male
Female
|
34%
66%
|
|
Total
|
100
|
Age:
Below 18
18-20
20-22
Above 22
|
1.9
27.8
51.9
18.5
|
|
Total
|
100
|
Courses:
BA
B.Com
BBA
B.sc
MA
M.com
|
7.4%
24.1%
4.9%
9.9%
8.6%
30.2%
|
|
Total
|
100
|
The results showed that as greater (66%) were female than male (34%). Respondents
were aged below 18 (1.9%) followed by 18-20 (27.8%), 20-22 (51.9%) and above 22
(18.5%).In terms of educational background (7.4 %.) students had a background of
BA, (24.1%) B.Com, (4.9%) BBA, (9.9%) B.Sc, (8.6%) MA and (30.2%) M.Com.
Students Rating for Overall Quality of the Higher Education
The questions asked to students’ rate the overall quality of higher education
in the scale of 1-10, where increasing order indicates good quality. The scale has
been given 5 options “1-2 (very poor), 2-4 (poor), 4-6 (average), 6-8 (good),
and 8-10 (very good)”. The figure 1 shows the percentage of students rated
the overall quality of higher education.
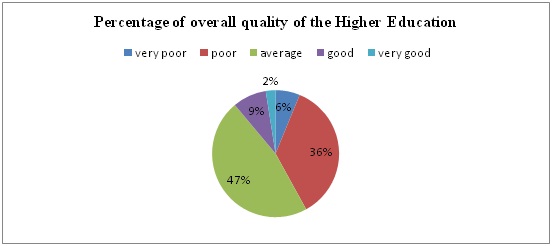
Figure 1
Optimum Utilization of Resources
Students were asked about the efficient utilization of resources by the higher educational
institution. Figure 2 exhibits that majority of students responded that higher educational
institution not using its resources optimally.
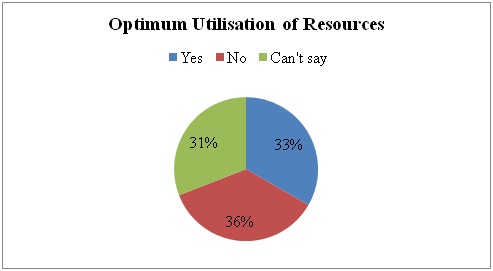
Figure 2
Exploratory Factor Analysis
Factor analysis has been run using principal component matrix and varimax rotation
to examine the validity and reliability of the statements. Thirty two statements
loaded more than .45 is kept under 8 factors using SPSS 17. In table 1 the null
hypothesis is that the variables are uncorrelated in the population rejected by
Bartlett’s test of sphercity. The approximate chi square statistics is 2934.554
(very large value) with 496 degree of freedom, which is significant at the 0.05
level. The value of KMO statistics (.863) is also large (.6). Thus factor analysis
may be considered an appropriate technique for analyzing the perception of students
towards quality in higher education.
|
KMO and Bartlett's Test
|
|
Kaiser-Meyer-Olkin Measure of Sampling Adequacy.
|
.863
|
|
Bartlett's Test of Sphericity
|
Approx. Chi-Square
|
2934.554
|
|
df
|
496
|
|
Sig.
|
.000
|
Table 2 states that there are 8 factors which have Eigen value of 1 or more than
1. Eight factors extracted together account for 70.03% of total variance. With only
8 factors, reducing the 32 we have lost only 29.97% of the information content while
70.03% is retained by the 8 factors extracted out of the 32 original factors.
|
Total Variance Explained
|
|
Component
|
Initial Eigenvalues
|
Extraction Sums of Squared Loadings
|
Rotation Sums of Squared Loadings
|
|
Total
|
% of Variance
|
Cumulative %
|
Total
|
% of Variance
|
Cumulative %
|
Total
|
% of Variance
|
Cumulative %
|
|
1
|
9.726
|
30.395
|
30.395
|
9.726
|
30.395
|
30.395
|
4.033
|
12.602
|
12.602
|
|
2
|
2.874
|
8.981
|
39.376
|
2.874
|
8.981
|
39.376
|
3.479
|
10.873
|
23.475
|
|
3
|
2.772
|
8.663
|
48.039
|
2.772
|
8.663
|
48.039
|
3.118
|
9.743
|
33.218
|
|
4
|
1.875
|
5.859
|
53.898
|
1.875
|
5.859
|
53.898
|
2.952
|
9.224
|
42.442
|
|
5
|
1.547
|
4.835
|
58.732
|
1.547
|
4.835
|
58.732
|
2.383
|
7.448
|
49.890
|
|
6
|
1.331
|
4.159
|
62.891
|
1.331
|
4.159
|
62.891
|
2.267
|
7.083
|
56.973
|
|
7
|
1.232
|
3.850
|
66.741
|
1.232
|
3.850
|
66.741
|
2.126
|
6.643
|
63.615
|
|
8
|
1.055
|
3.297
|
70.039
|
1.055
|
3.297
|
70.039
|
2.056
|
6.424
|
70.039
|
|
9
|
.885
|
2.766
|
72.805
|
|
|
|
|
|
|
|
10
|
.792
|
2.476
|
75.281
|
|
|
|
|
|
|
|
11
|
.753
|
2.354
|
77.635
|
|
|
|
|
|
|
|
12
|
.703
|
2.198
|
79.833
|
|
|
|
|
|
|
|
13
|
.637
|
1.990
|
81.823
|
|
|
|
|
|
|
|
14
|
.564
|
1.764
|
83.586
|
|
|
|
|
|
|
|
15
|
.501
|
1.565
|
85.151
|
|
|
|
|
|
|
|
16
|
.466
|
1.456
|
86.608
|
|
|
|
|
|
|
|
17
|
.438
|
1.369
|
87.977
|
|
|
|
|
|
|
|
18
|
.389
|
1.216
|
89.193
|
|
|
|
|
|
|
|
19
|
.371
|
1.161
|
90.354
|
|
|
|
|
|
|
|
20
|
.362
|
1.131
|
91.485
|
|
|
|
|
|
|
|
21
|
.351
|
1.096
|
92.581
|
|
|
|
|
|
|
|
22
|
.300
|
.939
|
93.520
|
|
|
|
|
|
|
|
23
|
.294
|
.920
|
94.440
|
|
|
|
|
|
|
|
24
|
.271
|
.848
|
95.288
|
|
|
|
|
|
|
|
25
|
.249
|
.777
|
96.065
|
|
|
|
|
|
|
|
26
|
.244
|
.764
|
96.829
|
|
|
|
|
|
|
|
27
|
.224
|
.701
|
97.530
|
|
|
|
|
|
|
|
28
|
.196
|
.613
|
98.143
|
|
|
|
|
|
|
|
29
|
.168
|
.526
|
98.669
|
|
|
|
|
|
|
|
30
|
.155
|
.484
|
99.153
|
|
|
|
|
|
|
|
31
|
.143
|
.447
|
99.600
|
|
|
|
|
|
|
|
32
|
.128
|
.400
|
100.000
|
|
|
|
|
|
|
|
Extraction Method: Principal Component Analysis.
|
Factor Analysis Results (Rotated)
|
Factors
|
Statements
|
Factor Loadings
|
Mean Score
|
S.D.
|
|
Factor 1
|
Infrastructure Facilities
|
|
|
|
|
1
|
There is enough space for parking in the college.
|
.814
|
3.57
|
1.02
|
|
2
|
Sufficient playgrounds are available.
|
.789
|
3.61
|
1.08
|
|
3
|
Adequate sports material is available.
|
.770
|
3.52
|
1.03
|
|
4
|
Sufficient first aid medical facilities are available.
|
.759
|
3.33
|
1.05
|
|
5
|
Fresh drinking water is available.
|
.690
|
3.62
|
1.07
|
|
6
|
Classrooms are well equipped.
|
.547
|
3.27
|
1.08
|
|
7
|
College has well maintained study rooms.
|
.483
|
3.27
|
1.08
|
|
|
Cronbach’s Alfa=.90
Percentage of variance=12.602
|
|
|
|
|
Factor 2
|
Placement Services
|
|
|
|
|
1
|
Number of campus placement is good.
|
.865
|
2.97
|
1.32
|
|
2
|
Placement services are provided by the college.
|
.831
|
3.06
|
1.32
|
|
3
|
Career counseling sessions are conducted at regular interval
|
.830
|
2.77
|
1.22
|
|
4
|
Students get good salary packages.
|
.829
|
2.88
|
1.17
|
|
|
Cronbach’s Alfa=.91
Percentage of variance=10.873
|
|
|
|
|
Factor 3
|
Education Environment
|
|
|
|
|
1
|
There is a congenial environment for study.
|
.854
|
3.83
|
.882
|
|
|
Students respect teachers.
|
.701
|
4.03
|
.824
|
|
3
|
Teachers in the college are innovative.
|
.676
|
3.69
|
.880
|
|
4
|
Teachers in the college give proper attention to students.
|
.650
|
3.77
|
.941
|
|
5
|
Teacher taught ratio is a s per norms.
|
.645
|
3.65
|
.888
|
|
|
Cronbach’s Alfa=.824
Percentage of variance=9.743
|
|
|
|
|
Factor 4
|
Extracurricular activities
|
|
|
|
|
1
|
College has a NCC unit.
|
.801
|
4.01
|
.956
|
|
2
|
Students participate in NCC activities.
|
.800
|
3.96
|
.955
|
|
3
|
Students actively participate in extracurricular activities.
|
.764
|
3.87
|
1.022
|
|
4
|
Extracurricular activities are organized by the college.
|
.745
|
4.02
|
.878
|
|
|
Cronbach’s Alfa=.827
Percentage of variance=9.224
|
|
|
|
|
Factor 5
|
Knowledge Up gradation
|
|
|
|
|
1
|
Guest lectures are arranged.
|
.819
|
3.19
|
1.04
|
|
2
|
students actively participate in guest lectures
|
.757
|
3.36
|
1.10
|
|
3
|
Educational visits are organized for students
|
.733
|
3.10
|
1.27
|
|
|
Cronbach’s Alfa=.81
Percentage of variance=7.448
|
|
|
|
|
Factor 6
|
Academic facilities
|
|
|
|
|
1
|
Sufficient computers are available in my college.
|
.781
|
3.44
|
1.29
|
|
2
|
Students are informed regularly about updated library collection.
|
.675
|
2.91
|
1.28
|
|
3
|
Libraries are rich and updated with material related to subjects.
|
.536
|
3.48
|
1.04
|
|
|
Cronbach’s Alfa=.714
Percentage of variance=7.083
|
|
|
|
|
Factor 7
|
Student support services
|
|
|
|
|
1
|
The college has students’ grievances redressal cell
|
.823
|
3.13
|
1.14
|
|
2
|
Grievances are redressed effectively.
|
.783
|
3.11
|
1.05
|
|
3
|
The teachers pay considerable attention to the personality development of students.
|
.544
|
3.32
|
1.18
|
|
|
Cronbach’s Alfa=.784
Percentage of variance=6.643
|
|
|
|
|
Factor 8
|
Academic staff
|
|
|
|
|
1
|
Teachers inspire students for study
|
.777
|
3.96
|
.806
|
|
2
|
Teachers are easily accessible
|
.703
|
3.72
|
.927
|
|
3
|
Teachers share a cordial relationship with students.
|
.676
|
3.87
|
.842
|
|
|
Cronbach’s Alfa=.707
Percentage of variance=6.424
|
|
|
|
Percentage of total variance has found to be 70.03%. The reliability for each factor
were tested by Cronbach’s alpha (α).The value of α for each dimension
was .90, .91, .82, .83, .81, .71, .78, .70 respectively. The overall reliability
coefficient (α) of .924 is far above the thumb rule i.e. 0.6.
In the rotated factor matrix factor 1 has high coefficient for
statement ( There is enough space for parking in the college, Sufficient playgrounds
are available, Adequate sports material is available, Sufficient first aid medical
facilities are available, Fresh drinking water is available, Classrooms are well
equipped and College has well maintained study rooms). This factor has been labeled
as infrastructure facilitiesand it accounts for 12.602% of variance. This factor
is given average rating. Students responded neutral for statements related to infrastructure
facilities.
Factor 2 has high coefficient for statements (Number of campus
placement is good, Placement services are provided by the college, Career counseling
sessions are conducted at regular interval and Students get good salary packages).
So, this factor labeled as placement servicesaccounted for 10.873% of variance.
Students were disagree with statements related to placement services.
Factor 3 has high factor loadings for statements (There is a congenial
environment for study, Students respect teachers, Teachers in the college are innovative,
Teachers in the college give proper attention to students, Teacher-taught ratio
as per norms). This factor may be labeled as education environment with 9.743% of
variance and attitude of students were positive towards education environment.
Factor 4 has high coefficient for statement (College has a NCC
unit, Students actively participate in NCC activities, Students participate in extracurricular
activities, Extracurricular activities are organized by the college).Therefore this
factor may be labeled as extracurricular activities with 9.224% of variance. Students
respond positively for statements related to extracurricular activities.
Factor 5 named as knowledge up gradation accounted for 7.448 %
of variance whereas item loadings ranged from .733 to .819.Students were agreed
with these statements.
Academic facilities being factor 6 have recorded with 7.083% variance.
And item loadings ranged from .536 to .781. Students responded disagree for statements
related to academic facilities.
Factor 7 has high coefficient for statements (The college has students
grievances redressal cell, Grievances are redressed effectively, The teachers pay
considerable attention to the personality development of students). This factor
may be labeled as student support services and accounted for 6.643% of variance.
Positive respond was found for all statements.
Factor 8 has high factor loadings for statements (Teachers inspire
students for study, Teachers are easily accessible, Teachers share a cordial relationship
with students) and this factor may be labeled as academic staff with 6.424% of variance.
Positive respond was found for all statements.
One open ended question has been asked to students to give suggestions for the improvement
of quality in higher education. Majority of the students suggested and demanded
for good placement services by the higher educational institutions, improvement
in infrastructure, provision of more practical training and focus on the skill development,
proper parking facilities, hostel facilities and transportation facilities for rural
area students.
Conclusion and Implications
The question of quality in higher education is directly related to the quality of
teachers, students and infrastructure facilities provided by the educational institutes
(ullah et al, 2011). The study showed that students view infrastructure facilities
as an important factor followed by placement services, education environment, extracurricular
activities, knowledge up gradation, academic facilities, student support services
and academic staff. So, higher educational institutions should try to engage themselves
in the campus placement activities. Infrastructure of the institutions should be
improved. The students should be provided with up-to date equipment and learning
material.
References
. Ahmad and Masud (2014). Measuring Service Quality of Higher Educational Institute
towards Student Satisfaction. American Journal of Educational Research, 2(7), 447-455.
. Annamdevula and Bellamkonda (2012). Development of HiEdQual for Measuring Service
Quality in Indian Higher Education Sector. International Journal of Innovation,
Management and Technology, 3(4), 412-416.
. Bagalkoti, S.T. Devi, B. and Hedge, N. (2006). Student’s Perception of Quality
in Higher Education. University News, 44(46), 7-13.
. Butt, B.Z. and Rehman, K.U. (2010).A Study Examining the Students Satisfaction
in Higher Education. Procedia- Social and Behavioral Sciences, 2, 5446-5450, available
online at www.sciencedirect.com.
. Gruber, T. et al. (2010).Examining Student Satisfaction with Higher Education
Services. International journal of Public Sector management, 23(2), 105-123.
. http://www.ats.ucla.edu/stat/sas/notes2/,
Retrieved as on October 17, 2014.
. Ibekwe, L.A. (2006).Using Total Quality Management to achieve Academic Program
Effectiveness: An Evaluation of Administrator and faculty Perception in Business
Schools at Historically Black Colleges and Universities, Ph.D. Thesis, Capella University,
Minnesota.
. Jain, R., Sahney, S. and Sinha, G. (2013).Developing a Scale to Measure Students’
Perception of Service Quality in the Indian Context. The TQM Journal, 25(3), 276
– 294.
. Jenssen, J.W., Stensaker, B. and Grogaard, J.B. (2010). Student Satisfaction:
Towards an Empirical Decomposition of the Concept. Quality in higher Education,
8(2), 183-195.
. Kaur, D. (2010).Effectiveness of College management- A Comparative View of Teachers
and principals. Asia-Pacific Business Review, 6(2), 150-161.
. Khosravi, A.A., Poushaneh, K., Roozegar, A. and Sohrabifard, N. (2013).Determination
of Factors Affecting Student Satisfaction of Islamic Azad University. Procedia-
Social and Behavioral Sciences, 84, 579-583.
. Kwan, Y.K.P. and Ng, W.K.P. (1999).Quality Indicators in Higher Education- mComparing
Hong Kong and China Students. Managerial Auditing Journal, 4(1/2), 20-27.
. Mahapatra, S.S. and Khan, M.S. (2007).A Framework for Analysing Quality in Education
Settings.European Journal of Engineering Education, 32 (2), 205-217.
. Mishra, S. (2007).Quality Assurance in Higher Education: An Introduction.Commonwealth
of Learning, National Assessment and Accreditation Council.
. NAAC Report on Quality Assurance in Higher Education, 2006.
. Sahney, S., Banwet, D.K. and Karunes, S. (2004).A SERVQUAL and QFD Approach to
Total Quality Education: A Student Perspective. International Journal of Productivity
and Performance Management, 53(2), 143-166.
. Sahney, S., Banwet, D.K. and Karunes, S. (2008).An Integrated Framework of Indices
for Quality Management in Education: A Faculty Perspective. The TQM Journal, 20(5),
502-519.
. Sanhey and Karunes (2008).An Integrated Framework of indices for Quality Management
in Education: Faculty Perspective. TQM Journal, 20 (5), 502-519.
. Stefan and Fikuda (2010). Examining Student Satisfaction with Higher Educational
Services. International Journal of Public Sector Management, 23(2), 105-123.
. Uche (2012).Student Perception of Academic Staff Colleges: a Measure of Quality
Assurance i-South- South Nigerian higher Institutions. International Journal of
Education Science, 4(2), 163-173.
. Ullah, M.H., Ajmal, M. and Rahman, F.(2011). Analysis of Quality Indicators of
Higher Education in Pakistan.

