An Empirical Study on Relationship between Selected Financial Measures and Market
Value Added of Infrastructural Companies in India
|
Dr. Hanuman Prasad
Professor
Faculty of Management Studies
Mohanlal Sukhadia University, Udaipur, Rajasthan, India – 313001
|
Kapil Shrimal
Research Scholar
Faculty of Management Studies
Mohanlal Sukhadia University, Udaipur, Rajasthan, India – 313001
|
ABSTRACT
Market Value Added (MVA) is the best peripheral performance measure as it indicates
the market assessment of the effectiveness with which a company’s managers have
used the scarce resources under their control. The present study is focused to find
the relationship between financial measures and MVA. Thus, the objective of the
study is to know one of the internal measures, which can influence the MVA. To examine
MVA is taken as a dependent variable and the profitability ratio (GPM, NPM, ROCE,
ROE and RONW) and market value ratios (EPS, PER and DPR) variables are selected
as independent variables. Sample of 23 listed infrastructural companies of CNX Infrastructure
Index have been taken for the study. The period of the study is 5 years (F.Y. 2009-10
to F.Y. 2013-14). The study reveals that there is positive relationship between
MVA and financial performance measures of selected infrastructural companies during
the period. Result shows that there is significant relationship between ROCE, ROE
and EPS with MVA.
Key Words: MVA, Financial Performance, Infrastructure Companies
INTRODUCTION
One of the external indicators that give the utmost satisfaction to the investors
is share price and, truly speaking, the Market Value Added (Reddy, 2014).
From the shareholders point of view, the shareholder is always interested in increase
in the share prices. The most dependable measure of management’s long – run success
in adding value is known as “Market Value Added” (MVA). MVA is the best peripheral
performance measure as it indicates the market assessment of the effectiveness with
which a company’s managers have used the scarce resources under their control. Hence,
it is very significant and important to analyze and identify the internal indicators
that are related to with Market Value Added. In today’s unstable economic environment
and high volatility of stock price indices, the financial performance of the companies
have become foreseeable agent for creating organization values and thereby increasing
shareholder’s wealth. The present study focused to measure the relationship between
MVA and selected financial performance of infrastructural companies in India.
1. Market Value Added (MVA): Market Value Added is the difference between
the current market value of a firm and the capital contributed by investors. If
MVA is positive, the firm has added value. If it is negative, the firm has destroyed
value.
Market Value Added = Market value of the Equity + the book value of debt – all of
the capital investors have provided (including loans, retained earnings and paid
in capital)
This measures the performance of management. It also reflects the general market.
Management has a part in it but not entirely. In a bull stock market, the amount
contributed by management may even be negative, but the overall market may be driving
the MVA into positive territory.
2. Financial Performance Measures: A subjective measure of how well a firm
can use assets from its primary mode of business and generate revenues. This term
is also used as a general measure of a firm's overall financial health over a given
period of time, and can be used to compare similar firms across the same industry
or to compare industries or sectors in aggregation. Investors analyses and interpret
the financial statements so that they can get an insight in to the firm’s performance.
Ratio analysis is one of the tools for financial performance analysis of the company.
Investors are more interested in profitability ratios like net profit ratios, ROCE,
ROE etc. valuation ratios like P/E ratios, EPS and economic performance measures
like MVA.
2.1. Profitability Ratios: Profitability is the ability of a given investment
to earn a return from its use. Profit cannot be ignored since it is both a measure
of success of the business and means its survival and growth. The profitability
variables chosen for the present study are:
(a) Gross Profit Margin (GPM)
(b) Net Profit Margin (NPM)
(c) Return on Capital Employed (ROCE)
(d) Return on Equity (ROE)
(e) Return on Net Worth (RONW).
2.2. Market Value Ratios: Market value ratios evaluate the economic status
of your company in the wider marketplace. Market value ratios give management an
idea of what the firm's investors think of the firm's performance and future prospects.
Market value ratios are pertinent to the publicly traded firm. The market ratio
variables used for the study are:
(a) Earnings Per Share (EPS)
(b) Price Earnings Ratio (PER)
(c) Dividend Payout Ratio (DPR)
3. Indian Infrastructural Sector: Infrastructure drives development
in the economy. It is also a significant for the effective functioning of the economy.
Development in the infrastructure has a direct impact on the sustainability of overall
growth and development of the Indian economy. In recent years, India made significant
progress in physical infrastructure. Electricity, railways, roads, ports, airports,
irrigation, and urban and rural water supply and sanitation with the governments
focus on infrastructure development and increased investments in the sector. In
the present study CNX Infrastructure Index companies have been taken as sample.
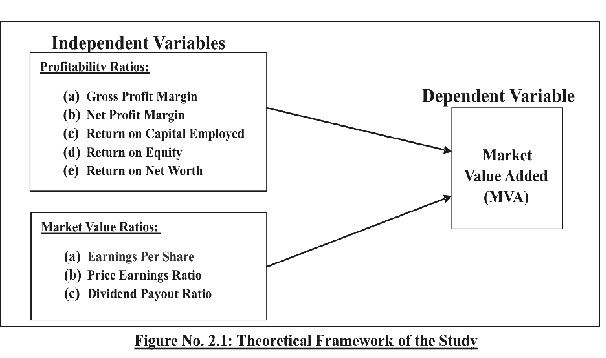
CONCEPTUAL FRAMEWORK
The present study is undertaken to examine the effect of selected variables on MVA.
Thus, the objective of the study is to know one of the internal measures, which
can influence the MVA. Here, MVA is taken as a dependent variable and the profitability
and market value ratios variables are selected as independent variables.
REVIEW OF LITERATURE
The relationship between MVA and financial performance has been studied in the recent
years in many studies world over, with many methods and with different results.
The results of the empirical studies are mixed.
Reddy (2014) studies financial performance using and its impact on Market
Value Added Approach in selected ten software companies in South India for one year
period 2010 - 2011. The study examined that variables like RONW, CAP, EPS, EVA,
ROS, ROTA and Cash Profit are found to have significant effect on MVA. Panayiotis
(2008) investigated the relationships between MVA and other performance
evaluation measures. The study indicates REVA and MVA have the most relationship
compared to other measures. Fergusonet al., (2005) studied the relationships
between EVA and other performance evaluation measures in improving stock performance
during the period of 1983 in the stern Stewart companies. The study shows EVA and
MVA have the most relationship compared to other measures. Bhatnagar and Shekhar
(2001) based on a sample of 56 companies listed on Bombay Stock Exchange
suggest EVA as the most significant related variable with MVA across the industries.
Behaviour of other variables vis-a-vis MVA varies across the industries. Swain et.
al. (2000) examined how the MVA is correlated with the firm‘s performance
in terms of financial measures of the company such as EVA, NOPAT, ROCE, EPS. They
used sample of 28 companies from pharmaceutical industry during the period spanning
1992-93 to 2000-01. Study of them concludes that EVA, NOPAT and sales outperform
other financial and economic measures in predicting MVA. Uyemura, Kantor and Pettit
(1996) present findings on the relationship between EVA and MVA with 100
bank holding companies. They calculate regressions to 5 performance measures including
EPS, Net Income, ROE, ROA and EVA. According to their study the correlations between
these performance measures and MVA are: EVA 40%, ROA 13%, ROE 10%, Net income 8%
and EPS 6%. The data is from the ten-year period 1986 through 1995.
RESEARCH METHODOLOGY
1. Objective of the Study: The major objectives of the study are:
Ø To study the relationship between MVA and profitability measures i.e. GPM, NPM,
ROCE, RONW and ROE.
Ø To study the relationship between MVA and market value ratio i.e. PE, DPR and
EPS.
Ø To find out which performance measure is reflected better in MVA.
2. Sample Size: The attempt has been made on the sample of 23 infrastructural
companies of CNX Infrastructure Index.
3. Duration of the Study: The period of the study is 5 years beginning from
the FY 2009-10 and ending with FY 2013-14. The rationale behind the selection of
a 5-year period for the study is to cover a complete business cycle.
4. Method of Data Collection: Secondary data were collected to conduct the
study. Data collection method convenient and as per availability of data. Data is
collected from the electronic online data base of Capitaline (www.capitaline.com).
5. Research Tools: The collected data have been analyzed with the help of
financial ratios. Further, data have been also analyzed in the light of relevant
statistical tools like mean, standard deviation, coefficient of variation, correlation,
multiple correlations, multiple regressions etc.
6. Hypothesis: To study the relationship between MBA and financial ratios,
following hypothesis have been developed and tested:
Ø H01 : There is no significant relationship between MVA and profitability
ratios.
Ø H02 : There is no significant relationship between MVA and market
value ratios.
RESULTS AND DISCUSSIONS
Based on the objective of the study, collected data were analyzed and important
findings of the study are following:
1. Relationship between MVA and Profitability Ratios:
Table No. 5.1.1. Regression Statistic
|
Multiple R
|
0.439655995
|
|
R Square
|
0.193297394
|
|
Adjusted R Square
|
0.156292687
|
|
Standard Error
|
28855.78917
|
|
Observations
|
115
|
Table No. 5.1.2. ANOVA Analysis
|
|
Df
|
SS
|
MS
|
F-Stat
|
Significance F
|
|
Regression
|
5
|
21747280193
|
4349456039
|
5.223589414
|
0.000244865*
|
|
Residual
|
109
|
90759566009
|
832656568.9
|
|
|
|
Total
|
114
|
1.12507E+11
|
|
|
|
Table No. 5.1.3. Regression Analysis
|
|
Coefficients
|
Standard Error
|
t Stat
|
P-value
|
|
Intercept
|
12653.6313
|
4626.131273
|
2.73525124
|
0.007277859
|
|
GPM
|
0.16146498
|
1.925765169
|
0.083844584
|
0.933333793**
|
|
NPM
|
-109.169085
|
74.57714635
|
-1.463841007
|
0.146115388**
|
|
ROCE
|
-1483.59507
|
566.8803123
|
-2.617122235
|
0.010126572*
|
|
ROE
|
1544.7197
|
633.7151793
|
2.437561465
|
0.016403882*
|
|
RONW
|
1436.946051
|
896.2180554
|
1.603344233
|
0.111752563**
|
*Significant at 5%, **Not Significant at 5%
From the above analysis in table no. 5.1.1 to 5.1.3 of regression analysis of MVA
and profitability ratios shows that the multiple correlation coefficients are 0.43966.
This indicates that the correlation among the independent and dependent variables
is positive. The coefficient of determination is 19.33%. This means that close to
19% of the variation in the dependent variable is explained by the independent variables.
Since the p-value of F-static is 0.00024 which is less than 0 .05 at 5% level of
significance, so we reject the null hypothesis and conclude that there is a significant
relationship between MVA and profitability measures of selected infrastructure industries.
The significance of independent variables are also been tested individually. Since
the p-value of GPM, NPM and RONW is greater than 0 .05 at 5% level of significance,
so we accept the null hypothesis and conclude that there is no significant relationship
between MVA and GP M, NPM & RONW of selected infrastructure industries. Whereas
the p-value of ROCE and ROE is less than 0.05 at 5% level of significance, so we
reject the null hypothesis and conclude that there is a significant relationship
between MVA and ROCE & ROE of selected infrastructure industries.
2. Relationship between MVA and Market Value Ratios:
Table No. 5.2.1. Regression Statistics
|
Multiple R
|
0.249539804
|
|
R Square
|
0.062270114
|
|
Adjusted R Square
|
0.036926063
|
|
Standard Error
|
30829.52722
|
|
Observations
|
115
|
Table No. 5.2.2. ANOVA Analysis
|
|
Df
|
SS
|
MS
|
F-Stat
|
Significance F
|
|
Regression
|
3
|
7005814139
|
2335271380
|
2.456991349
|
0.066719202**
|
|
Residual
|
111
|
1.05501E+11
|
950459748.3
|
|
|
|
Total
|
114
|
1.12507E+11
|
|
|
|
Table No. 5.2.3. Regression Analysis
|
|
Coefficients
|
Standard Error
|
t Stat
|
P-value
|
|
Intercept
|
21791.22923
|
5140.748354
|
4.238921598
|
4.66337E-05
|
|
PER
|
-6.199156221
|
19.23650987
|
-0.322259925
|
0.74786195**
|
|
EPS
|
329.5338826
|
127.3052423
|
2.588533485
|
0.010928186*
|
|
DPR
|
-42.37783975
|
159.0886011
|
-0.266378857
|
0.790441643**
|
*Significant at 5%, **Not Significant at 5%
From the above analysis in table no. 5.2.1 to 5.2.3 of regression analysis of MVA
and market value ratios shows that the multiple correlation coefficients are 0.
24954 . This indicates that the correlation among the independent and dependent
variables is positive. The coefficient of determination is 6.23%. This means that
close to 6% of the variation in the dependent variable is explained by the independent
variables. Since the p-value of F-static is 0.067 which is greater than 0 .05 at
5% level of significance, so we accept the null hypothesis and conclude that there
is no significant relationship between MVA and market value ratios of selected infrastructure
industries.
The significance of independent variables are also been tested individually. Since
the p-value of PER and DPR is greater than 0 .05 at 5% level of significance, so
we accept the null hypothesis and conclude that there is no significant relationship
between MVA and PER & DPR of selected infrastructure industries. Whereas the
p-value of EPS is less than 0.05 at 5% level of significance, so we reject the null
hypothesis and conclude that there is a significant relationship between MVA and
EPS of selected infrastructure industries.
CONCLUSION and SUGGESTIONS
The study explains importance of using profitability ratios and market value ratios
as tools for Market Value Added. The study reveals that there is positive relationship
between MVA and financial performance measures of selected infrastructural companies
during the period. There is significant relationship between ROCE, ROE and EPS with
MVA. Increasing value to stockholders is the prime goal of majority of companies,
which is clearly the mere goal of stockholders. MVA implies for current net value
of previous plans and future profitable chance. MVA assesses the effect of managerial
actions on shareholder wealth from an organization's inception.
This study shows that MVA can explain other financial performance measures. The
study justifies that MVA can be used instead of other financial performance measures.
Further more studies can be done for other companies/sectors with more financial
variables.
REFERENCES
Dayal B. and Chandra S. (2001). In search of a Potent measure of Financial Performance
among Industries. The Journal of Indian Management and Strategy. Vol. 6 (4), 2001,
49-63.
Fernandez, P. (2001). Economic Profit and Cash Value Added do not Measure Shareholder
Value Creation. SSRN. Working Paper, 17
Kramer, Jonathan .K. & Pushner George (1997). An Empirical Analysis of Economic
Value Added as a proxy measure for Market Value Added. Financial Practice and Education.
Vol. 7(1), 41-49.
Niranjan S, Mishra, C.S., Jayasimha, K.R., and Vijayalakshmi, S. (2002). Shareholder
wealth maximisation in Indian Pharmaceutical Industry: An Econometric analysis.
ICFAI Journal of Applied Finance. Vol. 8 (6), 69-82.
Panayiotis, G. (2008), Wealth Added Financial Management Research. University of
Piraeus. Management Research. University of Piraeus. Book, pp: 14
Reddy K.K (2014). Analysis of Fianacial Performance Using Market Value Added Approach.
PARIPEX – Indian Journal of Research, 141-146.
Uyemura, K. and Petit, J. (1996), EVA for Bank Value Creation, Risk Management and
Profitability measurement. Journal of Applied Corporate Finance, Vol. 9, 94-113.
http://www.nseindia.com/products/content/equities/indices/thematic_indices.htm

