ONLINE SHOPPING ADOPTION IN DELHI NCR – AN EMPIRICAL STUDY
|
Ms. Esha Jain
Assistant Professor
School of Management,
G. D. Goenka University
Gurgaon, Haryana
|
Dr. Manish Madan
Associate Professor
Rukmini Devi Institute of Advanced Studies
Rohini, Delhi
|
ABSTRACT
About 40 million consumers purchased products and services online this year and
with better infrastructure in terms of logistics, broadband and internet-ready devices,
the number is expected to grow to 65 million by the end of 2015. Improved accessibility
to the internet and world wide web have made it easier and cheaper for businesses
and consumers to interact and conduct commercial transactions electronically as
compared the traditional approach of visiting retail stores. Primary data
has been collected from respondents engaging in online purchases on 31 parameters
which were then reduced to a fewer number of factors through factor analysis. This
research offers insights into the linkage between e-shopping and customers’ decisions
to shop or not shop online. This information can help online marketers and retailers
develop appropriate market strategies, design and implement technological initiatives
and take the right decisions to retain current customers and attract new customers.
If online marketers and retailers can better understand their customers, they can
improve their product and service offerings and strengthen their competitive advantage.
An E-M Online Shopping Adoption Model is tested and validated by significantly relating
the factors affecting online shopping adoption.
Key Words: Online Shopping, Online Shopping Adoption, Online Shopping and
Media.
INTRODUCTION
Online shopping in India is an emerging trend enabling marketers to promote their
merchandise in a wider geographical area using the internet. This trend is likely
to grow over the coming decade.India is the fifth country globally and the second
in Asia in terms of e-commerce. Indians seem to have grasped the ability to shop
merchandise through internet. Mobile internet is also responsible for opening up
the online world to Indian consumers.
The average annual spending of Indians on online purchases is expected to rise 67
percent to Rs. 10,000 next year from the current Rs. 6,000 a year on average, said
the Assocham-PwC study. About 40 million consumers purchased something online this
year and the number is expected to grow to 65 million by the end of this year 2015
with better infrastructure in terms of logistics, broadband and Internet-ready devices.
The Internet and World Wide Web have made it easier, simpler, cheaper and more accessible
for businesses and consumers to interact and conduct commercial transactions electronically.
This is practically the case when online shopping (i.e. Internet shopping) is compared
to the traditional approach of visiting retail stores (McGaughey& Mason, 1998).
Alibaba and Tencent spent more than $8 billion last year alone backing often strikingly
similar ventures, as the Chinese Internet giants race to create online one-stop-shops
to win the digital loyalty of a tenth of the world's population. Monsuwe, Dellaert,
and Ruyter (2004) suggest five reasons that drive consumers to shop online. Firstly,
consumers can use minimal time and effort to browse an entire product assortment
by shopping online. Secondly, consumers can gain important information about companies,
products and brands efficiently by using the Internet to help them make purchase
decisions more accurately. Thirdly, when compared to traditional retail shopping,
online shopping enables consumers to compare product features, price, and availability
more efficiently and effectively. Fourthly, online shopping allows consumers to
maintain their privacy when they buy sensitive products. Finally, online shopping
can reduce consumers’ shopping time, especially for those consumers whose times
are perceived to be costly when they do brick-and-mortar shopping (Monsuwe et al.,
2004).
E COMMERCE INDUSTRY IN INDIA
Recent years have seen a remarkable transformation in the way India shops and trades.
E-commerce has taken the world of retail by storm and captivated the imagination
of an entire generation of entrepreneurs, with e-commerce ventures with various
business and commercial models. The explosive growth in the last few years has already
catapulted the biggest among these ventures past the billion-dollar territory. The
sector has grown three times in four years to nearly 12.6 billion USD in 2013. Various
industry estimates project that the sector will further growth five to seven times
over the next four to five years. Ecommerce industry, which started flourishing
in India nearly ten years back with eBay acquiring Avnish Bajaj owned Baazee.com,
an online auction portal, has come a long way indeed. It is, at present, one of
the fastest growing sectors of the Indian digital economy. The e-Commerce industry
in the India which grew by 33% last year and saw goods and services worth
$3.5 billion exchanging hands is poised for bigger growth and touch new highs. Gartner
predicts a 70%
growth rate for the sector and expects $6 billion worth of business in 2015.
REVIEW OF LITERATURE
Table 1: Contribution of researchers
|
YEAR
|
AUTHOR
|
FINDINGS
|
|
1989
|
Davis et al.
|
Next to identifying the steps of the buying process and the potential role of marketing
in each stage, marketers are eager to comprehend how purchasing choices and decisions
are made, how consumers are likely to react to innovation and how to predict the
outcome of the customer vendor interaction.
|
|
1999
|
Donthu and Garcia
|
Proposed that risk aversion, innovativeness, brand consciousness, price consciousness,
importance of convenience, variety-seeking propensity, impulsiveness, attitude toward
adverting, attitude toward shopping, and attitude toward direct marketing would
influence online shopping behavior.
|
|
2000
|
Bhatnagar, Misra and Rao
|
Measured how demographics, vender/service/ product characteristics, and website
quality influence the consumers, their attitude towards online shopping and consequently
their online buying behavior. They report that the convenience the Internet affords
and the risk perceived by the consumers are related to the two dependent variables
(attitudes and behavior) positively and negatively, respectively.
|
|
2000
|
Hoffman and Novak
|
Consumers who experience the flow state in a hypermedia CME exhibit exploratory
behaviors (e.g., shopping behavior) than those who do not.
|
|
2000
|
Rowley
|
Studied that the financial risks had been cited as a main reason to stop internet
shopping and security had become a major concern both in online transaction relationships.
|
|
2001
|
Heijden, Verhagen, and Creemers
|
Online purchase intention at the website is strongly determined by attitude towards
online shopping at the website. Also, trust-oriented models appear to be more appropriate
to explain online purchase intention than website-oriented models.
|
|
2001
|
Lee and Turban
|
The findings indicate that merchant integrity is a major positive determinant of
consumer trust in Internet shopping, and that its effect is moderated by the individual
consumer’s trust propensity.
|
|
2002
|
Sofres
|
Given the continuous expansion of the Internet in terms of user numbers, transaction
volumes and business penetration this massive research endeavor is not surprising.
More than 20 per cent of Internet users in several countries already buy products
and services online while more than 50 per cent of US net users regularly buying
online.
|
|
2002
|
Lee
|
Internet meltdown at the end of the 1990s and plenty of more recent anecdotal and
empirical evidence indicate that many online firms still do not completely understand
the needs and behavior of the online consumer while many of them “...continue to
struggle with how effectively to market and sell products online”.
|
|
2002
|
Lee & Johnson
|
Intention will predict actual behavior is somewhat suspect based on the large numbers
of dropouts or those who note they are only browsing while online.
|
|
2003
|
Park and Kim
|
Information affects information satisfaction and relational benefit that, in turn,
are significantly related to each consumer’s site commitment and actual purchase
behavior.
|
|
2005
|
Lim and Dubinsky
|
Attitude toward online shopping is reinforced to the extent to which consumers think
their relevant others support their online purchase behavior.
|
|
2005
|
Chiu, Lin and Tang
|
Consumer attitudes play a significant role in facilitating their purchase intentions.
Also, the influences of perceived ease of purchasing on both attitudes and online
purchase intentions are stronger for females than for males.
|
|
2006
|
Schlosser, White, and Lloyd
|
Effective investments signal the component of trusting beliefs that is most strongly
related to online purchase intentions.
|
|
2009
|
Suki and Suki
|
Conducted a study on ‘Cellular Phone Users’ Willingness to Shop Online’. The study
suggested that marketers should propose more on attractive promotion such as advertisements
or discounts through the web.
|
|
2011
|
Chowdhury and Ahmad
|
Conducted a study on ‘factors affecting consumer participation in online shopping
in Malaysia’. The major focus of the study was to describe the relationship between
independent variables and dependent variable using Pearson’s correlation method.
|
OBJECTIVES OF STUDY
The Objectives of Study are as follows:-
(1) To explore the factors influencing customers decisions to adopt online
shopping instead of non – online shopping.
(2) To examine the effect of demographic factors on the adoption of online
shopping.
HYPOTHESES OF STUDY
The following Hypotheses were formulated as follows:-
Here H0 represents Null Hypothesis and HA represents
Alternative Hypothesis.
Hypothesis 1:-
H01: There is no significant relationship between well designed
website contents and adoption of online shopping.
HA1: There is a significant relationship between well designed
website contents and adoption of online shopping.
Hypothesis 2:-
H02: There is no significant relationship between security and
adoption of online shopping.
HA2: There is a significant relationship between security and
adoption of online shopping.
Hypothesis 3:-
H03: There is no significant relationship between service quality
and adoption of online shopping.
HA3: There is a significant relationship between service quality
and adoption of online shopping.
Hypothesis 4:-
H04: There is no significant relationship between cost to customer
and adoption of online shopping.
HA4: There is a significant relationship between cost to customer
and adoption of online shopping.
Hypothesis 5:-
H05: There is no significant relationship between product variety
and adoption of online shopping.
HA5: There is a significant relationship between product variety
and adoption of online shopping.
Hypothesis 6:-
H06: There is no significant relationship between customer resources
and adoption of online shopping.
HA6: There is a significant relationship between customer resources
and adoption of online shopping.
Hypothesis 7:-
H07: There is no significant relationship between product guarantee
and adoption of online shopping.
HA7: There is a significant relationship between product guarantee
and adoption of online shopping.
Hypothesis 8:-
H08: There is no significant relationship between convenience
and adoption of online shopping.
HA8: There is a significant relationship between convenience and
adoption of online shopping.
Hypothesis 9:-
H09: There is no significant relationship between demographic
factors (Gender, Age, Marital Status, Education level, Occupation, and family income)
and adoption of online shopping.
HA9: There is a significant relationship between demographic factors
(Gender, Age, Marital Status, Education level, Occupation, and family income) and
adoption of online shopping.
PROPOSED THEORETICAL RESEARCH MODEL
Fig 1: Proposed E-M Online Shopping Adoption Model
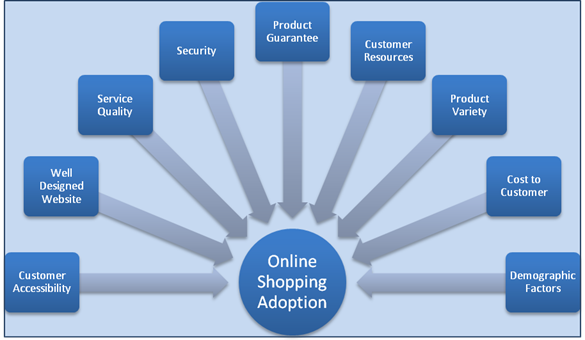
The model is designed on the names of the researchers who formulate it as ‘E’
stands for Esha Jain and ‘M’ stands for Manish Madan.
RESEARCH DESIGN
The research design is explorative in nature. In order to collate the responses,
7- point Likert’s scale from strongly agree to strongly disagree is employed. Exploratory
factor analysis was used to identify the factors that influence consumers’ decisions
to adopt online shopping, which in turn, satisfied the first research objective.
The responses obtained from the respondents are analyzed using the Regression analysis.
The test of significance is done with the help of t – test and ANOVA. This study
is restricted to respondents shopping in Malls in Delhi and NCR. The importance
of this study is that it focuses on investigating the impact of various factors
on the behavior of customers to adopt online shopping.
SOURCES OF DATA
To cater the need of the research, the researchers have used primary data through
self-constructed structured Questionnaire and as far as the secondary data is concerned
that was obtained from web sites, journals etc. to explore the significance of various
factors on the behavior of customers to adopt online shopping.
DATA COLLECTION TECHNIQUE
Primary data were collected from customers shopping in various malls of Delhi and
NCR. There were 197 respondents from various places in Delhi and NCR, out of which
150 filled questionnaires were used for this study (rest 47 rejected due to non-response).
Structured questionnaire was constructed to interview the respondents doing shopping
in various malls of Delhi and NCR. The responses of the respondents are measured
on Likert’s seven point scale (ranging from strongly agree to strongly disagree).
SAMPLING TECHNIQUE
As far as the sampling technique is concerned, non-probability convenience sampling
is used to collect data.
STATISTICAL TOOLS USED
IBM SPSS 20 (Statistical Package for the Social Sciences), for data analysis and
as far as hypothesis testing is concerned, the statistical tools used is regression
analysis; for the reduction of factors, the factor analysis is done using Rotated
component matrix; for the reliability, the Cronbach’s Alpha was calculated; and
sample adequacy was tested on KMO and Bartlett’s Test.
DATA ANALYSIS AND INTERPRETATION
Reliability Analysis
In order to check the reliability of the questionnaire, the Cronbach’s Alpha test
was applied (Refer Table 2). The value of Cronbach’s alpha is found to be 0.864.
As the value of Cronbach’s Alpha is more than 0.6, which considers the data to be
reliable for hypothesis testing.
Table 2: Reliability Statistics
|
Reliability Statistics
|
|
Cronbach’s Alpha
|
Cronbach’s Alpha Based on Standardized Items
|
No. of Items
|
|
0.864
|
0.853
|
31
|
Validity Analysis
From Table 3, it is found that the value for Kaiser-Meyer-Olkin Measure of Sampling
Adequacy was more than 0.6, and it is 0.852 also Bartlett's Test of Sphericity has
significant value less than 0.05 at 5 % level of significance. So factor analysis
was conducted successfully for data reduction.
Table 3: KMO and Barlett’s test of Sphericity
|
Kaiser-Meyer-Olkin Measure of Sampling Adequacy
|
|
0.852
|
|
Bartlett's Test of Sphericity
|
Approx. Chi-Square
|
6349.232
|
|
|
Df
|
630
|
|
|
Sig.
|
0.000
|
FACTOR ANALYSIS
The results of statistical assumption tests revealed that the data set was appropriate
for factor analysis. Thus, principal component factor analysis was conducted on
all of the items that were identified from the literature review. Rotated Component
Matrix is given in Table 4.
Table 4: Factor Analysis by using Rotated Component Matrix
|
|
1
|
2
|
3
|
4
|
5
|
6
|
7
|
8
|
|
My Contact Details and Information kept secret by Retailer
|
0.752
|
|
|
|
|
|
|
|
|
Online Purchases are of low risk.
|
0.782
|
|
|
|
|
|
|
|
|
My bank card detail and online payment detail are safe.
|
0.731
|
|
|
|
|
|
|
|
|
It gives sense of confidence in me that my details are kept secret by retailer.
|
0.724
|
|
|
|
|
|
|
|
|
In terms of security online shopping can be comparable with the traditional shopping.
|
0.629
|
|
|
|
|
|
|
|
|
Regular and continuous access to internet
|
|
0.841
|
|
|
|
|
|
|
|
Regular and continuous access to computer
|
|
0.863
|
|
|
|
|
|
|
|
Skill level in using Internet
|
|
0.725
|
|
|
|
|
|
|
|
Awareness about process of making online purchase
|
|
0.671
|
|
|
|
|
|
|
|
The design of website of retailer is attractive
|
|
|
0.862
|
|
|
|
|
|
|
Easy to access and complete transaction through retailer website
|
|
|
0.881
|
|
|
|
|
|
|
Flexible links are available on the website of retailer to move back and forth
|
|
|
0.552
|
|
|
|
|
|
|
Navigation of retailer’s website is easy
|
|
|
0.620
|
|
|
|
|
|
|
Website contain in-depth information to solve queries of customers
|
|
|
0.719
|
|
|
|
|
|
|
Online purchases help to reduce transportation cost
|
|
|
|
0.847
|
|
|
|
|
|
Online purchases help to buy similar products at cheaper prices
|
|
|
|
0.519
|
|
|
|
|
|
Online purchases is better value for money
|
|
|
|
0.723
|
|
|
|
|
|
Internet offers comparatively low prices than the traditional retailers
|
|
|
|
0.838
|
|
|
|
|
|
Online Retailers encourages for feedback and suggestions
|
|
|
|
|
0.521
|
|
|
|
|
Online Retailers understand the needs of the customers
|
|
|
|
|
0.838
|
|
|
|
|
After sales services are easily provided by online retailers
|
|
|
|
|
0.619
|
|
|
|
|
Internet retailers provide personalized customer service to the buyers
|
|
|
|
|
0.730
|
|
|
|
|
Less time and efforts in making online purchases
|
|
|
|
|
|
0.581
|
|
|
|
Online purchases saves time so that other activities can be done during that time
|
|
|
|
|
|
0.883
|
|
|
|
Online purchases are more convenient than the traditional purchases
|
|
|
|
|
|
0.739
|
|
|
|
The product received on delivery is similar in quantity and quality as per commitment
of online retailer
|
|
|
|
|
|
|
0.553
|
|
|
Product Guarantee is honored by online retailers
|
|
|
|
|
|
|
0.771
|
|
|
Delivery time is as per promised time
|
|
|
|
|
|
|
0.842
|
|
|
Wide Variety of products are available on the internet
|
|
|
|
|
|
|
|
0.927
|
|
I always purchase the types of products I want from the Internet.
|
|
|
|
|
|
|
|
0.620
|
|
I can buy the products that are not available in retail shops through the Internet
|
|
|
|
|
|
|
|
0.881
|
From the Table 4, the 31 variables are condensed to eight factors viz.
Factor 1: This factor explains the first component and is designated as
“Security” (S).
Factor 2: This factor explains the second component and is designated as
“Customer accessibility” (CA).
Factor 3: This factor explains the third component and is designated as
“Website Contents” (WC).
Factor 4: This factor explains the fourth component and is designated as
“Cost to Customer”(CC).
Factor 5: This factor explains the Fifth component and is designated as
“Quality of Service” (QS).
Factor 6: This factor explains the Sixth component and is designated as
“Customer Resources” (CR).
Factor 7: This factor explains the Seventh component and is designated as
“Guarantee and Warranty” (GW).
Factor 8: This factor explains the Eighth component and is designated as
“Product Variety”.(PV)
KARL PEARSON COEFFICIENT OF CORRELATION
|
|
|
S
|
CA
|
WC
|
CC
|
QS
|
CR
|
GW
|
PV
|
|
Pearson Correlation Coefficient
|
S
|
1
|
-0.583
|
0.831
|
-0.628
|
0.481
|
0.028
|
0.726
|
-0.318
|
|
N
|
150
|
150
|
150
|
150
|
150
|
150
|
150
|
150
|
|
Sig. (2 – tailed)
|
---
|
0.293
|
0.021*
|
0.419
|
0.217
|
0.618
|
0.031*
|
0.529
|
|
Pearson Correlation Coefficient
|
CA
|
-0.583
|
1
|
0.529
|
0.419
|
0.281
|
0.619
|
0.518
|
0.416
|
|
N
|
150
|
150
|
150
|
150
|
150
|
150
|
150
|
150
|
|
Sig. (2 – tailed)
|
0.293
|
---
|
0.000*
|
0.033*
|
0.000*
|
0.000*
|
0.027*
|
0.032*
|
|
Pearson Correlation Coefficient
|
WC
|
-0.583
|
0.529
|
1
|
0.539
|
0.618
|
0.738
|
0.428
|
0.315
|
|
N
|
150
|
150
|
150
|
150
|
150
|
150
|
150
|
150
|
|
Sig. (2 – tailed)
|
0.293
|
0.000*
|
---
|
0.027*
|
0.000*
|
0.000*
|
0.0317*
|
0.0381*
|
|
|
|
|
|
|
|
|
|
|
|
|
Pearson Correlation Coefficient
|
CC
|
-0.628
|
0.419
|
0.539
|
1
|
0.428
|
0.517
|
0.481
|
0.729
|
|
N
|
150
|
150
|
150
|
150
|
150
|
150
|
150
|
150
|
|
Sig. (2 – tailed)
|
0.419
|
0.033*
|
0.027*
|
---
|
0.041*
|
0.032*
|
0.000*
|
0.000*
|
|
Pearson Correlation Coefficient
|
QS
|
0.481
|
0.281
|
0.618
|
0.428
|
1
|
0.824
|
0.726
|
0.530
|
|
N
|
150
|
150
|
150
|
150
|
150
|
150
|
150
|
150
|
|
Sig. (2 – tailed)
|
0.217
|
0.000*
|
0.000*
|
0.041*
|
---
|
0.000*
|
0.031*
|
0.000*
|
|
Pearson Correlation Coefficient
|
CR
|
0.028
|
0.619
|
0.738
|
0.517
|
0.824
|
1
|
0.523
|
0.284
|
|
N
|
150
|
150
|
150
|
150
|
150
|
150
|
150
|
150
|
|
Sig. (2 – tailed)
|
0.618
|
0.000*
|
0.000*
|
0.032*
|
0.000*
|
---
|
0.027*
|
0.000*
|
|
Pearson Correlation Coefficient
|
GW
|
0.726
|
0.518
|
0.428
|
0.481
|
0.726
|
0.523
|
1
|
0.848
|
|
N
|
150
|
150
|
150
|
150
|
150
|
150
|
150
|
150
|
|
Sig. (2 – tailed)
|
0.031*
|
0.027*
|
0.0317*
|
0.000*
|
0.031*
|
0.027*
|
---
|
0.000*
|
|
Pearson Correlation Coefficient
|
PV
|
-0.318
|
0.416
|
0.315
|
0.729
|
0.530
|
0.284
|
0.848
|
1
|
|
N
|
150
|
150
|
150
|
150
|
150
|
150
|
150
|
150
|
|
Sig. (2 – tailed)
|
0.529
|
0.032*
|
0.0381*
|
0.000*
|
0.000*
|
0.000*
|
0.000*
|
---
|
Table 5: Karl Pearson Coefficient of correlation
HYPOTHESES TESTING (Hypothesis No. 1 to No. 8)
In order to test the hypotheses 1 to 8, logistic regression analysis was used. Since
the value of Chi square is 428.99621 and p value is 0.0001 having degree of freedom
19 so the model fitted the data very well. Since the value of pseudo R square is
0.8635 which means the model explains 86.35% variance in the choice of online shopping.
The logistic regression results are given in Table 6. On the basis of the Table
5 of logistic regression analysis, the summary of hypothesis testing is given below:
Table 6: Logistic Regression Analysis
|
Factors
|
B
|
S. E.
|
Sig.
|
|
Security
|
-3.4392
|
0.3824
|
0.000*
|
|
Customer Accessibility
|
0.72982
|
0.2403
|
0.014*
|
|
Website Contents
|
0.68917
|
0.2947
|
0.028*
|
|
Cost to Customer
|
5.62912
|
2.5032
|
3.295
|
|
Quality of Service
|
-1.3902
|
0.2893
|
0.000*
|
|
Customer Resources
|
1.6723
|
0.2408
|
0.000*
|
|
Guarantee and Warranty
|
4.7470
|
3.8838
|
2.390
|
|
Product Variety
|
0.3093
|
0.2401
|
0.023*
|
SUMMARY OF HYPOTHESIS TESTING
Table 7: Summary of Hypotheses testing
|
HYPOTHESES
|
NULL HYPOTHESIS
|
ALTERNATIVE HYPOTHESIS
|
|
Hypothesis 1
|
REJECTED
|
ACCEPTED
|
|
Hypothesis 2
|
REJECTED
|
ACCEPTED
|
|
Hypothesis 3
|
REJECTED
|
ACCEPTED
|
|
Hypothesis 4
|
ACCEPTED
|
REJECTED
|
|
Hypothesis 5
|
REJECTED
|
ACCEPTED
|
|
Hypothesis 6
|
REJECTED
|
ACCEPTED
|
|
Hypothesis 7
|
ACCEPTED
|
REJECTED
|
|
Hypothesis 8
|
REJECTED
|
ACCEPTED
|
HYPOTHESIS TESTING (Hypothesis – 9) – Demographic Factors
Table 8: T – test: Online Shopping Adoption and Gender (Sample Size – 150)
|
Factors
|
Mean
|
T
|
Sig.
|
|
Security
|
5.845
|
0.204
|
0.863
|
|
Customer Accessibility
|
5.923
|
0.339
|
0.359
|
|
Website Contents
|
4.991
|
-1.673
|
0.259
|
|
Cost to Customer
|
5.728
|
0.672
|
0.337
|
|
Quality of Service
|
5.589
|
0.002
|
0.481
|
|
Customer Resources
|
4.446
|
0.836
|
0.338
|
|
Guarantee and Warranty
|
5.518
|
0.921
|
0.401
|
|
Product Variety
|
5.047
|
0.834
|
0.550
|
ANOVA – F test: Online Shopping Adoption and Age (Sample Size – 150)
Table 9: F - Test
|
Factors
|
Mean
|
F
|
Sig.
|
|
Security
|
4.548
|
14.724
|
0.000*
|
|
Customer Accessibility
|
5.552
|
3.782
|
0.023*
|
|
Website Contents
|
5.578
|
4.226
|
0.047*
|
|
Cost to Customer
|
4.441
|
3.901
|
0.000*
|
|
Quality of Service
|
5.559
|
2.440
|
0.012*
|
|
Customer Resources
|
5.824
|
3.891
|
0.000*
|
|
Guarantee and Warranty
|
5.551
|
4.229
|
0.028*
|
|
Product Variety
|
4.672
|
5.168
|
0.000*
|
ANOVA – F test: Online Shopping Adoption and Marital Status
(Sample Size – 150)
Table 10: F - Test
|
Factors
|
Mean
|
F
|
Sig.
|
|
Security
|
5.438
|
4.243
|
0.000*
|
|
Customer Accessibility
|
4.523
|
5.722
|
0.392
|
|
Website Contents
|
5.598
|
5.262
|
0.038*
|
|
Cost to Customer
|
5.417
|
4.015
|
0.000*
|
|
Quality of Service
|
4.559
|
3.407
|
0.931
|
|
Customer Resources
|
4.824
|
4.816
|
0.450
|
|
Guarantee and Warranty
|
4.551
|
5.296
|
0.031*
|
|
Product Variety
|
5.623
|
4.188
|
0.000*
|
ANOVA – F test: Online Shopping Adoption and Education Level
(Sample Size – 150)
Table 11: F - Test
|
Factors
|
Mean
|
F
|
Sig.
|
|
Security
|
5.835
|
15.243
|
0.000*
|
|
Customer Accessibility
|
5.623
|
15.722
|
0.000*
|
|
Website Contents
|
4.980
|
4.623
|
0.033*
|
|
Cost to Customer
|
5.173
|
5.150
|
0.000*
|
|
Quality of Service
|
5.554
|
4.076
|
0.037*
|
|
Customer Resources
|
5.240
|
5.169
|
0.025*
|
|
Guarantee and Warranty
|
4.341
|
4.299
|
0.000*
|
|
Product Variety
|
5.236
|
5.883
|
0.000*
|
On the basis of the Table 8, 9, 10 and 11 of ANOVA, the summary of hypothesis 9 testing
is given below: (Here A is Accepted and R is Rejected)
Table 12: Summary of hypothesis 9 Testing
|
Factors
|
GENDER
|
AGE
|
MARITAL STATUS
|
EDUCATION LEVEL
|
|
|
NULL
|
ALT.
|
NULL
|
ALT.
|
NULL
|
ALT.
|
NULL
|
ALT.
|
|
S
|
A
|
R
|
R
|
A
|
R
|
A
|
R
|
A
|
|
CA
|
A
|
R
|
R
|
A
|
A
|
R
|
R
|
A
|
|
WC
|
A
|
R
|
R
|
A
|
R
|
A
|
R
|
A
|
|
CC
|
A
|
R
|
R
|
A
|
R
|
A
|
R
|
A
|
|
SQ
|
A
|
R
|
R
|
A
|
A
|
R
|
R
|
A
|
|
CR
|
A
|
R
|
R
|
A
|
A
|
R
|
R
|
A
|
|
GW
|
A
|
R
|
R
|
A
|
R
|
A
|
R
|
A
|
|
PV
|
A
|
R
|
R
|
A
|
A
|
R
|
R
|
A
|
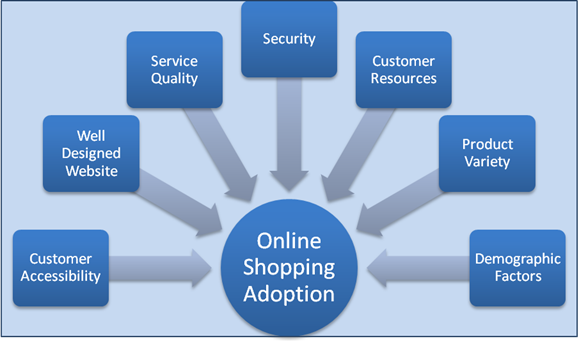
VALIDATED THEORETICAL RESEARCH MODEL – E-M Online Shopping Adoption Model
Fig 2: Validated E-M Online ShoppingAdoption Model
CONCLUSION
This research offers insights into the linkage between e-shopping and customers’
decisions to shop or not shop online. This information can help online marketers
and retailers develop appropriate market strategies, design and implement technological
initiatives and take the right decisions to retain current customers and attract
new customers. If online marketers and retailers can better understand their customers,
they can improve their product and service offerings and strengthen their competitive
advantage.
There is a positive correlation between factors considered for study and the adoption
of online shopping. There is significant relationship between security, content
of website and Guarantee of product. Customer Accessibility is significantly related
to Website Content, Cost to Customer, Quality of Service, Customer Resources, Guarantee
and Warrantee and Product Variety. Website content is related to all other factors.
It is clear from correlation matrix that most of the factors are significantly related
to other factors. There is significant relationship between Security, Customer Accessibility,
Website Content, Quality of Service, Accessibility and Product Variety and Adoption
of Online Shopping. While there is no significant relationship between Cost to Customer,
Guarantee and Warrantee and the Adoption of Online Shopping. As far as the Gender
is concerned there is no significant relationship between the Gender and adoption
of online shopping while there is significant relationship between other demographic
factors like Age, Marital Status and Education level and adoption of online shopping.An
E-M Online Shopping Adoption Model is tested and validated by significantly relating
the factors affecting online shopping adoption.
RESEARCH LIMITATIONS
The study focuses on general problems faced by online marketers compared to traditional
marketers. There might be certain more variables as one person is satisfied on particular
aspect but another may not on the same aspect.
REFERENCES
Bhatnagar, A., Misra, S., and Rao, H. R. (2000). Online Risk, Convenience, and Internet
Shopping Behavior. Communications of the ACM (43:11), 98-105.
Chiu, Y., Lin, C., and Tang, L. (2005).Gender Differs: Assessing a Model of Online
Purchase Intentions in e-tail Service.International Journal of service Industry Management,
16 (5), 416-435.
Davis, F.D., Bagozzi, R., and Warshaw, P.R. (1989). User Acceptance of Computer
Technology: AComparison of two theoretical models.Management Science, 35(9),
982-1003.
Donthu, N., and Garcia, A. (1999). The Internet Shopper.Journal of Advertising Research,
39(3), 52-58.
Heijden, H., Verhagen, T., and Creeners, V. (2001). Predicting Online Purchase Behavior:
Replication and Tests of Competing Models.Proceedings of the 34th Hawaii International
Conference on System Science.
Hoffman, D. L., Novak, T. P., and Yiu-Fat, Y. (2000). Consumer Decision Making in
Online Shopping Environments: A Structural Modeling Approach.Marketing Science,
19 (1), 22-41.
Lee, P-M. (2002). Behavioral Model of Online Purchasers in E-commerce Environment.Electronic
Commerce Research, 2, 75-85.
Lee, M., and Johnson, K. K. P. (2002). Exploring Differences Between Internet Apparel
Purchasers, Browsers and Non-purchasers. Journal of Fashion Marketing and Management,
6(2), 146-157.
Lim, H., and Dubinsky, A.J. (2005). The Theory of Planned Behavior in E-Commerce:
Making a Case for Interdependencies BetweenSalient Beliefs.Psychology & Marketing,
22, 833-855.
Park, C.H., and Kim, Y.G. (2003). Identifying Key Factors Affecting Consumer Purchase
Behavior in an Online Shopping Context.International Journal of Retail & Distribution
Management, 31 (1), 16-29.
Rowley, J. (2000). Product Searching With Shopping Bots.Internet Research: Electronic
Networking Applications and Policy, 10(3), 203-214.
Schlosser, A.E., White, T.B., and Lloyd, S.M. (2006). Converting Web Site Visitors
into Buyers: How Web Site Investment Increases Consumer Trusting Beliefs and Online
Purchase Intentions.Journal of Marketing, 70 (April), 133-148.
Suki, N., andSuki, N. (2009).Cellular Phone Users’ Willingness to Shop Online.World
Academy of Science, Engineering and Technology International Journal of Social,
Human Science and Engineering, 3(6), 70-74.
Sofres, T. N. (2002).The TNS Interactive – Globale - Commerce Report, available
at; www.tnso
fres.com/ ger2002/home.cfm.

