Exploring Marketing Activities of Apple Growers: Empirical Evidence from Kashmir
|
Shakir Hussain Parrey
Scholar
The Business School
University of Kashmir
Hazratbal Srinagar, India-190006
Contact No.- +919797145856
Email: smilingshakir@gmail.com
|
Dr. Iqbal Ahmad Hakim
Professor
The Business School
University of Kashmir
Hazratbal Srinagar, India-190006
Contact No.- +919419457888
Email: prof.iqbal.hakim@gmail.com
|
ABSTRACT
Despite a wide range of reform initiatives in agricultural extension in India from
last decades, the coverage, access, and quality of information provided to marginalized
and poor farmers is uneven. This paper aims to ascertain why farmers are not accessing
information in general or about schemes and where information gaps exist, for effective
and efficient marketing (selling and channel selection). Using information provision
and awareness as the basis for analysis, the paper reviews some of the major agricultural
extension programs in Kashmir by considering their ability to provide information
and facilitate information sharing for availing schemes. Further the study evaluates
the awareness of central and state schemes and frequency of participation by growers.
The study uses both primary and secondary data for frequency and percentage analysis.
Hence from results of this analysis, opportunities are identified for increasing
extension services’ awareness in reaching smallholder farmers for the utilization
of various schemes. The findings highlighted the role of various unsorted marketing
activities that should be taken in to consideration and explores the use, access
and awareness of various schemes and programmes. Findings also showed that deficit
awareness leads to decrease in utilization. The study came up with suggestions about
the awareness through selection of proper source of media according to the use of
targeted population.
Keywords: Awareness, Selling Conditions, Information Source,
Marketing Channels
INTRODUCTION
Agriculture is the primary occupation of the larger part of Indian population. 65-70
% of Indian population is dependent on agriculture for their living in rural areas.
As rural Indian population is in majority here and accounts for about 12 % of world
population (Misra. S, 2012). Among agriculture horticulture is a prime sector. In
Horticulture sector the largest area of 43.53% is occupied by apple out of total
area under fruit and 65.46% out of fresh fruit area. Indian apple production averaged
nearly1.4 million making it the sixth largest apple producer in the world (Satish.
Y. et.al, 2006). Apple alone is the fourth widely produced fruit in the after
Banana, Orange and grapes. India Annually exports apple worth of Rs 400 million
(Nearly US $ 10 million) out of which Rs 200 million of apples comes from Jammu
and Kashmir North region (Kashmir) and Provides job opportunity to 1.2 million people
directly, indirectly. Its area is estimated to be the second largest in the world
and in Asia it is the second largest producer (Deepa. D, 2008).There by making it
the largest contributor to the State GDP. Further among the Horticulture produce
Jammu and Kashmir and Himachal Pradesh have roughly equal area planted to apple,
but J&K has the highest average field and accounts 67% of total apple
production and 50% of its export in the country hence a substantial foreign exchange
earner and important for economic growth. Productivity is much higher than national
average of 6.86 tons/ha. It is also compared well with the world average of 10.82
tons /ha, or China 9.93 tons/ha, which is world’s highest producer of Apple (Masoodi
M.A, 2003).
With the advancement of technology many new farm practices, policies and schemes
have been introduced and these have immense possibilities for increase in agricultural
production. But the effectiveness and efficiency of these schemes and policies depends
on proper need identification by policy makers and adoption by target population.
Also value and efficiency of agricultural production is directly proportional to
efficiency in marketing the produce. However, despite the renewed interest and investment
in agricultural extension in India, the coverage of such services is inadequate.
Government extension programs, extension services of the national agricultural research
system, cooperatives, and nongovernmental extension programs have a very limited
outreach (NSSO 2010). The 2003 National Sample Survey Organisation (NSSO) survey
showed that 60 percent of farmers had not accessed any source of information on
modern technology to assist in their farming practices in the past year and those
who had sourced information, 16 percent received it from other progressive farmers,
followed by input dealers. Those farmers who had accessed information, the major
problem of extension services was found to be the practical relevance of the advice
(NSSO 2005). The coverage and relevance of information provided to farmers through
the agricultural extension system is therefore questionable. While this may be partly
due to inadequate contact by the services, which need to reach a large and complex
farming community, inappropriate or poor-quality information could also be a key
hindrance to farmers’ use of extension services. In other words, the content of
the information provided by agricultural extension approaches, and the information
farmers actually need, may not be aligned. There is therefore a need to reexamine
the current agricultural extension approaches to understand where information gaps
exist and determine why farmers are not accessing information through the large,
well-established public-sector extension system in addition to emerging private
and third-sector actors. As there is an increasing need to work in partnership and
to share knowledge and skills in order to provide locally relevant services that
meet the information needs of marginal and smallholder farmers.
Information and knowledge are key components of an improved agricultural sector
(Lwoga et al., 2011). Farmers require proper information in order to plan for their
activities, make choice of the inputs and eventually on when and where to sell their
products. Thus, there is a direct relationship between availability of information
and agricultural development (Babu et al., 2011).
Shepherd (2011) noted that farmers’ information needs have increased now than
ever before due to less government intervention in the sector. This is because availability
of information enhances livelihoods and reduces poverty when applied to improve
agriculture and trade among others. At the global level, strong emphasis is being
placed on the role of information in achieving the millennium development goals
(MDGs). The importance is underscored in the eighth MDG. It is well agreed that
information can support all other MDGs (World Development Report, 2008). Farmers’
lack of information is a paradox that continues to debilitate the efforts
to improve agriculture in most of African countries. Lwoga et al. (2011) reveal
that despite the large body of knowledge that exists in research institutions, universities,
public offices and libraries, it is only a small amount of agricultural information
which is eventually accessible by rural farmers. This creates a concern as to whether
the mechanisms used to disseminate the same are effective and/or the disseminated
information tallies with the actual needs of the farmers.
MARKETING CHANNELS AND EXTENSION PROGRAMES
Almost all apples produced in India are used for fresh consumption with limited
use of processing, about 70% of the Crop is transported to and sold in India’s largest
whole sale fruit and vegetable market at Azadpur in Delhi followed by Mumbai, Bangalore,
Abmadabed and others. There are number of Marketing channels patronized by the apple
growers of which the predominate are as8
Channel (1): Producer- commission agent- Wholesaler - Retailer - Consumer.
Channel (2): Producer- Forwarding agent- Commission agent- Wholesaler- Retailer
- Consumer.
Channel (3): Producer- Pre harvest Contractor- Commission Agent - Wholesaler -
Retailer- Consumer.
Channel (4): Producer- Pre harvest contractor- Forwarding Agent - Wholesaler -
Retailer- Consumer
The highest percentage (51.37%) of total produce is transported through Channel-
(1) followed by Channel (2) (23.25%) while channel 3 & 4 account for 19.75%
and 5.63% of the total produce transacted by these growers respectively. Sale through
pre- harvest Contractor is most important system of marketing. Normally the small
orchardists sell their crop at flowering stage to contractor who organizes plant
protection, Plucking and packing of fruit. The medium and large orchardist prefers
to market their produce through 2nd and 3rd channel respectively. The decision of
diversification by a farmer is considered to be one of the major economic decisions
that have strong bearing on his welfare in terms of income level and variability
in returns. It has been accepted fact that the peculiar geographical conditions
and inadequacy of infrastructure particularly in Kashmir region has restricted the
development of agriculture product. Still there are creation problems which hinder
its growth for which state and central Governmenent has initiated various schemes
and programs across all dimensions that include marketing, financing
and production. These schemes and programs include National Agricultural
Cooperative Marketing Federation of India (NAFEED), Jammu and Kahmir Horticulture
Planning and Marketing Corporation Limited (JKHPCL), Agricultural Marketing NET
(AGMARKNET), Apple Advance and Market Intervention Scheme (MIS).
OBJECTIVES
Looking to above facts the present study is undertaken in view of the following
objectives.
1. To examine the marketing channel selection and selling
conditions prevailing in the apple trade and provide possible solution to the problems
faced.
2. To gauge the awareness and participation level of
growers towards central and state Governmenent schemes and programmes and their
frequency of participation.
RESEARCH METHODOLOGY
The Jammu & Kashmir is purposively selected for study purpose as it has 35.92
per cent and 58.85 per cent of country's total area and production respectively.
About 30 per cent area and 60 per cent production of the state is in Barramulla
district. Hence, Barramulla district is selected for the study. From Barramulla
district, two tehsils, one having highest production i.e., Sopore and other having
relatively less production i.e., Bandipore are taken into consideration. Eight villages
(4 from each tehsil) are chosen for the study purpose. Accordingly, 300 apple growers
are selected for the present study through stratified random sampling. Respective
farmers were selected on the basis of their co-operation and willingness
to respond. In all, the requisite information was collected from them personally
with the help of a non-disguised, pre-tested questionnaire. Further percentage and
frequency analysis has been used to analyse the data collected through questionnaire.
The analysis has been carried out through the use of statistical software’s like
SPSS and Microsoft Excel to draw meaningful inferences.
ANALYSIS
DISTRIBUTION OF GROWERS ACCORDING TO TIME AND CONDITIONS OF SELLING
Table I
|
SELLING TIME & CONDITIONS
|
DISTRIBUTION EXTENT OF PARTICIPATION
|
|
Freq.
|
%age
|
Frequently
|
Often
|
Normally
|
Rarely
|
Never
|
|
Freq.
|
%age
|
Freq.
|
%age
|
Freq.
|
%age
|
Freq.
|
%age
|
Freq.
|
%age
|
|
IMMEDIATELY
|
112
|
74.66
|
45
|
30.0
|
41
|
27.3
|
33
|
22.0
|
21
|
14.0
|
10
|
6.7
|
|
AFTER STORING
|
65
|
43.33
|
10
|
6.7
|
13
|
8.7
|
37
|
24.7
|
26
|
17.3
|
64
|
42.7
|
|
FAVOURABLE PRICES
|
48
|
32.00
|
36
|
24.0
|
59
|
39.3
|
37
|
24.7
|
13
|
8.7
|
5
|
3.3
|
|
INDEBTEDNESS
|
89
|
59.33
|
38
|
25.3
|
36
|
24.0
|
28
|
18.7
|
29
|
19.3
|
19
|
12.7
|
Comparative Selling Time In Three Apple Producing States In India
|
STATE MONTH
|
Jan.
|
Feb.
|
Mar.
|
Apr.
|
May
|
Jun.
|
Jul.
|
Aug.
|
Sept.
|
Oct.
|
Nov.
|
Dec.
|
|
Jammu & Kashmir
|
|
|
|
|
|
|
|
|
|
|
|
|
|
Himachal Pradesh
|
|
|
|
|
|
|
|
|
|
|
|
|
|
Uttaranchal
|
|
|
|
|
|
|
|
|
|
|
|
|
|
Source: National Horticulture Board, Ministry of Agriculture,
Government of India
Early harvest

Peak harvest
late harvest

Early harvest Peak harvest late harvesthen prices are favorable is
decreasing form frequently to never, which infers that maximum times growers sell
their produce when prices are favorable which is a good indication. The frequency
of selling produce due to indebtedness is decreasing from frequently to never which
infers that growers are forced to sell produce due to indebtedness.
The table-I shows mixed selling distribution participation across the mentioned
reasons as 76.44% of growers are selling produce “immediately” after harvest. 43%
of growers are selling produce “after storing”, 32% of growers are selling produce
when “prices are favorable” and 59% of growers are selling produce due to “indebtedness”
to traders. Though a comparative study the extent of participation for “selling
immediately” is more frequent fallowed by “indebtedness”, “after storing” and “favorable
prices” respectively. The extent of participation according to frequency for selling
immediately is decreasing from frequently to never, which infers that maximum time’s
growers are selling their produce immediately after harvest. The frequency of “selling
produce after storing” is increasing from frequently to never which infers that
minimum times growers sell their produce “after storing”. The frequency of selling
produce when prices are favorable is decreasing form frequently to never, which
infers that maximum times growers sell their produce when prices are favorable which
is a good indication. The frequency of selling produce due to indebtedness is decreasing
from frequently to never which infers that growers are forced to sell produce due
to indebtedness.
Fig-1 infers that growers are selling produce immediately after harvest because
of indebtedness to traders and lack of storing facilities during peak season of
harvest which are the months of September and October. When comparing this peak
season with Himachal Pradesh and Uttrakhand it is in the month of June, July, August
and September respectively this infers that growers sell their produce when there
is peak supply from other states which results in lower price of produce. Growers
and policy makers should concentrate on the identification of proper time and conditions
for selling the produce. As a shift in time of selling (by storing or by introducing
improved verities) from October, November to November, December results in the higher
prices of produce as price of imported apples is nearly 3500 per box after the month
of january-feberuary.
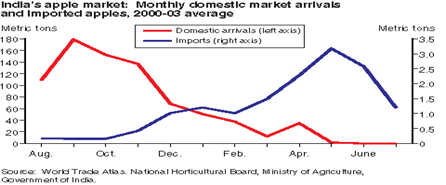
Figure-1showing monthly domestic market arrivals
DISTRIBUTION OF GROWERS ACCORDING TO REASONS OF SELLING
Table II
|
REASONS FOR SELLING
|
DISTRIBUTION EXTENT OF PARTICIPATION
|
|
Freq.
|
%age
|
Frequently
|
Oftenly
|
Normally
|
Rarely
|
Never
|
|
Freq.
|
%age
|
Freq.
|
%age
|
Freq.
|
%age
|
Freq.
|
%age
|
Freq.
|
%age
|
|
NEARNESS TO MARKET
|
124
|
82.66
|
40
|
26.7
|
53
|
35.3
|
37
|
24.7
|
11
|
7.3
|
9
|
6.0
|
|
PREVIOUS AGREEMENT
|
86
|
57.33
|
36
|
24.0
|
56
|
37.3
|
14
|
9.3
|
39
|
26.0
|
5
|
3.3
|
|
BETTER PRICES
|
88
|
58.66
|
54
|
36.0
|
11
|
7.3
|
43
|
28.7
|
30
|
20.0
|
12
|
8.0
|
|
FREQUENT INTERACTION
|
47
|
31.33
|
7
|
4.7
|
39
|
26.0
|
57
|
38.0
|
44
|
29.3
|
3
|
2.0
|
|
IMMEDIATE CASH PAYMENT
|
48
|
32.00
|
42
|
28.0
|
48
|
32.0
|
43
|
28.7
|
14
|
9.3
|
3
|
2.0
|
DISTRIBUTION OF GROWERS ACCORDING TO SOURCES OF INFORMATION
The table III highlights that growers are using mixed and multiple source of information
as 26.5% of growers are using television as a source of information through (28)
as agri-programmes, (36) as news, (24) as entertainment frequently. 78.75% of growers
are using radio as a source of information through agri-programmes (32), news (45),
Entertainment (38) frequently. 36.25% of growers are using newspapers as a source
of information through farm information(19), general news(22), frequently 26.5%
of growers are using farm magazine as source of information through scientific articles(14),
& through success stories (8) frequently only .02% of growers using internet
as a source of information through cell phones with frequency from normally or rarely.
Through a comparative study the extent of participation for television shows that
television news is used most frequently followed by Agri programmes while used radio
as a source of information growers are using radio news more frequently followed
Agri-programmes. While using newspapers as a source of information growers are using
general news more frequently followed by farm information. While using form magazines
as a source of information growers are using scientific articles more frequently
followed by successes stores and while using internal as a source of information
growers are using cell phones and that also rarely.
Table III
|
MASS MEDIA SOURCE
|
DISTRIBUTION EXTENT OF PARTICIPATION
|
|
Freq.
|
%age
|
Programmes
|
Frequently
|
Oftenly
|
Normally
|
Rarely
|
Never
|
|
Freq.
|
Freq.
|
Freq.
|
Freq.
|
Freq.
|
|
TELEVISION
|
42
|
26.5
|
Agri. Programmes
|
28
|
52
|
33
|
25
|
80
|
|
Advertisement
|
36
|
48
|
21
|
44
|
76
|
|
News
|
24
|
56
|
11
|
62
|
80
|
|
Entertainment
|
13
|
62
|
26
|
53
|
85
|
|
RADIO
|
126
|
78.75
|
Agri. Programmes
|
32
|
37
|
32
|
43
|
91
|
|
Advertisement
|
45
|
61
|
19
|
26
|
54
|
|
News
|
38
|
53
|
48
|
19
|
69
|
|
Entertainment
|
11
|
54
|
13
|
49
|
95
|
|
NEWSPAPER
|
58
|
38.66
|
Agri. News
|
19
|
26
|
72
|
56
|
115
|
|
Advertisement
|
22
|
37
|
88
|
28
|
101
|
|
General news
|
9
|
11
|
19
|
61
|
140
|
|
FARM MAGAZINE
|
26
|
17.33
|
Scientific articles
|
14
|
18
|
42
|
24
|
128
|
|
Success stories
|
8
|
12
|
32
|
56
|
140
|
|
Expert Interview
|
-
|
-
|
-
|
-
|
-
|
|
INTERNET
|
4
|
2.66
|
Cell phones
|
-
|
1
|
2
|
1
|
-
|
|
Browsing center
|
-
|
-
|
-
|
-
|
-
|
DISTRIBUTION OF GROWERS ACCORDING TO REASONS OF MARKETING CHANNEL SELECTION
The table-IV highlights that 27.3% of growers are selecting marketing channel
based on the degree of accessibility and availability of channel 32% of growers
are selecting marketing channel based on the brokers effect and 40.6% of growers
are selecting marketing channel due to influence of friends and relatives. Through
a comparative study the extent of participation in selecting marketing channel on
the basis of influence of friends and relatives is more frequent fallowed by brokers
effect and accessibility respectively.
The extent of participation according to frequency for selecting channel by accessibility
is decreasing from frequently to never which infers that maximum times growers use
accessibility as a source of channel selection. The frequency for selecting brokers
as a source of channel selection is decreasing from frequently to never which infers
that maximum times growers use brokers as a sources of channel selection. The frequency
for selecting friends and relatives as a source of channel selection decreasing
from frequently to never. This infers that maximum time’s growers are using friends
& relatives as a source of channel selection.
Table IV
|
MARKETING CHANNEL SELECTION
|
DISTRIBUTION EXTENT OF PARTICIPATION
|
|
Freq.
|
%age
|
Frequently
|
Oftenly
|
Normally
|
Rarely
|
Never
|
|
Freq.
|
%age
|
Freq.
|
%age
|
Freq.
|
%age
|
Freq.
|
%age
|
Freq.
|
%age
|
|
ACCESSIBILITY
|
41
|
27.3
|
41
|
27.3
|
32
|
21.3
|
33
|
22.0
|
16
|
10.7
|
28
|
18.7
|
|
BROKERS
|
48
|
32.1
|
36
|
24.0
|
62
|
41.3
|
12
|
8.0
|
15
|
10.0
|
25
|
16.7
|
|
FRIENDS AND RELATIVES
|
61
|
40.6
|
22
|
14.7
|
47
|
31.3
|
48
|
32.0
|
23
|
15.3
|
10
|
6.7
|
|
TOTAL
|
150
|
100
|
|
DISTRIBUTION OF GROWERS ACCORDING TO AWARENESS OF SCHEMES
The table-V highlights that 5.33% of people are aware of AGMARKNET, 8% of people
are aware of NAFEED, 28.66% of growers are aware of Apple advance scheme, 25.33%
of people are aware of JKHPMC and 80 people are aware of MIS. Through a comparative
study the extent of awareness of these schemes Apple advance scheme is more popular
followed by JKHPMC, NAFEED, MIS and AGMARKNET respectively.
The extent of awareness according to frequency of awareness about AGMARKNET is
increasing from frequently to never, which infers that maximum number of growers
know very little about this scheme the frequency of awareness about NAFEED is increasing
from frequently to never which infers that maximum numbers of growers know very
little about this scheme. Same degree of frequency is found for Apple advanced scheme,
JKHPMC & MIS respectively. It is clear that all growers lack necessary information
about these schemes which results in low efficiency of this scheme. This may be
due to inappropriate selection of information and programme source, growers who
are knowing about these schemes like Apple advance scheme are not frequently participating
in these schemes due to rigid procedure of these schemes.
Table V
|
SCHEMES
|
DISTRIBUTION EXTENT OF PARTICIPATION
|
Total Freq.
|
|
Freq.
|
%age
|
Frequently
|
Oftenly
|
Normally
|
Rarely
|
Never
|
|
Freq.
|
%age
|
Freq.
|
%age
|
Freq.
|
%age
|
Freq.
|
%age
|
Freq.
|
%age
|
|
AGMARKNET
|
8
|
5.33
|
2
|
1.3
|
1
|
0.6
|
3
|
2
|
2
|
1.3
|
142
|
94.66
|
150
|
|
NAFEED
|
12
|
8.00
|
5
|
3.33
|
0
|
0
|
4
|
2.6
|
3
|
2
|
138
|
92
|
150
|
|
APPLE ADVANCE SCHEME
|
43
|
28.66
|
13
|
8.66
|
2
|
1.3
|
11
|
7.33
|
17
|
11.33
|
107
|
71.33
|
150
|
|
JKHPMC
|
38
|
25.33
|
8
|
5.33
|
11
|
7.33
|
9
|
6
|
10
|
6.66
|
112
|
74.66
|
150
|
|
MIS
|
12
|
8.02
|
5
|
3.33
|
2
|
1.3
|
3
|
2
|
2
|
1.3
|
138
|
92
|
150
|
|
NONE
|
37
|
24.66
|
|
SUGGESTIONS
Based on the findings the following recommendations are made:
· The information producers should identify proper mechanisms
of disseminating information among rural farmers. Situation remaining unabated,
the traditional and interpersonal means are more useful in the rural settings. This
requires an active link between producers and the sources that relay information
to the rural farmers.
· There is a need to first encourage and establish context
and location specific agricultural programs aired through television and radio stations.
This should be followed by encouraging and supporting local radio and television
stations as well as local publications that are context-specific.
· Government and development partners need to encompass
in their programmes an aspect of information dissemination targeting the local community
in which programs are implemented.
· The dynamic nature of the information needs of the
farmers calls for a continuous process of identifying them. It is thus recommended
that further research has to look across agro-ecological zones taking into account
the level of development of each locality.
· There is need to brand Kashmiri apple in such a manner
that the originality of fruit is traced from Kashmir region. This will help to get
better returns and will also avoid the Kashmiri name being misused by the any other
state for selling their produce.
· The state government should revive the fruit growers
Cooperative marketing societies and activate the Horticulture department as well
as JKHPMC in order to provide better marketing facilities and also to eliminate
the role of middle man.
· Local mandies need to be established at tehsil level
in order to make the direct sale by apple growers with minimum expenditure.
· The market infrastructure in terms of cold storage
should be created in the state, in order to avoid the market risk and also to strike
a balance between demand and supply.
· Since the market rate of apple fluctuates, there should
be a minimum price fixed (Per K.G or per box) by the government so that growers
will at least be sure of the minimum returns as is done is other states.
· Since this Sector is one of the major foreign exchange
earners of the state it should be given status of an industry so that special attention
can be diverted to it. Provisions should be made for more exports. The apple in
the regions should be uplifted on the lines of SEZS.
· The procedure of financing should be made easy and
convenient for the farmers in order to make it Popular among the apple growers.
· There is need for the provision of crop insurance
in the case of natural calmatives like droughts, hail storm or other natured disasters.
CONCLUSION
The research shows apple growers have strong incentive to apple sale information,
investigating price and demand changes by using all the available information sources.
However, low availability of market information and high cost on analysis and recognition
of getting signals cause such problems, including convergence of information sources,
limitation in the local market, and low reliability of information. Growers &
policy makers should concentrate on the sources of channel information as it is
highlighted that selected channel by accessibility and brokers’ effect is less profitable.
Growers are selecting these channels by identifying friends and relatives as a source
of channel selection which can be used as a source of information distribution.
The analysis reveals that farmers understand marketing as an important factor, but
they primarily see it only as a means to sell their product and reap their revenues,
and do not understand the principles behind how to successfully market their products
so as to maximize their revenues.
REFERENCES
Agarwal P.k. (2002), Agriculture Marketing Civil lines” New Delhi. 3,5
Ahmad. N. (2008), “Problems and prospects of temperate fruits and nut production
scenario in India vis-à-vis international scenario “central institute of temperate
Horticulture Srinagar”
and Agriculture Organization of the United Nations (FAO), Rome, available at:
ftp://ftp. fao.org/docrep/fao/012/x8826e/x8826e00.pdf
Annual report of agriculture P
REFERENCES >Masoodi M.A, 2003, “Agriculture in Jammu and Kashmir a perspective”
Mohisarw book series Srinagar p.195.
Masoodi M.A. (2003), Agriculture in Jammu and Kashmir a perspective, Mohisarw
book series Srinagar
Mittal.S, 2007 “Can Horticulture be a success story for India” (ICRIER) Working
Paper no. 197 p. 8 p.195
satish.Y (et.al) 2006 “Prospects for India’s Emerging Apple Market, USDA 2006
p.8.
Satish.Y. (2006), Prospects for India’s Emerging Apple
Market, USDA, p.8
Shaheen F.A and Gupta S.P, 2002 “Economics of apple marketing in Kashmir province,
Agriculture Marketing Journal, 4(4), 4-5.
Shapoo, J. A., and Banerjee, B. N., (2003). Economics of Apple Trade in Anantnag
district of Jammu and Kashmir, Agricultural Marketing, 16, 2.
Shepherd, A.W. (2011), Extension Guide: Understanding and Using Market Information,
Food
Srijit Mishra, (2009), Poverty and Agrarian Distress in Orissa, in The Indian
Economic Association, 92 nd Annual Conference, 2, 309-316.
The Apple is the Pomaceous fruit of the Apple Tree (http//en.wikipedia.org/wiki/apple.)
2010.
World Development Report (2008), Agriculture for Development, World Bank, Washington,
DC
Srijit Mishra (2012), Hunger, Ethics
and the Right to Food, Indian Journal of Medical Ethics, 9(1),
32-37.

