A Refereed Monthly International Journal of Management
Characterization of the Customers Involved in Posting Online Comments on Ecommerce
Companies through Netnography
|
Gautam Deka
Research Scholar
School of Management
Sir PadampatSinghania University
Udaipur 313601, Rajasthan, India
Email: dekagautam@gmail.com
|
Dr Sumangla Rathore
Assistant Professor
School of Management
Sir PadampatSinghania University
Udaipur 313601, Rajasthan, India
Contact No.- +91-9828260098
Email: sumanglarathore@gmail.com
|
Dr Avinash Panwar
Assistant Professor,
School of Engineering,
Sir PadampatSinghania University
Udaipur 313601, Rajasthan, India
Contact No.- +91-9414164608
Email: avinashpanwar@gmail.com
|
Abstract
Online shopping has grown exponentially in India over the last few years. Several
eCommerce companies have been established to cater to the need of the online customers.
To understand consumer behaviour towards online shopping, traditionally survey,
experiment or interview based researchhas been mostly used. However with the introduction
of Netnography, the prospect of studying consumer behaviour by observing and capturing
the real sentiments of customers has increased several folds. In the present study
an attempt has been made to characterize the customers with respect to their gender,
age and preference of time for posting comments oneCommerce companies through Netnography.
The findings of the study indicate that the frequency of posting comments on eCommerce
companies by male participants is significantly higher than the female participants
and participation of the younger generation (between 20 to 30 years) is significantly
higher than the older generation (45 years and above). The most active age group
of participants involved in posting comments on eCommerce companies is between 26
to 30 years, for both male and female participants. The most preferred timing for
posting comments was between 12 pm to 4 pm for the female participants, and between
4 pm to 8 pm for male participants. The study has implications for marketers in
terms of providing a better and more accurate profile of customers who are actively
engaged in spreading online word of mouth.
Keywords: Online comments, netnography, online buyers, customer
profile
Introduction
Social networking sites have generated to a network where increasing number of people
are coming in contact with one another and share a common interest. Consumers tend
to seek advice before they buy anything and social media has become a medium where
they can not only seek advice but also gather information, opinions from people
about the product. The emergence of web is one of the most influential developments
in the business world that has exposed the change in the relationship between the
companies and the consumers. The initiation of social media has given a platform
to the marketers how to conduct their marketing strategies and reach out to the
consumers. The core of any business is to have profitable customer relationship
and these social networking sites are helping them to not only understand the need
of the customers and maintain relationship but also build goodwill (Sharma and Gupta,
2015).Social networking sites are defined as the websites which link millions of
users from all over the world with same interest, views and hobbies(Sin et al.,
2012). Some of the examples of popular social media among the consumers are Blogs,
video sharing sites such as Youtube, social networking sites such as Facebook, Twitter,
LinkedIn and websites based on user-generated content and reviews such as Mouthshut
etc. Social media has also influenced consumer behaviour from information acquisition
to post-purchase behaviour such as dissatisfaction statements or behaviours about
a product or a company (Mangold and Faulda, 2009).
Social media is a source for collection of the viewpoints of the people which may
be favourable or unfavourable. Therefore, one aspect of the social networking sites
is that it is helping the people to easily get information about the product and
the company, which helps the consumers to form their own opinion about the product
and the company before they actually buy. At the same time there is another aspect
of social networking sites that is especially damaging the marketing campaigns,
which is the negative posts (comments) made by the people. Unhappy customers and
industry competitors are able to post disparaging and offensive pictures, posts
or videos and there is not much a marketer can do to prevent such activities. Further,
marketers cannot effort to ignore these negative or non-constructive feedbacks.
Therefore it is important to know about the people involved in posting both negative
and positive comments about the product and the company.
Although studies of online shopping attitude are widespread in the literature, studies
of gender differences in online shopping attitude are scarce and reported findings
are inconsistent (Dittmar et al., 2004; Cry and Bonanni, 2005). An extensive review
of online shopping literature indicate that more men than women are buying online
in some studies, and that no significant gender differences exist in online shopping
behaviour between genders in other studies (Chang et al., 2005; Zhou et al. 2007).
Thus gender differences in online shopping attitude deserve more attention and better
understanding, particularly under Indian conditions.
Similarly, there are contradictions in the findings of research on age and online
purchasing with some indicating that younger generation tend to shop more online
(Dholakia and Uusitalo, 2002; Joines et al., 2003) while others have found that
older consumers were more likely to shop online (Donthu and Garcia, 1999; Korgaonkar
and Wolin, 1999). Sorce et al. (2005) have concluded that demographic factors versus
shopping motivations and attitudes in predicting online shopping remain as open
question.
Hoelzl (2015) reported that peak online spending coincides with prime TV time (8
pm to 11 pm) compared to rest of the day. They came to this conclusion after examining
1.2 million online purchases from eleven sectors (including fashion, electronica
and travel). However, there exists no report on the preference of time for posting
comments on online shopping fromeCommerce companies.
Studies on online consumer behaviour and opinion have relied largely on a range
of qualitative and quantitative market research techniques conducted such as focus
groups, surveys and interviews. Such methods were the only means for gathering this
kind of data in the past, whereas today internet has provided another approach to
obtain the desired information. With the rapid emergence of blogs, forums, social
networks and plethora of information posted on the internet, huge amount of information
(data) is now available, which needs to be collected and analyzed. This has opened
a new approach to understanding consumer behavior, by collection and analysis of
data from the internet. This approach is called “netnography” (Kozinets,
2002). Netnography is the process of accessing and analyzing sentiments and opinions
expressed by consumers chatting in blogs, forums and online discussion groups. This
method is much quicker, cheaper and results are arguably more authentic expressions
of opinion and need(Deka, Rathore and Panwar, 2015).With the introduction of netnography
the scope for such studies has increased several folds. Therefore, keeping the above
facts in view, a netnographic study was undertaken to characterize the participants
involved in posting comments (both negative and positive) online (on social media
site) on shopping from few important eCommerce companies in India, with the following
objectives:
- To determine whether there are differences in posting online comments on eCommerce
companies based on gender.
- To determine whether there are differences in posting online comments on eCommerce
companies based on age.
- To determine whether there are specific preferences in the timing of posting online
comments on eCommerce companies by different age groups of different gender.
Methodology
Considering the various definitions and descriptions of research methods, the study
falls in the category of non-verbal, non-interactive observation method, where the
observer does not interact to a great degree with those he or she is observing.
The researcher’s role is mainly confined to observe and record, and not to
actively participate. The study aimed at understanding the characteristics of online
customers who are involved in posting comments online regarding their online buying
experiences at the leading e-commerce companies in India. For this purpose, four
eCommerce companies namely, Flipkart, Snapdeal, Amazon India and eBay India were
selected for the study on the basis of their customer base, market share and popularity.
Kozinets(2002) has given following methodological steps for netnography:
- Identification and Selection of Online Communities:
The social media site Mouthshut.com was identified as the online community for data
collection. MouthShut.com was launched in year 2000 in Mumbai and was India’s
first user-generated content and review based website. It a highly popular and trusted
consumer feedback network and is one among the leaders in the user-generated content
space in India. Mouthshut.com hosts millions of customer reviews written by ordinary
consumers on products and services and allows them to not only read reviews but
also post their opinions and ratings. (www.mouthshut.com, 2016).
- Community Observation and Data Collection:
For this purpose, all the comments that were posted by customers of the selected
e-commerce companies for a period of one year (July 2014 to June 2015) were collected.
- Data Analysis and Aggregation of Consumer Insights- Iterative Interpretation
of Findings:
Finally data was cleansed and prepared for further analysis by tabulating the comments
using a spreadsheet application. The participants were classified on the basis of
sex (male and female) and also on the basis of their age. The participants represented
the age groups from 16 to 70 years. For convenience 11 age groups of the participants
were formed with five years of interval as follows: 16-20, 21-25, 26-30, 31-35,
36-40, 41-45, 46-50, 51-55, 56-60, 61-65, and 66-70.The comments were also classified
on the basis of the time of the day at which it was posted. For this, the six time
groups with the interval of four hours were formed as follows: 12 am - 4 am, 4 am
- 8am, 8 am – 12 pm, 12 pm – 4 pm, 4 pm – 8 pm, and 8 pm to 12am.
The collected data were statistically analysed with the help of Chi-square test
and ANOVA - F-test.
Results and Discussion
1. Characterization of participants on the basis of gender and age
The total number of comments posted on four eCommerce companies during the selected
period of data collection are as follows:
Flipkart – 793, Snapdeal - 416, Amazon – 380 and eBay – 226 comments.
The highest number of comments were posted about Flipkart followed by Snapdeal,
Amazon and eBay.
Distribution of male, female and all (male + female) participants of different age
groups involved in posting comments on four eCommerce companies, namely Flipkart,
Snapdeal, Amazon and eBay are presented in Table 1, 2, 3, and 4 respectively.
Table 1.Distribution of male, female and all participants (male + female) of different
age groups involved in posting comments on Flipkart.
|
Age Group (Years)
|
Male (M)
|
Female (F)
|
Total (M + F)
|
|
No.
|
%
|
No.
|
%
|
No.
|
%
|
|
15-20
|
40
|
6.46
|
14
|
8.05
|
54
|
6.81
|
|
21-25
|
160
|
25.85
|
45
|
25.90
|
205
|
25.85
|
|
26-30
|
169
|
27.30
|
59
|
33.90
|
228
|
28.75
|
|
31-35
|
112
|
18.09
|
37
|
21.25
|
149
|
18.79
|
|
36-40
|
65
|
10.50
|
8
|
4.60
|
73
|
9.21
|
|
41-45
|
40
|
6.46
|
5
|
2.85
|
45
|
5.67
|
|
46-50
|
18
|
2.91
|
2
|
1.15
|
20
|
2.52
|
|
51-55
|
8
|
1.29
|
4
|
2.30
|
12
|
1.52
|
|
56-60
|
2
|
0.32
|
--
|
--
|
2
|
0.25
|
|
61-65
|
4
|
0.65
|
--
|
--
|
4
|
0.50
|
|
66-70
|
1
|
0.16
|
--
|
--
|
1
|
0.13
|
|
Total
|
619
|
78.06
|
174
|
21.94
|
793
|
100.00
|
|
Mean
|
56.21
|
21.75
|
72.09
|
|
SD
|
63.01
|
22.02
|
83.59
|
|
Chi-Square
|
705.603
|
156.115
|
969.289
|
|
Df
|
10
|
7
|
10
|
|
Sig.
|
0.000
|
0.000
|
0.000
|
Table 2.Distribution of male, female and all participants (male + female) of different
age groups involved in posting comments on Snapdeal.
|
Age Group (Years)
|
Male (M)
|
Female (F)
|
Total (M + F)
|
|
No.
|
%
|
No.
|
%
|
No.
|
%
|
|
15-20
|
18
|
5.31
|
1
|
1.29
|
19
|
4.57
|
|
21-25
|
78
|
23.00
|
19
|
24.67
|
97
|
23.32
|
|
26-30
|
89
|
26.25
|
27
|
35.06
|
116
|
27.88
|
|
31-35
|
72
|
21.24
|
16
|
20.78
|
88
|
21.15
|
|
36-40
|
37
|
10.91
|
6
|
7.79
|
43
|
10.37
|
|
41-45
|
29
|
8.55
|
7
|
9.09
|
36
|
8.65
|
|
46-50
|
9
|
2.65
|
--
|
--
|
9
|
2.16
|
|
51-55
|
1
|
0.29
|
--
|
--
|
1
|
0.24
|
|
56-60
|
3
|
0.88
|
1
|
1.29
|
4
|
0.96
|
|
61-65
|
1
|
0.29
|
--
|
--
|
1
|
0.24
|
|
66-70
|
2
|
0.59
|
--
|
--
|
2
|
0.48
|
|
Total
|
339
|
81.49
|
77
|
18.51
|
416
|
100.00
|
|
Mean
|
30.81
|
11.00
|
37.81
|
|
SD
|
33.72
|
9.88
|
42.99
|
|
Chi-Square
|
368.991
|
53.273
|
488.967
|
|
Df
|
10
|
6
|
10
|
|
Sig.
|
0.000
|
0.000
|
0.000
|
Table 3.Distribution of male, female and all participants (male + female) of different
age groups involved in posting comments on Amazon.
|
Age group (Years)
|
Male (M)
|
Female (F)
|
Total (M + F)
|
|
No.
|
%
|
No.
|
%
|
No.
|
%
|
|
15-20
|
18
|
6.08
|
5
|
5.95
|
23
|
6.05
|
|
21-25
|
70
|
23.65
|
23
|
27.38
|
93
|
24.47
|
|
26-30
|
72
|
24.32
|
26
|
30.95
|
98
|
25.79
|
|
31-35
|
60
|
20.27
|
19
|
2.61
|
79
|
20.79
|
|
36-40
|
37
|
12.50
|
6
|
7.14
|
43
|
11.32
|
|
41-45
|
19
|
6.41
|
5
|
5.95
|
24
|
6.32
|
|
46-50
|
10
|
3.38
|
--
|
--
|
10
|
2.63
|
|
51-55
|
3
|
1.01
|
--
|
--
|
3
|
0.79
|
|
56-60
|
1
|
0.34
|
--
|
--
|
1
|
0.26
|
|
61-65
|
4
|
1.35
|
--
|
--
|
4
|
1.05
|
|
66-70
|
2
|
0.68
|
--
|
--
|
2
|
0.53
|
|
Total
|
296
|
77.89
|
84
|
22.11
|
380
|
100.00
|
|
Mean
|
26.91
|
14
|
34.54
|
|
SD
|
28.11
|
9.75
|
38.01
|
|
Chi-Square
|
293.689
|
34.000
|
418.311
|
|
Df
|
10
|
5
|
10
|
|
Sig.
|
0.000
|
0.000
|
0.000
|
Table 4.Distribution of male, female and all participants (male + female) of different
age groups involved in posting comments on eBay.
|
Age Group (Years)
|
Male (M)
|
Female (F)
|
Total (M + F)
|
|
No.
|
%
|
No.
|
%
|
No.
|
%
|
|
15-20
|
4
|
2.19
|
3
|
6.98
|
7
|
3.10
|
|
21-25
|
36
|
19.67
|
7
|
16.28
|
43
|
19.03
|
|
26-30
|
44
|
24.04
|
13
|
30.23
|
57
|
25.22
|
|
31-35
|
41
|
22.40
|
10
|
23.26
|
51
|
22.57
|
|
36-40
|
27
|
14.75
|
5
|
11.63
|
32
|
14.16
|
|
41-45
|
16
|
8.74
|
4
|
9.30
|
20
|
8.85
|
|
46-50
|
5
|
2.73
|
1
|
2.33
|
6
|
2.65
|
|
51-55
|
3
|
1.64
|
--
|
--
|
3
|
1.33
|
|
56-60
|
3
|
1.64
|
--
|
--
|
3
|
1.33
|
|
61-65
|
1
|
0.55
|
--
|
--
|
1
|
0.44
|
|
66-70
|
3
|
1.64
|
--
|
--
|
3
|
1.33
|
|
Total
|
183
|
80.97
|
43
|
19.03
|
226
|
100.00
|
|
Mean
|
16.63
|
6.14
|
20.54
|
|
SD
|
17.09
|
4.18
|
21.43
|
|
Chi-Square
|
175.672
|
9.326
|
223.735
|
|
Df
|
10
|
5
|
10
|
|
Sig.
|
0.000
|
0.000
|
0.000
|
It is evident from the tables that most active group of participants belong to the
age group from 21 to 35 for both males and females in the case of all the four eCommerce
companies. However, highest percentage of participants (both male, female) belong
to the age group of 26 – 30 years for all the four eCommerce companies. In
the case of males, the active age of participants has been found to be up to 40
years. Thereafter there is a sharp decline in the male percentage of participants
and becomes almost negligible or nil after the age 50. In the case of female, the
active age of the participants has been found to be up to 35 and thereafter it declines
drastically becomes negligible or nil after the age 45 years. This trend was found
to be similar in all the four eCommerce companies.
It is evident from the Tables 1, 2,3,and 4 that the percentage of male participants
(78.06%, 81.49%, 77.89%, and 80.97% for Flipkart, Snapdeal, Amazon and eBay, respectively)
is significantly higher than the female participants (21.94%, 18.51%, 22.11%, and
19.03% for Flipkart, Snapdeal, Amazon and eBay, respectively) in all the four eCommerce
companies. It is also evident that there was a significant relation between both
age and gender of the participants and the involvement in posting comments on eCommerce
companies as revealed through Chi-square test (Table 1, 2, 3, and 4).
Table 5 and Figure 1 show the distribution of male, female and all (male + female)
participants involved in posting comments on all the four eCommerce companies.
Table 5. Distribution of male, female and all (male + female) participants involved
in posting comments on four e-Commerce companies.
|
eCommerce companies
|
Male (M)
|
Female (F)
|
Total (M + F)
|
|
No.
|
%
|
No.
|
%
|
No.
|
%
|
|
Flipkart
|
619
|
78.06
|
174
|
21.94
|
793
|
43.69
|
|
Snapdeal
|
339
|
81.49
|
77
|
18.51
|
416
|
22.92
|
|
Amazon
|
296
|
77.89
|
84
|
22.11
|
380
|
20.93
|
|
eBay
|
183
|
80.97
|
43
|
19.03
|
226
|
12.45
|
|
Total
|
1437
|
79.17
|
378
|
20.83
|
1815
|
100.00
|
|
Mean
|
359.25
|
79.55
|
94.50
|
20.39
|
453.75
|
24.99
|
|
SD
|
185.24
|
55.94
|
240.71
|
|
SE
|
92.62143
|
27.97171
|
67.15107
|
|
Chi-Square
|
286.555
|
99.354
|
383.085
|
|
Df
|
3
|
3
|
3
|
|
Sig.
|
0.000
|
0.000
|
0.000
|
Fig. 1. Distribution of the male, female and all (male + female) participants involved
in posting comments on four eCommerce companies. FK=Flipkart, SD=Snapdeal, AM=Amazon,
EB=eBay.
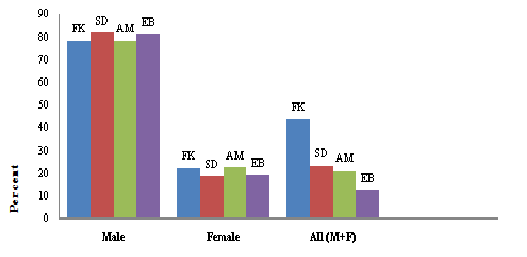
The percentage distribution of the male participants ranged from 77.89% (Amazon)
to 81.49% (Snapdeal), and for females from 18.51% (Snapdeal) to 22.11% (Amazon).
The mean value being 79.55% for the males and 20.83% for the females. The percentage
distribution within the males andwithin females participants involved in posting
comments has not been found to be significant. It was evident that there is a significant
relation between the gender and in the participation for posting comments on the
four eCommerce companies as revealed through Chi-square test (Table 5).
In the present study, participation of males was found to be significantly higher
than females in posting comments on eCommerce companies. Earlier it has also been
reported that males are more likely to shop online than females (Tweney, 1999; Leonardo,
2003). Moreover attitude towards Internet is also shown to be more positive for
males than females (Durndell and Haag, 2002; Liaw, 2002). Jayawardhena et al., (2007)
attested for a significant relationship between gender and online purchasing intension.
Another study revealed that if number of Internet users is equally divided among
the gender, more men than women engage in online shopping and make online purchase
(Rodgers and Harris, 2003). In the Western culture, studies relating to constructs
like perceived risk of online buying (Garbarino and Strahilevitze, 2004) and technology
adoption (Sanchez-Franco, 2006) have been performed. But there is a dearth of literature
regarding investigative studies on gender differences in online buying attitude
in emerging economies like India. Although, Ahmed and Khan (2015) suggested that
there is positive inclination of Indian consumer towards eCommerce, other reports
are inconsistent (Cyr and Bonanni, 2005; Fatahuddin and Khan, 2006).
In general, men demonstrated higher behavioural intention to shop online than women.
Attitude theory presents the behavioural component of attitude as a function of
the cognition and affect components. Since females show lower cognitive and affective
attitudes than males, their behavioural intention to shop online is lower (Sanchez-Franco,
2006, Hasan 2010). Since cognitive attitude pertains to understanding pros and cons
of an object (Zhou et al. 2007), it has been suggested that females are still unconvinced
or sceptical about the benefits of online shopping. Similarly, it may suggest that
the females are still concerned and apprehensive about the risks and threats associated
with online shopping (Garbarino and Strahilevitze, 2004) Accordingly, greater understanding
the value of online shopping (cognition) or improvement in social and emotional
experiences in online shopping (affection) are likely to boost online shopping behaviour
among female consumers (Hasan 2010). Although gender has been largely studied in
relation to online shopping behaviour, studies related to the feedbacks or comments
posted by the online shoppers are non-existent.
The second finding of the study indicates that age of the participants is an important
factor in determining the involvement in posting comments about online buying experiences.
Participation of younger people (both male and female) is significantly higher than
the older people. The Internet has typically been described as a youth’s medium.
Young men and women have also been regarded as the typical profile of the early
adopters of online shopping. Cassis (2007) reported that that college going students
spend hours using the Internet every day and more keen in buying online. However,
as the Internet has become more ubiquitous, the profile of the online shopper has
come to resemble that of the general population (Stores, 2001). In the USA consumers
aged 50 and above comprise of 16% of new online shoppers and the number is expected
to increase in the following years (Tedeschi, 2002). In the present study participation
of older person above the age of 45 years, in posting comments on eCommerce companies,
was found to be negligible. Thus the finding in the USA is not yet applicable in
India. This means that younger people are still the dominating age group involved
in online activities.
Joines et al., (2003) found that age did not impact search behaviour but did impact
purchase behaviour, and younger consumers purchased more than older consumers. Sorce
et al. (2005) reported that while older online shoppers search for significantly
fewer products than their younger counterparts, they actually purchase as much as
younger consumers. They further reported that attitudinal factors explained more
variance in online searching behaviour. Age explains more variance in purchasing
behaviour if the consumer had first searched for the product online (Sorce et al.,
2005). Donthu and Garcia (1999) also found that those who had ever purchased from
the Internet were older and had higher income.
2. Characterization of participants on the basis of the time of posting comments
Table 6 and Figure 2 show the distribution of male participants involved in posting
comments at different time of the day on four eCommerce companies.
Table 6. Distribution of male participants involved in posting comments at Different
Time of the Day on four eCommerce Companies.
|
eCommerce Companies
|
Male participants
|
|
Timing of posting the comments
|
|
12am-4am
|
4am-8am
|
8am-12pm
|
12pm-4pm
|
4pm-8pm
|
8pm-12am
|
|
No.
|
%
|
No.
|
%
|
No.
|
%
|
No.
|
%
|
No.
|
%
|
No.
|
%
|
|
Flipkart
|
56
|
9.04
|
1
|
0.16
|
97
|
15.67
|
150
|
24.23
|
161
|
26.00
|
153
|
24.71
|
|
Snapdeal
|
14
|
4.12
|
5
|
1.47
|
50
|
14.74
|
106
|
31.26
|
109
|
32.15
|
79
|
23.30
|
|
Amazon
|
19
|
6.41
|
7
|
2.36
|
50
|
16.89
|
96
|
32.43
|
63
|
21.28
|
61
|
20.60
|
|
eBay
|
9
|
4.91
|
7
|
3.82
|
27
|
14.75
|
54
|
29.50
|
55
|
30.05
|
31
|
16.93
|
|
Total
|
98
|
6.72
|
20
|
1.37
|
224
|
15.36
|
404
|
27.70
|
388
|
26.61
|
324
|
22.22
|
|
Mean
|
24.50
|
5.00
|
56.00
|
101.50
|
97.00
|
81.00
|
|
SD
|
21.39
|
2.82
|
29.40
|
39.40
|
48.85
|
51.92
|
|
SE
|
10.69
|
1.41
|
14.70
|
19.70
|
24.42
|
25.96
|
|
F
|
4.718
|
|
Sig.
|
0.066 (>0.05, significant)
|
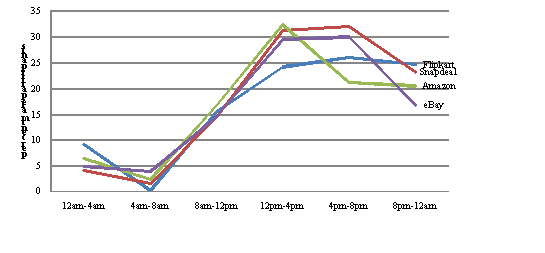
Fig.2. Distribution of male participants involved in posting comments on four eCommerce
companies at different time of the day.
Period of the time of the day
It is evident that the highest percentage of comments posted by male participants
on three eCommerce companies (Flipkart: 26%, Snapdeal: 32.15%, and eBay: 30.05%)
was between 4 pm to 8 pm. However, in the case of Amazon highest percentage (32.43%)
being between 12 pm to 4 pm and the second highest (21.28%) being between 4 pm and
8 pm.The highest overall percentage (27.70%) was between 12 pm – 4 pm. On
the other hand lowest percentage (1.37%) was between 4 am to 8 am.It is evident
from the F-test that the particular period time of the day has significant bearing
on the male participants in their participation for posting comments on eCommerce
companies (Table 6). Table 7and Figure 3show the distribution pattern of female
participants involved in posting comments at different time of the day on four eCommerce
companies.
Table 7. Distribution of female participants involved in posting comments at Different
Time of the Day on four eCommerce Companies.
|
eCommerce Companies
|
Female participants
|
|
Timing of posting the comments
|
|
12pm-4am
|
4am-8am
|
8am-12pm
|
12pm-4pm
|
4pm-8pm
|
8pm-12am
|
|
No.
|
%
|
No.
|
%
|
No.
|
%
|
No.
|
%
|
No.
|
%
|
No.
|
%
|
|
Flipkart
|
16
|
9.19
|
--
|
--
|
30
|
17.24
|
53
|
30.45
|
49
|
28.16
|
35
|
20.11
|
|
Snapdeal
|
8
|
10.78
|
--
|
--
|
12
|
15.58
|
23
|
29.87
|
11
|
14.28
|
23
|
29.87
|
|
Amazon
|
7
|
8.33
|
2
|
2.38
|
12
|
14.28
|
20
|
23.80
|
18
|
21.42
|
25
|
29.76
|
|
eBay
|
2
|
4.65
|
3
|
6.97
|
8
|
18.60
|
12
|
27.90
|
12
|
27.90
|
6
|
13.95
|
|
Total
|
33
|
8.52
|
5
|
1.29
|
62
|
16.02
|
108
|
27.90
|
90
|
23.25
|
89
|
22.99
|
|
Mean
|
8.25
|
2.50
|
15.50
|
27.00
|
22.50
|
22.25
|
|
SD
|
5.79
|
0.70
|
9.84
|
17.94
|
17.93
|
12.03
|
|
SE
|
2.897
|
0.750
|
4.924
|
8.972
|
8.967
|
6.019
|
|
F
|
2.501
|
|
Sig.
|
0.69 (>0.05, significant)
|
Fig. 3. Distribution of female participants involved in posting comments on four
eCommerce companies at different time of the day.
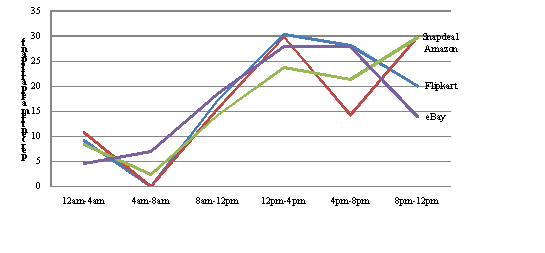
Period of the time of the day
It is evident that the highest percentage (30.45%) of comments posted by female
participants on Flipkart was between 12 pm to 4 pm, whereas in the case of Snapdeal
the highest percentage was equal (29.87%) between 12 pm - 4 pm, and 8 pm -12 am.
In the case of Amazon the highest percentage (29.76%) was between 8 pm and 12 am,
whereas in the case of eBay the highest percentage was equal (27.90%)between 12
pm – 4 pm, and 4 pm – 8 pm. The highest overall percentage was between
12pm – 4 pm (28%).On the other hand lowest percentage (1.29%) was between
4 am to 8 am. It is evident from the F-test that the particular period time of the
day has significant bearing on the female participants in their participation for
posting comments on eCommerce companies (Table 7).
Table 8and Figure 4show the distribution pattern of all participants (male + female)
involved in posting comments at different time of the day on four eCommerce companies.
Table 8. Distribution of all participants (male + female) involved in posting comments
at Different Time of the Day on four eCommerce Companies.
|
eCommerce Companies
|
All (Male+ Female) participants
|
|
Timing of posting the comments
|
|
12am-4am
|
4am-8am
|
8am-12pm
|
12pm-4pm
|
4pm-8pm
|
8pm-12am
|
|
No.
|
%
|
No.
|
%
|
No.
|
%
|
No.
|
%
|
No.
|
%
|
No.
|
%
|
|
Flipkart
|
72
|
9.07
|
1
|
0.12
|
128
|
16.14
|
203
|
25.59
|
190
|
23.95
|
187
|
23.58
|
|
Snapdeal
|
25
|
6.00
|
5
|
1.20
|
62
|
14.90
|
129
|
31.00
|
96
|
23.07
|
102
|
24.51
|
|
Amazon
|
26
|
6.84
|
9
|
2.36
|
62
|
16.31
|
117
|
30.78
|
81
|
21.31
|
86
|
22.63
|
|
eBay
|
11
|
0.44
|
10
|
4.42
|
35
|
15.58
|
66
|
29.20
|
67
|
29.64
|
38
|
16.81
|
|
Total
|
134
|
7.41
|
25
|
1.38
|
287
|
15.87
|
515
|
28.48
|
434
|
24.00
|
413
|
22.84
|
|
Mean
|
33.50
|
6.25
|
71.75
|
128.75
|
108.50
|
103.25
|
|
SD
|
26.56
|
4.11
|
39.60
|
56.53
|
55.60
|
62.10
|
|
SE
|
13.282
|
2.056
|
19.80
|
28.267
|
27.804
|
31.052
|
|
F
|
4.349
|
|
Sig.
|
0.099 (>0.05, significant)
|
Fig.4. Distribution of all (M + F) participants involved in posting comments on
four eCommerce companies at different time of the day.
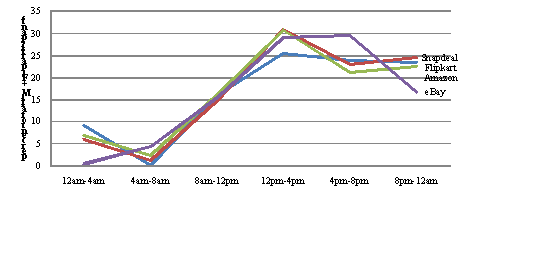
Period of the time of the day
It is evident that the highest percentage of comments posted on all the eCommerce
companies was between 12 pm to 4 pm (25.59%, 31%, 30.78%, 29.20% for Flipkart, Snapdeal,
Amazon and eBay, respectively), and the lowest percentage (0.12%, 1.20%, 2.36%,
and 4.42% for Flipkart, Snapdeal, Amazon and eBay, respectively) was between 4 am
– 8 am in the case of all the four eCommerce companies. Although this is a
small fraction, but indicate that small fraction of the consumers remain active
at these late and odd hours also. It is evident from the F-test that the particular
period time of the day has significant bearing on the all participants in their
participation for posting comments on eCommerce companies (Table 8).
So far we have not came across any study of similar nature. However, studies on
identification of the prime time for online shopping have been carried out (Patel,
2005; Hoelzl, 2015). Patel (2005) observed that visitors and followers of online
social media prefer using social media sites during specific hours. Therefore, if
someone starts sharing their contents when users are on the social sites, than they
will not only gain more shares, but also will also notice an increase in traffic.
Unfortunately there is no perfect answer as to when be the best time to post content
to social media, as different customers may find different days and times suitable
for them. Kolowich (2016), however, observed that there exist ample data on optimal
times to post on different social media such as Facebook, Twitter, Linkedin, Pinterest
and Instagram. The pulled data available from the sources like QuickSprout, SurePayroo,
The Huffington Post, Buffer, TrackMavan, Fast Company and KISSmetrics revealed that
in Facebook the best time to post is between 12.00 pm to 1.00 pm on Saturdays and
Sundays, 3.00 pm to 4.00 pm on Wednesdays and 1.00 pm to 4.00 pm on Thursdays and
Fridays. Similarly, in Twitter the best time to post is between 12.00 pm to 3.00
pm on Mondays through Fridays and from 5.00 pm to 6.00 pm on Wednesdays (Kolowich,
2016). He further observed that timing often depends on the platform, how the target
audience interacts with the platform, regions being targeted, content of the post
and the goals.
In the early days of the Internet, the overwhelming majority of online shoppers
logged on from work place, as they had access to high-speed connections at work,
but not at home. Over time things have changed and more homes are now connected
with broadband. However a survey conducted in USA by CyberSource (2006)indicated
that most eCommerce shopping happens during work hours. CyberSource(2006) found
that the peak shopping hours was between 1.00 pm to 4.00 pm. On the other hand,
online transactions hit lowest between 11.00 pm and 4.00 am. The survey also found
that highest volume online shopping days were Mondays and Tuesdays, while Saturdays
and Sundays had the lowest volume. According to another survey conducted in USA
by NetElixir (Sullivan, 2011) online shopping purchases peak during the midday hours
between 2.00 pm and 7.00 pm.
In the present study the peak hours for posting comments have been found to be between
12 pm and 8 pm. This also indicates towards a possibility that the consumers still
prefer to utilize Internet and social media from their work place rather than from
home.
Conclusion
In recent years, online shopping has grown exponentially in India. According to
a recent eCommerce survey, around 52% Indian shoppers prefer online store purchase
and 89% respondents said they bought more online in 2015 in comparison to 2014.Behaviour
towards a phenomenon is a result of combination of factors, however, attitude towards
online shopping is considered to be a significant predictor of online shopping behaviour
(Ahn et al., 2007; Lin, 2007).
The findings of the study shall be useful for the marketers to draw strategies for
managing online word of mouth generated by their customers. Key findings of the
present study and their implications for online businesses are as follows:
- The frequency of posting comments on eCommerce companies by male customers is significantly
higher than the female customers. This finding is also consistent with the fact
that there are more male online buyers than female buyers. Considering a relatively
lower percentage of active female customers who are engaged in online conversation
about online buying, e-commerce companies should develop specific schemes or tactics
for encouraging them to participate more. At the same time, it is important for
the companies to ensure that their male customers are provided with best of services
and online buying experience so that they can spread a positive word of mouth in
the online space. Companies can also develop gender specific tools that can enhance
people's intentions to publish online.
- The frequency of posting comments on eCommerce companies by younger generation (between
20 to 30 years) is significantly higher than the older generation (40 years and
above), for both male and female participants. The most active age group of participants
involved in posting comments on eCommerce companies is between 26 to 30 years, for
both male and female participants. This implies that the younger generation which
is also considered to be impulsive buyer group can be easily influenced by the online
reviews posted by others and thus, companies need to focus more on this age group.
- The most preferred timing for posting comments on eCommerce companies is between
12 pm to 4 pm for the female participants, and between 4 pm to 8 pm for male participants.
This information can be useful for the advertisers who can publish online ads and
other promotional information during this time of the day when there are higher
chances of customers staying online for shopping related activities.
References
Ahn, T.,Ryu, S.& Han, I. (2007).The Impact of Web Quality and Playfulness on
User Acceptance of Online Retailing.Information Management, 44, 263-275.
Ahmed, A.& Khan, M.N. (2015).Mapping Online Buyer Behaviour: A Critical Review
of Empirical Studies.Pacific Business Review Inernational, 8, 37-48.
Cassis, C. (2007).College Students Help Fuel Ever Growing Internet Sales.www.http://media.www.dailyfreepress.com/media/storage/paper87/news/2007/01/22/News
CyberSource. (2006). http://www.cybersource.com
Cyr, D.&Bonanni, C. (2005).Gender and Website Design in E-Business.International
Journal of Electronic Business, 3, 565-582.
Deka, G., Rathore, S., &Panwar, A. (2016).Developing a Research Framework to
Assess Online Consumer Behaviour Using Netnography in India: A Review of Related
Research. In S. Rathore, & A. Panwar (Eds.) Capturing, Analyzing, and Managing
Word-of-Mouth in the Digital Marketplace (pp. 154-167). Hershey, PA: Business
Science Reference. doi:10.4018/978-1-4666-9449-1.ch009
Dholakia, R. R.&Uusltalo, O. (2002).Switching to Electronic Stores: Consumer
Characteristics and the Perception of Shopping Benefits.International Journal of
Retail Distribution Management, 30, 459-469.
Donthu, N.&Gracia, A. (1999).The Internet Shopper.Journal of Advertising Research,
39, 52-59.
Durndell, A.& Haag, Z. (2002). Computer Self Efficiency, Computer Anxiety, Attitude
Towardsthe Internet and Reported Experience with the Internet, by Gender, in an
East European Sample. Computers Human Behaviour, 18, 521-535.
Fatahuddin, S.M.& Khan, M.N. (2016). Online Shopping Attitudes of Management
Students in India: An Empirical Exploration of Genders.Pacific Business Review International,
8, 40-45.
Garbarino, E.&Strahilevitze, M. (2004).Gender Differences in the Perceived Risk
of Buying Online and the Effects of Receiving a Site Recommendation.Journal of Business
Research, 57, 768-775.
Hasan, B. (2010). Exploring Gender Differences in Online Shoping Attitude.Computers
Human Behaviour. 26, 597-601.
Hoelzl C. (2015). IntelliAd Customer Journey Analysis- When Does Online Shopping
Peak? http://www.intelliad.com/blog/intelliad-customer-journey-analysis-when-does-online-shopping-peak/
Jayawardhena, C, Wright, L.T.& Dennis, C. (2007). Consumer Online: Intensions,
Orientations and Segmentation.International Journal of Retail Distribution Management,
35, 515-526.
Joines, J., Scherer, C.&Scheufele, D. (2003).Exploring Motivations for Consumer
Web Use and their Implications for E-Commerce.Journal of Consumer Marketing,
20, 90-108.
Kolowich, L. (2016). The Best Times to Post on Facebook, Twitter, Linkedinand other
Social Media Sites (Infographic). http://www.bloghub.com/marketing/est-times-post-pin-tweet-social-media-infographic#sm.000gimkns1cg5ep9xv02finpmauuv6
Korgaonkar, P.K.&Wolin, L.D. (1999).A Multivariate Analysis of Web Usage.Journal
of Advertising Research, 39, 53-68.
Kozinets, R.V. (2002). The Field Behind the Screen: Using Netnographyfor Marketing
Research in Online Communities. Journal of Marketing Research. 39, 61-72
Leonard, L.N.K. (2007). Acquiring Goods and Services via the Internet: Consumer
Shopping Perceptions.
http://www.firstmonday.org/issues/issue8-11/Leonard.
Liaw, S.S. (2002). An Internet Survey for Perceptions of Computers and World Wide
Web: Relationship, Prediction and Differences. Computer Human Behaviour,
18, 17-35.
Lin,H.F.(2007). The Role of Online and Offline Features in Sustaining Virtual Communities:
an Empirical Study.Internet Research, 17, 119-138.
Mangold, G.&Faulds, D. (2009).Social Media: The New Hybrid Element of the Promotion
Mix. Usiness Horizons, 52, 357-365.
Patel, N. (2015). What are the best times to post on social media?http://www.quicksprout.com/2015/01/02/what-are-the-est-time-to-post-on-social-media/
Rodgers, S.& Harris, M.A. (2003).Gender and Ecommerce: An Exploratory Study.
Journal of Advertising Research, 43, 322-329.
Sanchez-Franco, M.J. (2006). Exploring the Influence of Gender on the Web Usage
Via Partial Least Squares.Behaviour Information Technology, 25, 19-36.
Sharma, L.& Gupta, M. (2015).Impact of Social Networking Sites on Consumer’
Purchase Intentions.KAIM Journal of Management Research, 7, 68-73.
Sin, S., Nor, K.M.& Al-Agaga, A.M. (2012). Factors Affecting Malaysian Young
Consumers’ Online Purchase Intention in Social Media Websites.Social and Behavioural
Science, 40, 326-333.
Sullivan, L. (2011). Searches: What Are the Peak Times for Clicks and Conversations?
Search Marketing Daily. 29 March. pp. 1-5.
Tedeschi, B. (2002). Though There are Fewer New Internet Users, Experienced Ones,
Particularly the Middle Aged, are Increasingly Shoping Online.New York Times.
4th March. C.7.
Tweney, D. (1999). Men and Women: Online, We Should be More than Markets. InfoWorld,
21, 76.
Sorce, P., Perotti, V.&Widrick, S. (2005). Attitude and Age Differences in Online
Buying.International Journal of Retail Distribution Management, 33, 122-132.
Stores, K. (2001).Consumer Trends in Online Shopping.International Journal of Retail
Distribution Management, 83, 5-9.
Zhou, L., Dai, L.& Zhang, D. (2007). Online Shopping Acceptance Model- A Critical
Survey of Consumer Factors in Online Shopping. Journal of Electronic Commerce Research,
8, 41-62.
www.mouthshut.com

