A Refereed Monthly International Journal of Management
Economic Contribution and Performance of Technology Parks in Punjab: The Case of
IT Park Mohali
|
Dr.Vikram Chadha
Professor
GNDU, ASR
|
Gurpreet Kaur
Research Scholar
GNDU, ASR
|
ABSTRACT
Several countries have adopted different strategies, industrial policies, and models
for promoting industries by their technological capability. The concept of Technology
Park is one of the steps towards the enhancement of industries that include the
development of clusters, creates knowledge based industries, promote regional development
and also enrich the standard of living of the people. The paper discusses the economic
contribution and performance of Technology Parks in Punjab. The study is based on
the case of IT Park, located at Mohali district of Punjab. The Correlation Coefficient
was applied for finding the relationship between tax incentives benefits given and
generated employment opportunities, capital investment and sales of IT products.
A significant and highly positive relationship noticed among the mentioned economic
components, which mean that the incentives are given to the entrepreneurs for promoting
IT Park were more compensated by way of promoting employment opportunities, sales,
and capital investment. Further for evaluating the performance of IT Park particularly
in generating employment, sales, and productivity, Chi-Square Test was applied.
The results revealed that IT Park proved to be a significant trial by the state
government for promoting cluster development as well as regional development.
INTRODUCTION
Technological Innovation is an important component which endorses productive variations
in the quality and quantity of knowledge through the procedure of development and
advancement that further facilitate prompt changes in the economy and generate long-
term economic growth (Ibrahim.et.al,2008). Investment in technological innovation
leads to increase in production that invigorates the economic growth and promote
higher living standard. Innovation performs a significant base of economic growth
and sustainable development and an essential component for edifying infrastructure
and generating employment opportunities. The concept of innovation focuses on technological
innovation that includes the diffusion of new products, services, new marketing
techniques, advanced approaches to communication and positioning (Aubert, 2005).
In today’s competitive world, industries need to exploit new ideas, by empowering
new innovation for the development of enterprise, by introducing high-value added
products and services that spur the industrial competitiveness in the global market
(Gatti, 2010). Generally, technology and innovations perform a significant function
of economic growth and sustainable development to promote industrialization. In
this regard, Technology Parks would give a new level to industries by inducing new
enterprises, and also create an environment for national and international firms
to interact with each other and exchange knowledge and technology for mutual benefits
(UNIDO, 2012).
According to International Association of Science Parks, “Technology Park
is an organization managed by specialized professionals, whose main aim is to increase
the wealth of its community by businesses and knowledge- based institutions. To
enable these goals to be met, a technology park stimulates and manages the flow
of knowledge and technology amongst universities, R&D institutions, companies
and market; it facilitates the creation and growth of innovation-based companies
through incubation and spin-off processes, and provides other value-added services
together with high-quality space and facilities”. Technology Parks are platforms
for promoting technology-intensive industries, a measure for generating high-quality
job opportunities and an initiative for providing high-quality facilities and services
for high-technology industries (UNIDO, 2005). Following are the benefits of such
Parks for economic growth in any particular country:
- Creating a world-class physical facilities and preemptive support services for attracting
national and multi-national companies that nurture the growth of knowledge-based
technology – intensive specific industries;
- Establishing and encouraging new technology-based firms and stimulate the growth
of existing firms by expanding and dispersing the technology;
- Increasing growth potential and encourage competitiveness among the SME’s
by facilitating with various incentives and services for generating technology innovation
& employment; and
- Developing a management strategy that enhances linkages between tenants and the
firms, research institutions and universities (UNIDO, 2005).
The phenomenon of technology parks was originally conceived with the aim to increase
profitability by commercializing the university research and expanding entrepreneurship
in the country. The idea became increasingly important, and with the collaboration
of American companies and universities, in 1950 the first science park “The
Stanford Research Park” in California (Silicon Valley of USA) generated a
wave in the economy. Taking inspiration from Silicon Valley, four other projects
including Research Triangle Park came into existence. With the time, an effective
role of Technology Park has proved to be successful in attaining the attention of
other countries.
After the success of Technology Parks in the western region, the countries from
Asia-Pacific for accelerating their economy by utilizing their scientific and technological
capacity have shown their interest in the development of Technology Parks. Other
countries like France, United Kingdom, Belgium, Japan, Korea, Taiwan, China, India
etc. have adopted the concept of Technology Parks with the intention to lift the
local economy and regional development, encouraging cooperation and flow of knowledge
among firms within and outside the country and academies, creating job opportunities,
generating innovation and attracting foreign investment (Mangrio, 2013).
In the year 1990, India also took initiative by developing Software Technology Park
in the country and with the success of software industry, the central government
motivates to set its focus on technology parks in sectors like biotech, food, textile
other than software by introducing several schemes for the same in different regions
of the country (Vaidyanathan, 2008).Taking inspiration from other states and following
the strategy of technological dynamism, encouragement to entrepreneurship, giving
a new look to industries the state of Punjab also took initiative for the development
of Technology Parks. In order to speed up economic growth and upgrading the productivity
of IT sector, the government of Punjab has inducted development of IT Park in SAS
Nagar (Mohali) city. The present study aims at analyzing the growth, economic contribution
and performance of IT Park Mohali. The study is divided into three sections. The
section I, studies the characteristics of IT Park through its business activities,
growth trends of various economic components. Section II, deals to find the economic
contribution of IT Park in Punjab Economy and Section III tests the performance
of IT Park Mohali.
Data and Methodology
For this study, the primary data was collected through a survey of IT Park located
in Mohali district of Punjab. The selection of IT Park has based on the reason that
IT Park was the first initiative by the state government in Information Technology
Sector. Though one of the centers of STPI is also located in Mohali but it was an
initiative the central government. There were total thirty-nine firms located in
IT Park of Punjab, out of which thirty-five (89%) firms have shown their interest
in providing information. Similar kind of response rate has found in studies of
Research Park UK(21 firms) and Technology Parks of Malaysia (22 firms) (Malairaja
and Zawdie, (2008); Vedovello (1997)) .The designed questionnaire tried to find
the information about their business activities, their market (domestic oriented,
export-oriented or both), growth trend of firms in terms of units, employment capital
investment, production, and sale. The data was collected for the period of 2008
to 2014.
To estimate the growth in variables over time, the growth rate has been estimated
using semi-log linear relationship. In order to study the pattern, compound growth
rates have been used. For doing so, we estimate the exponential relation:
Transforming the equation in linear form:
From the estimated value of regression co-efficient ‘b’ the compound
growth rate was calculated as follows:
r = antilog ( b -1) *100
Where,
r = compound growth rate, b = estimated value of the ordinary least square (OLS).
The Correlation Coefficient Analysis has been used for testing the relationship
between tax incentives offered to the units located and economic receipts generated
in the form of promoting capital investment, sales and employment opportunities,
For this the hypothesis was set:
H0= No Correlation between tax incentives and economic receipts of IT
Park.
H1= Correlation between tax incentives and economic receipts of IT Park.
The hypothesis was test at 5 percent level of significance.
Further for testing the performance of IT Park, information was gathered regarding
growth trends of firms after they were start operating in IT Park. Sale, Employment
and Productivity were used as the indicators of growth. On the basis of firm level
data ordinal series has been generated in the form of whether it increases decreases
or same and the Chi-Square Test was used for testing the performance. For preparing
three-way tables, Chi-Square is defined as:
Where O= Observed Frequency, E= Expected Frequency
This calculated value of Chi-Square was compared to the tabulated value of Chi-Square
at (c-1) (r-1) d.f, and results were interpreted accordingly.
Section I: Characteristics of IT Park:
Punjab, which saw its re-organization as a state in 1966, continued to remain basically
an agricultural state, with a much less developed manufacturing sector. After partition,
most of the skilled labor in leather; sports goods and textile sectors, went to
Pakistan; while most entrepreneurs and managers shifted to India. But Punjab, being
a land-locked state could not exploit trade opportunities and hence to stimulate
its manufacturing. That’s why manufacturing in Punjab mainly remained small
scale and that too in few traditional low-value-added industries like wood products;
rubber and plastics; hosiery and woolen textiles; cycle and sewing machine parts
etc. Some engineering goods like hand tools and machine tools and steel manufacturers
did emerge; but due to anachronistic techniques and lack of state support and assured
markets, these industries could not develop on its own, resulting in their minuscule
contribution to the state domestic product (Chadha and Kaur, 2015).
Punjab needs structural transformation led by the interdependence of investment
and technological progress enhances the importance of industries. For structural
transformation in the economy, Punjab took initiatives of building up specialized
Technology Parks for different industries for stimulating the industrial growth
for increasing capital investment, diversifying as well as generating employment
opportunities for skilled and trained workers, attracting foreign direct investment
in the state, encouraging entrepreneurship and transforming the low value added
industries into high value-added industries (Chadha and Kaur, 2015).
For the sustained development of the economy of Punjab and giving more emphasis
to the development of IT sector, the state government has requisite conducive investment
environment to fuel entrepreneurship through the process of innovation. In order
to speed up economic growth and upgrading the productivity of IT sector, the government
of Punjab has inducted development of IT Park in SAS Nagar (Mohali) city. The Park
is mainly located in Sector 67 of the city and is spread over 15 acres of land.
Mohali has risen to become IT hub of the state with major technology-based companies
like KMG Infotech, IDS Infotech, Seasia Consulting etc. (Punjab Infotech, 2014).
Further, this park provides facilities for 24 x7uninterrupted power supply to various
IT companies, through industrial power feeder. The IT Park has designed for promoting
IT business, increasing competitiveness among IT firms and attracting foreign investment
for cultivating economy of Punjab. The IT Park in this state is developed according
to the availability of required infrastructure, public utilities, facilities of
training, support services for entrepreneurs and tenants, for generating productive
ground for the growth of industries. At present, there are around 35 companies located
in this Park.
The Technological changes in the process of industrialization are considered as
an effective step towards the development of industrial characteristics. These characteristics
include the structure of product composition and area of specialization. The area
of specialization of the firms is classified in the product, services and both product
and services. Table 1 reflects that in the initial period the maximum share of the
firms was in the product development activities, yet later this share tumbles to
25.72 percent only and by the year 2014 huge firms were in service activities and
other firms roughly half were involved in the specialization of the product only
and product as well as services. The low capital requirements and marketing skills
would be the major reason behind this float towards the service activities.
Table 1, Area of Specialization of Operational Firms (%)
|
Area
|
2008
|
2009
|
2010
|
2011
|
2012
|
2013
|
2014
|
|
Product
|
41.67
|
38.51
|
27.78
|
24.15
|
26.48
|
25.72
|
25.72
|
|
Services
|
33.33
|
38.51
|
33.33
|
48.27
|
44.11
|
45.71
|
45.71
|
|
Product & Services
|
25.00
|
23.08
|
38.89
|
27.58
|
29.41
|
28.57
|
28.57
|
|
Total
|
100
|
100
|
100
|
100
|
100
|
100
|
100
|
Source: Data Generated from Field Survey of IT-Technology Park,
Mohali.
The firms in IT Park perform in a different mode of activities like offshore, onshore
or both, depending upon the area of specialization and other capabilities of the
firm. From table 2, it is observed that throughout the study period about 62.85
percent of the trade has been done onshore and rest offshore and both offshore and
onshore. The industrial policies do not differentiate among the firms in terms of
their activities. Under such circumstances, most of the firms have resort to onshore
activities, which require relatively less investment.
Table2, Distribution of Activities of Firms (%)
|
Year
|
2008
|
2009
|
2010
|
2011
|
2012
|
2013
|
2014
|
|
Onshore
|
58.33
|
50
|
52.63
|
66.66
|
66.66
|
62.85
|
62.85
|
|
Offshore
|
16.66
|
21.42
|
15.78
|
10
|
9.09
|
11.42
|
11.42
|
|
Onshore and Offshore
|
25
|
28.57
|
31.57
|
23.33
|
24.24
|
25.71
|
25.71
|
|
Total
|
100
|
100
|
100
|
100
|
100
|
100
|
100
|
Source: Data Generated from Field Survey of IT-Technology Park,
Mohali.
The Information Technology Parks are extremely dynamic by nature and hold tremendous
opportunity for further expansion of software industry as per developing interest
and growing demand of the world. The firms operating in IT Parks performs major
two types of activities that include product development activities and commercial
activities. Table3, explicate the different activities of the firms. The maximum
number of firms is involved in the activities of developing software for smartphones
furthermore in web designing. The activities of the IT Park are not only constrained
to these activities but also extended to other zones like employment enhancement
programming, bioresearch, biopharmaceuticals, wireless communication, healthcare,
and finance. Some of the firms are involved in commercial activities that provide
consultancy in the area of medical, law, marketing, upgrading the business and so
forth. Probably, there are very fewer numbers of firms that have demonstrated their
enthusiasm for clinical diagnostics and biopharmaceuticals, however despite this,
they have opportunities to develop.
Table 3, Number of Operating Units that involve in Different Activities in IT
Park
|
Activities
|
No. of Companies
|
|
Product Development Activities
|
|
|
Mobile/Android/Smart Phones
|
8
|
|
Web Designing/Development
|
7
|
|
Employment Enhancement Programming
|
1
|
|
Health Care
|
3
|
|
Finance
|
3
|
|
Biopharmaceuticals
|
2
|
|
Networking
|
2
|
|
Wireless Communication
|
2
|
|
Bio-Research/Life Sciences/Molecular& Clinical Diagnostic
|
1
|
|
Telecommunication
|
1
|
|
System Software
|
2
|
|
Commercial Activities
|
|
|
Finance
|
2
|
|
Legal
|
1
|
|
Marketing
|
2
|
|
IT Assessments
|
2
|
|
Consultancy
|
|
|
a)Biopharmaceutical
|
1
|
|
b)Medical
|
4
|
|
c)Wireless Communication
|
3
|
|
d)Laptop Accessories
|
2
|
|
e)Business Solutions
|
2
|
Source: Data Generated from Field Survey of IT-Technology Park,
Mohali
Technological innovation is viewed as a fundamental strategy for balanced improvement
in products and creating new innovations and moreover plays a significant role in
creating the employment opportunities for the youth. Table 4 represents the distribution
of employees in the male and female category. In the beginning of IT Park, there
were only 1170 employees out of which 277 and 893 were female and male representatives
respectively. With the expansion of a number of firms in the IT Park the employment
grew and reached to 3447 that include 2350 number of employees of males and 1097
of females.
Table 4, Gender Distribution of Employees in IT Park
|
Year
|
Male
|
Female
|
Total
|
|
2008
|
277
|
893
|
1170
|
|
2009
|
321
|
1111
|
1432
|
|
2010
|
463
|
1451
|
1914
|
|
2011
|
900
|
2147
|
3047
|
|
2012
|
968
|
2165
|
3133
|
|
2013
|
994
|
2252
|
3246
|
|
2014
|
1097
|
2350
|
3447
|
Source: Data Generated from Field Survey of IT-Technology Park,
Mohali.
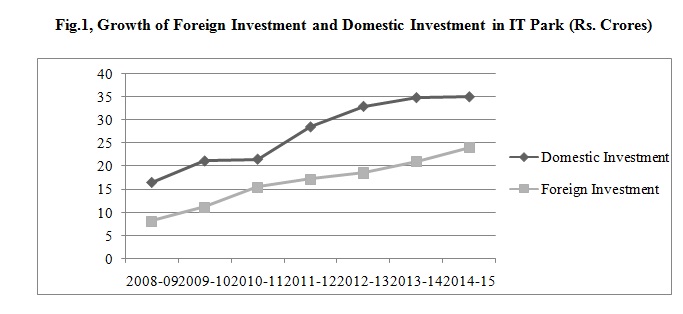
Another dimension of the structure of IT Park is the investment that has been examined
on the basis of the share of investment through domestic and foreign companies.
Fig. shows that in the initial period the share of investment of domestic entrepreneurs
is rising but at the low rate. In the year 2010, a fall in domestic investment has
been observed, because in this year most of the firms operating in the service sector
and these firms required low capital investment as compared to product development
firms. Further throughout the study period, the share of domestic investment is
more as compared to foreign investment. This may be due to reluctance on the part
of entrepreneurs outside the count.
Fig.1, Growth of Foreign Investment and Domestic Investment in IT Park (Rs.
Crores)
Source: Data Generated from Field Survey of IT-Technology Park,
Mohali.
Table 5, reveals the growth of economic components of IT Park. The IT Park Mohali
starts performing in the year 2008 with only twelve firms. With the addition in
the age of IT Park, the number of firms increased to thirty-five till the year 2014.Further
the other components of production, sale, employment also grew substantially throughout
the study period , Nevertheless by the year 2014, the growth of units, employment,
capital investment, production and sale exacerbated to 9.07, 8.69, 7.01,11.40 and
8.8 percent respectively. This growth of IT Park may be due to the clusters benefits
and also the better quality of infrastructure available in IT Park. Monck.et.al
(1988) found that the growth of economic components also depends on upon the age
of organization.
Table 5, Trends in Growth of IT Park, Mohali
|
Year
|
Units
|
Employment
|
Capital Investment
|
Production
|
Sale
|
|
2008-09
|
12
|
1170
|
24.35
|
28.01
|
27.36
|
|
2009-10
|
14
|
1432
|
31.72
|
28.24
|
28.2
|
|
2010-11
|
19
|
1914
|
37.91
|
42.01
|
40.91
|
|
2011-12
|
30
|
3047
|
47.19
|
54.00
|
44.41
|
|
2012-13
|
33
|
3133
|
55
|
74.41
|
72.99
|
|
2013-14
|
35
|
3246
|
58.45
|
89.09
|
87.83
|
|
2014-15
|
35
|
3447
|
61.41
|
109.59
|
108.45
|
|
CAGR
|
9.07
|
8.69
|
7.01
|
11.40
|
8.8
|
Source: Data Generated from Field Survey of IT-Technology Park,
Mohali.
Section II: Economic Contribution of IT Park
The Revenue foregone by the State Government due to Incentives Given to IT Park:
IT units refers to the companies that involve in the activities of IT software design
& development, software maintenance, the operation of software systems, database
management, maintenance of computer networks and telecommunication, network services
and administration, business outsourcing or providing Information Technology Services
through digital communication, remote digital office services etc. The Punjab Government
announced its incentive-based industrial Policy 2013. The industrial policy focuses
on three points: incentives, simplifying procedures, and facilitation. The major
incentives introduced for IT Parks are:
- In the foremost step to make S.A.S Nagar and Amritsar as IT hubs of the state, the
government has announced incentives including 80 percent exemption from VAT, releasing
24-hour power and exemption from payment of electricity duty, exemption from stamp
duty and property tax. The units can avail these incentives for 10 years. (Government
of Punjab, 2013).
- On all IT products 80 percent exemption on CST for 10 years.
- On the purchase of machinery and equipment within the state, paid VAT to be reimbursed
to the units.
- Maximum cumulative quantum of all the incentives will be limited to 80 percent of
fixed capital investment.
- With the maximum cost of Rs 1 Lakh for domestic patent and Rs. 5 Lakh for the international
patent, the government will compensate up to 50 percent of the cost.
Technology Parks are the best institutional mechanism that promotes technology intensive,
knowledge-based SME’s with enormous potential to grow and also construct growth
path for other sectors (Unido, 2012). By offering tax incentives like sales tax,
exemption from stamp duty, electricity duty for the benefits of firms performing
in IT Park the government encourages the entrepreneurship. Different types of tax
revenue foregone are:
Sale Tax Benefits Offered:
Table 6, below represents the tax revenue foregone due to sales tax benefits offered.
The sale of IT products through IT Park is hovering throughout the study period
so as the sale tax. Thus the total sale tax revenue foregone for the study period
is Rs. 82.03 Crores.
Table 6, Tax Revenue Foregone due to Sales Tax Benefits Offered (in Crores)
|
Year
|
Sale
|
Tax Rate (%)
|
Sale Tax
|
|
2009-10
|
28.2
|
0.2
|
5.64
|
|
2010-11
|
40.91
|
0.2
|
8.18
|
|
2011-12
|
44.41
|
0.2
|
8.88
|
|
2012-13
|
72.99
|
0.2
|
14.59
|
|
2013-14
|
87.83
|
0.2
|
17.56
|
|
2014-15
|
108.45
|
0.2
|
21.69
|
|
Total
|
410.15
|
1.4
|
82.03
|
Source: Data Generated from Field Survey of IT-Technology Park,
Mohali.
Income Tax Benefits Offered:
Table 7, below represents the tax revenue foregone due to income tax benefits offered.
The net profit of IT products through IT Park is increasing throughout the study
period so as the income tax. Thus the total income tax revenue foregone for the
study period is Rs. 42.17 Crores.
Table 7, Tax Revenue Foregone due to Income Tax Benefits Offered (in Crores)
|
Year
|
Net Profit
|
Tax Rate (%)
|
Income Tax
|
|
2009-10
|
4.73
|
0.309
|
1.46
|
|
2010-11
|
17.76
|
0.309
|
5.48
|
|
2011-12
|
21.47
|
0.309
|
6.63
|
|
2012-13
|
16.33
|
0.309
|
5.04
|
|
2013-14
|
27.76
|
0.309
|
8.57
|
|
2014-15
|
48.52
|
0.309
|
14.99
|
|
Total
|
136.57
|
1.854
|
42.17
|
Source: Data Generated from Field Survey of IT-Technology Park,
Mohali.
Capital Subsidy Benefits Offered:
Table 8, below represents the revenue foregone due to capital benefits offered.
With the growth of IT Park and offered capital subsidy, the capital investment shows
the tremendous growth. Thus the total revenue foregone for the study period is Rs.87.48
Crores.
Table 8, Revenue Foregone due to Capital Subsidy Offered (Rs. Crores)
|
Year
|
Capital Investment
|
Capital Subsidy (%)
|
Total Capital Subsidy
|
|
2009-10
|
31.72
|
0.3
|
9.51
|
|
2010-11
|
37.91
|
0.3
|
11.37
|
|
2011-12
|
47.19
|
0.3
|
14.15
|
|
2012-13
|
55
|
0.3
|
16.5
|
|
2013-14
|
58.45
|
0.3
|
17.53
|
|
2014-15
|
61.41
|
0.3
|
18.42
|
|
Total
|
291.68
|
1.8
|
87.48
|
Source: Data Generated from Field Survey of IT-Technology Park,
Mohali.
Value Added Tax Benefits Offered:
Table 9, below represents the tax revenue foregone due to VAT benefits offered.
The production of IT products through IT Park is increasing throughout the study
period so as the paid VAT. Thus the total tax revenue foregone for the study period
is Rs. 77.75 Crores.
Table 9, Tax Revenue Foregone due to VAT Benefits Offered (Rs.
Crores)
|
Year
|
Production
|
VAT (%)
|
Tax Paid
|
|
2009-10
|
28.24
|
0.2
|
5.64
|
|
2010-11
|
42.01
|
0.2
|
8.40
|
|
2011-12
|
45.57
|
0.2
|
9.11
|
|
2012-13
|
74.41
|
0.2
|
14.88
|
|
2013-14
|
89.09
|
0.2
|
17.81
|
|
2014-15
|
109.59
|
0.2
|
21.91
|
|
Total
|
388.91
|
1.2
|
77.75
|
Source: Data Generated from Field Survey of IT-Technology Park,
Mohali.
For the promotion of Technology Parks in the state, various incentives have been
offered in different industrial policies of Punjab. Table 10, below represents the
total tax revenue foregone by the government due to incentives offered to IT Park
Mohali. The observation of the table shows that due to tax incentives the foregone
tax revenue has increased from Rs. 22.25 crores to Rs. 283.94 crores. The highest
tax revenue foregone for the capital subsidy incentives given to the firms located
in IT Park amounted to Rs. 87.48 crores and lowest from income tax incentive that
was Rs. 42.17 crores. Though VAT is reimbursed by the government to the firms but
the revenue generated from VAT was Rs. 77.75 before reimbursement.
Table 10, Total Tax Revenue Foregone by the Government due to Incentives to
IT Park (Rs.Crores)
|
Year
|
Sale Tax
|
Income Tax
|
Total Capital Subsidy
|
Tax Paid
|
Total
|
|
2009-10
|
5.64
|
1.46
|
9.51
|
5.64
|
22.25
|
|
2010-11
|
8.18
|
5.48
|
11.37
|
8.40
|
33.43
|
|
2011-12
|
8.88
|
6.63
|
14.15
|
9.11
|
38.77
|
|
2012-13
|
14.59
|
5.04
|
16.5
|
14.88
|
51.01
|
|
2013-14
|
17.56
|
8.57
|
17.53
|
17.81
|
61.47
|
|
2014-15
|
21.69
|
14.99
|
18.42
|
21.91
|
77.01
|
|
Total
|
76.54
|
42.17
|
87.48
|
77.75
|
283.94
|
Source: Data Generated from Field Survey of IT-Technology Park,
Mohali
Relationship between Tax Incentives Offered and Economic Receipts from IT Park:
The Government of India and State Government of Punjab have offered various incentives,
in order to encourage Technology Parks in State. Due to such tax incentives, they
were losing their revenues. The firms in IT Park mitigate the revenue loss by generating
employment opportunities, the sale of IT products and capital investment. For analyzing
the relationship between tax incentives offered to promote IT Park with economic
receipt of IT Park in the form of promoting sales, generating investments and creating
employment opportunities, the Correlation Coefficient was conducted on the study
on the mentioned economic components. The analysis of the table shows that there
is positive and high correlation and also the p-value (0.015, 0.014 and 0.01) is
less than the 5percent level of significance, which leads to the conclusion that
there is a significant relationship between the tax incentive offered and economic
receipt of IT Park in the form of promoting employment, sale of IT Products and
capital investment. Thus the null hypothesis is rejected. Nidheesh (2014), in its
study related to Special Economic Zones has found a high correlation between tax
incentives and economic contribution of SEZ and suggest that the Government should
provide more tax incentives for encouraging growth.
Table 11, Relationship between Tax Incentives Offered and Economic Receipts
from IT Park
|
Particulars
|
Tax
|
Capital Investment
|
Employment
|
Sale
|
|
Pearson Correlation
|
1
|
0.89
|
0.90
|
0.97
|
|
Sig. (2-tailed)
|
|
0.015
|
0.014
|
0.001
|
|
N
|
6
|
6
|
6
|
6
|
Source: Computed from the Data Collected through Field Survey.
Section III: Performance of IT Park, Mohali
The IT Park, Mohali is the cluster of firms and Firm’s performance in IT Park
as a cluster represents the performance of IT Park. Khomiakova (2008), performing
in clusters creates competition and opportunities that help the involved firms to
grow and perform better and fully utilize the available resources in the Technology
Park. The Table below reveals the performances of IT park with the help of performing
firms in the Park and found that majority of the firms in technology parks reported
that their employment has increased during the study period especially for the year
2009 to 2012 and decrease from the year 2013 to 2014. The similar type of increment
has been observed for sale. There was not any increment in the number of firms from
year 2013to 2014, that became a cause for the fall in employment growth. This reveals
that a number of units have played a significant role in the performance of IT Park.
On the other hand, the observed values have shown relatively more profound consequence
on productivity as compared to sale and employment throughout the study period.
the firms has shown increase in employment, sale and productivity and this increment
is highly significant for year 2009 to 2013, as the calculated value of Chi Square
was 28.44,14.64, 35.31, 40.51 and 48.76 respectively which was greater than the
tabulated value of Chi-Square (13.27) at 1 percent level of significance at 4 d.f
and for the year 2014 the calculated value of Chi Square was 10.19 which was greater
the tabulated value of Chi-Square (9.49) at 5 percent level of significance at 4
d.f. Hence we conclude that IT Park Performs significantly in Punjab. Monck,et.al(1998)
has also use various measures to check the performance of firms and conclude that
the performance of firms depends upon the age of Technology Parks.
Table 12, Performance of IT Park, Mohali
For Year 2009
|
Indicators
|
Increase
|
Decrease
|
same
|
|
Employment
|
9
|
5
|
0
|
|
Sale
|
6
|
7
|
1
|
|
Productivity
|
9
|
5
|
0
|
|
|
Indicators
|
Increase
|
Decrease
|
same
|
|
Employment
|
17
|
2
|
0
|
|
Sale
|
10
|
9
|
0
|
|
Productivity
|
11
|
7
|
1
|
For Year 2010
|
|
Indicators
|
Increase
|
Decrease
|
same
|
|
Employment
|
29
|
1
|
0
|
|
Sale
|
23
|
7
|
0
|
|
Productivity
|
16
|
11
|
3
|
For Year 2011
|
For Year 2012
|
Indicators
|
Increase
|
Decrease
|
same
|
|
Employment
|
31
|
0
|
2
|
|
Sale
|
14
|
17
|
2
|
|
Productivity
|
19
|
11
|
3
|
|
For Year 2013
|
Indicators
|
Increase
|
Decrease
|
same
|
|
Employment
|
21
|
14
|
0
|
|
Sale
|
15
|
20
|
0
|
|
Productivity
|
23
|
8
|
4
|
|
For Year 2014
|
Indicators
|
Increase
|
Decrease
|
same
|
|
Employment
|
21
|
14
|
0
|
|
Sale
|
17
|
18
|
2
|
|
Productivity
|
25
|
6
|
4
|
|
Source: Computed from the Data Collected through Field Survey.
Results:
|
Year
|
2009
|
2010
|
2011
|
2012
|
2013
|
2014
|
|
No. of Units
|
14
|
19
|
30
|
33
|
35
|
35
|
|
Chi-Square
|
28.44
|
14.64
|
35.31
|
40.51
|
48.76
|
10.19
|
|
Tabulated Value
|
13.27
|
13.27
|
13.27
|
13.27
|
13,27
|
9.48
|
|
Sig.
|
1%
|
1%
|
1%
|
1%
|
1%
|
5%
|
Note: The results are significant as the calculated values are
greater than the tabulated values.
Policy Implications and Concluding Remarks:
- Technology and innovations perform a significant function of economic growth and
sustainable development to promote manufacturing. In this regard, Technology Parks
would give a new level to the manufacturing sector in creating educated employment
in the economy (Chadha, 2003). Technology Parks has been acknowledged as a congregation
of problems and solutions that are intimately linked with intending for sustainable
development in low and medium income countries. It is considered as an essential
component for edifying infrastructure and generating opportunities and also acts
as a funnel for policy makers in achieving the errands for sustainable development.
The following policy implications are suggested for better performance of IT Park:
- The study found that IT Park is developed in the very small area. For encouraging
the entrepreneurship in state and creating job opportunities for the youth, the
government needs to develop large technology parks. The government should also promote
such type of technological transformation in other sectors like biotechnology, textile
etc.
- The government should create close contiguity with universities and R&D organizations
for promoting technology parks in the region.
- As the tax incentives have a positive relationship with economic receipts of IT
Park, the government should introduce more incentives in its industrial policies
for cheering technology parks.
Bibliography
- Aubert, J.E (2005), “Promoting Innovation in Developing Countries: A conceptual
Framework”, World Bank Policy Research Working Paper 3554, April 2005.
- I, E.Mohamed, Abd.RahimSaad and T.Ramayah (2008), “Determining Technological
Innovation and Competitiveness: A Cross Organizational Analysis of the Malaysian
Manufacturing Industry”, The Asian Journal of Technology Management , Vol.1,
No. 2.
- Chadha, V. & G.Kaur (2012), “Relevance of Technology Parks in the Industrialization
of an Emerging Economy: Some Evidence from Indian States of Punjab”, A Paper
presented at the Third IIMS International Conference on Contemporary Issues in Managing
Development, organized at Bali, Indonesia during November 2011-12.
- Chadha,V. andG.Kaur (2015), “ Trends in Manufacturing Sector Employment in
Punjab-Problems, Prospects and Implications for Industrialization”, Published
in The Indian Economic Journal, December 2015 , 98th Annual Conference
of Indian Economic Association(IEA), held at Centre of Economic and Social Studies,
Begumpet, Hyderabad, during 27-29 December, 2015, ISSN:0019-4662.
- Gatti,G. (2010), “Science and Technology Parks and Innovation Networks as
Strategic Factors for Regional Development” Prague Summer Conference on IP
& Innovation National Technical Library , Prague, Sept 14, 2010.
- Government of Punjab (2013), “Fiscal Incentives for Industrial Promotion-2013”
- Khomiakova,T. “Information Technology Clusters in India”, Transition
Studies Review , Vol. 14, No.2.
- Malairaja, C. and Zawdie.G, “Science Parks and University-Industry Collaboration
in Malaysia”, Technology Analysis & Strategic Management , Vo.20,No.6.
- Mangrio, W., A.Bhutto,& I.Naqvi, “ Contribution of Science and Technology
Parks towards Firms’ Performance in Pakistan”, Mehran University Research
Journal of Engineering & Technology , Vol 32, No. 3, July 2013.
- Monck, C.S., R.B Porter, P.Quintas, & D.Storey (1988),” Science Parks
and Growth of High Technology Firms”, Croom Helm, London.
- Nidheesh,K.B.,(2014), “Relationship between Tax Incentives offered to Cochin
SEZ and Economic Contribution of Cochin SEZ”, Journal of Economic and Social
Development , Vol.XNo.2, December 2014.ISSN-0973-886X
- Unido (2005), “Advising and Monitoring the Planning of Technology Parks”
Conference Report.
- Unido (2012), “Europe and Central Asia Regional Conference on Industrial Parks”,
April 17-18, 2012, Baku Azerbaijan.
- G. (2008), “Technology Parks in Developing Country: The Case of India”,
Journal of Technology Transfer, Vol.33 .
- Vedovello,C., “Science Parks and University-Industry Interaction: Geographical
Proximity between Agents as a Driving Force”, Technovation ,Vol.17,No.9.

