The Impact of Leverage on Shareholders’ Wealth of Automobile Industry in India: An Empirical Analysis
|
Dr. N. S. PANDEY
Assistant Professor
P.G & RESEARCH DEPARTMENT OF COMMERCE
KANCHI MAMUNIVAR CENTRE FOR P G STUDIES
Pondicherry Central University, PUDUCHERRY
|
M. PRABHAVATHI
Doctoral Research Scholar
P.G & RESEARCH DEPARTMENT OF COMMERCE
KANCHI MAMUNIVAR CENTRE FOR P G STUDIES
Pondicherry Central University, PUDUCHERRY
|
ABSTRACT
This paper is to examine the impact of leverage on shareholders’ wealth of Automobile Industry in India. The investigation is conducted on a panel of 12 firms of automobile industry which listed their share in CNX Auto of NSE in India for the period 2003-04 to 20012-13. The impact of leverage on shareholders’ wealth measures Operating leverage (OL), Financial leverage (FL), Combined leverage (CL), on return of capital employed (ROCE), using regression technique. The inferences of the selected sample firms of automobile industry that the simple and multiple regression inferred that Return on Capital Employed (ROCE), Return on Equity (ROE), Return on Debt (ROD), Net worth (NW), Reserve Fund (RF), Borrowings (B), Investment (I) as well as Gross Fixed Assets have significant impact of FL which means that the debt cost is strongly associated with the returns of the firms.
KEYWORDS: Capital Structure, Financial Leverage, Shareholders’ wealth, operating leverage, combined leverage.
JEL Classification: G30, G34, G3, G32.
Introduction
The leverage is used to utilize the fixed cost assets or funds to increase the returns to the owners of the firm. Every firm tries to increase the owner’s wealth and often it is by using fixed cost funds, which are generally available at lower cost. Leverage is the employment of an asset of finance for which firm pays fixed cost/fixed return. Leverage refers to an increased means of accomplishing some purpose. Leverage is used to lifting heavy objects, which may not be otherwise possible. In the financial point of view, leverage refers to furnish the ability to use fixed cost assets or funds to increase the return to its shareholders. In business, leverage is the means of increasing profits. It may be favorable or unfavorable. The former reduces profit, while the latter increases it. Is essentially related to a profit measure, which may be a return on investments or on Earnings Before Taxes (EBT). It is an important tool of financial planning because it is related profits.
Review of Literature
Stein (2001)in a study entitled “An earnings before interest and tax based model of dynamic capital structure” supported the model of dynamic CS strategy of a firm when it has the option to increase debt level in the future. The researcher investigated the contingent cash flows for arbitrary CS strategies and allow management to choose the one that maximizes current shareholders wealth subject to limited liability. Finally it is concluded that the firm has the option to increase future debt levels; tax advantaged to debt increase significantly. Pandey (2002)a study entitled “The capital structure and market power interaction; evidence from Malaysia” examined the relationship between CS and market power using panel data of 208 Malaysian firms from 1994 to 2000 and employed fixed firm and time effects model to account for both individual firms temporal effects and predicated that CS and market power have a cubic relationship. The findings shows that the relationship between CS and profitability because of the interplay of agency costs, costs of external financing and interest tax shield and power that the sizes have a positive influence and growth, risk and ownership have a negative influence on CS. Odit and Hemant (2004)made a study entitled “Does Financial Leverage influence in investment decisions: The case of Mauritian firms” The study primarily focused on the impact of FL on investment decision of firms and it is an attempt to explore the impact of FL on investment levels using firm level panel data in Mauritius. The authors expect to contribute to the existing literature by bringing evidence from a panel data set, which comprised 27 firms, all listed on the stock exchange of Mauritius sampled over a 15 year-period (i.e. from 1990 to 2004). The results reveal a significant negative relationship between leverage and investment. More interestingly, while they found a negative relationship between leverage and investment for low growth firms, their econometric results reveal an insignificant relationship between the two variables for high growth firms. Narender and Abhinar (2006) made a study entitled “Determinants of Capital Structure in Public Enterprises “capital structure policy adopted by the profit making central public enterprises. The study has been conducted for the period 1994-1995 to 2004-2005. It is found that the tangibility of asset influenced the leverage in the price earnings ratios. The results shows that NDTS and TAX lead us to infer that Price earnings are not utilizing debt to pay less tax; price earnings used internal sources for its expansion and financing. It can be used long term sources for short term requirements. Hung and Song (2006) in a study entitled “The determinants of capital structure: Evidence from China” employed a new data base containing the market and accounting data (from 1994 to 2003) for more than 1200 Chinese-listed firms to document CS characteristics. As in other countries, leverage in Chinese firm increases with firms size and fixed assets, and decreases with profitability, non-debt tax shield and growth opportunity. The study also found that the ownership or institutional ownership has no significant impact on CS. Randall and James (2007)a study entitled “Shareholder proposals in the new millennium: Shareholder support, board response, and market reaction” the study has using new data from the 2002–2004 proxy seasons and analysis shows that the shareholder voting patterns on these proposals, board reactions to them, and market responses. The researcher found that some of big changes from earlier periods: many more proposals are receiving majority shareholder support during our sample period relative to earlier studies, and this support has translated into directors implementing more of the actions called for by shareholders. In particular, boards are increasingly willing to remove important anti-takeover defenses, such as the classified board and poison pill, in response to shareholders’ requests, something rarely seen in the past. Despite the increase in support for shareholder proposals and board action in response, we find small and insignificant stock market reaction. Lemmon et al. (2008)in a study entitled “Back to beginning: Persistence and the cross-section of corporate capital structure” noted that traditional leverage determinants explain a minor part of the variation in leverage (at most 30%), while 60% remain unexplained. This variation comes from an unobserved firm-specific time-invariant component that is responsible for persistence in leverage rations over time. As the study focuses on the US economy, which is relatively stable, it is not clear whether leverage rations exhibit a level of persistence when the economic environment rapidly changes over time. Malabika and Jackline (2009)in a study entitled “The determinants of debt ownership structure: some empirical evidence” the main objective of their study was to investigate the relationship between a firm’s debt ownership structure and agency cost, bankruptcy cost, non-tax shield, growth, profitability and collateral value. The study found that the firm that has higher profitability and higher tangibility preferred long- term debt and the short- term debt in emergency, finally and bankruptcy cost associated with debt ownership structure is mainly determinants such as collateral value, profitability and a bankruptcy cost associated with debt ownership structure of selected sample units of this study. Ayesha and Mohamed (2011)made a study entitled “Determinants of Capital Structure decisions case of Pakistani Government owned and Private Firms” the sample of study has Pakistani companies registered on Islamabad Stock Exchange. The sample comprised 91 Pakistani companies out of which companies are private and are government owned covering the period of 1999-2006. Tangibility, size growth rate tax provision, Return on Assets and profitability are used as independent variables, while leverage is the dependent variable. For analysis purpose descriptive statistics, Spearman’s correlation and Regression analysis are used. The result implied that government owned and private companies of Pakistan use different patterns of financing and that government owned companies employ more leverage than private companies. Finally the study has concluded that variables like size do not matter in determination of capital structure of Pakistan companies. Afza and Hussain (2011) described “The determinants of capital structure for a case study of automobile sector of Pakistan” that debt is considered as a way to highlight investors trust on the firm. The higher level of debt shows the confidence of the managers in future cash flows bust another impact of the signaling factor is the problem of underpricing of equity. If a firm issues equity instead of debt for financing its new projects, investors will interpret the signal negatively. The paper used pooled data regression model on the sample of 26 firms of automobile sector of Pakistan the study found that capital structure is negatively correlated with profitability and correlated with taxes. Hubert and Imen(2012)made a study entitled “Ownership structure and debt leverage: Empirical test of as trade-off hypothesis on French firms” debt may help to manage type II corporate agency conflicts because it is easier for controlling shareholders to modify the leverage ratio than to modify their share of capital. The sample of the study conducted on 112 firms listed on the French stock market over the period 1998–2009 is empirically tested. It supports an inverted U-shape relationship between shareholders’ ownership and leverage. Moreover, financial distress will prompt controlling shareholders to reduce the firm’s leverage ratio. Empirically, it is shown that the inflection point where the sign of the relationship between ownership and debt changes is around 40%. Debts may help in curbing private appropriation and appears also as a governance variable. Qigui and Gary (2012) made a study entitle “Controlling shareholder, expropriations and firm's leverage decision: Evidence from Chinese Non-tradable share reform” the study examines the effect of excess control rights on the leverage decisions made by Chinese non-SOEs before and after the Non-tradable share reform (NTS reform). The Chinese listed firms on the market over the period 2004-2010 are empirically tested. The study has found that firms with excess control rights have more excess leverage and their controlling shareholders use the resources for tunneling rather than investing in positive NPV projects and the researcher also find that excess leverage in firms with excess control rights decreases and the market reaction to announcements of related party transactions are more positive after NTS reform. Sachchidanand and Navindra (2012)in a study entitled “Influence of Financial Leverage on Shareholders Return and Market Capitalization: A Study of Automotive Cluster Companies of Pithampur, (M.P.), India” the study measures the Financial leverage of the firm’s exposure to the financial risk. Finding of the shows, out influence of financial leverage of automotive cluster companies on shareholders’ return and market capitalization over the period 2006–2011 is empirically tested. The seven major automotive public companies were undertaken for representation of the cluster. Simple linear regression analysis was carried out to judge the impact of financial leverage on shareholders’ return and market capitalization individually to find out the state of influence of the leverage. Olayinka and Taiwo(2012) in a study entitled “Profitability and leverage: Evidence from Nigerian firms” the study examines the profit profile of firms in Nigeria and analyzes the impact of leverage on profitability for the period 1999-2007. However, when disaggregated into sectors, a few firms actually experienced an increased profit level. The results show that firm size has a significant positive effect on profitability, while leverage has negative effect. The researcher suggests that expansion, increased sales and low debt ratios enhance firm profitability.Ben (2012)in a research paper entitled “The Impact of Financing Decision on the Shareholder Value Creation” the purpose of this paper is to explore an optimal capital structure to maximize the shareholder wealth. Using a sample of French firms introduced on the stock exchange and belonging to SBF 250 index over a period from 1999 -2005. The result shows that the estimation of both empirical models explaining the shareholder value. The equity issue supply’s to explain negatively and significantly the shareholder value for measure. The financial debt contributes to explain positively and significantly the EVA. But it’s negatively related to MVA. Tomas et al. (2012) made a study entitled “The Effects of the Reporting of Off-Balance-Sheet Investments on EPS Uncertainty, Leverage and Shareholders’ Wealth” the study conducted for investor performance of the firm. Uncertainty about operating performance increases following the first Equity Method (EM) reporting of off-balance-sheet investments, but only when the investments are joint ventures (JVs). The sample of 9 firms listed on the over the period 2005–2009 is empirically tested. Partnership JVs report lower levels of debt. These results are not due to informational deficiencies of the EM, but to the riskier nature of JVs. Long-run stock performance analysis indicates that investors experience normal risk-adjusted returns when investing in firms with economically significant off-balance sheet investments. Akinmulegun (2012).This paper empirically examines the effect of financial leverage on selected indicators of corporate performance in Nigeria. In an attempt to juxtapose the earlier findings that were specific of developed nations, econometric technique of Vector Auto Regression (VAR) model was employed. The findings revealed that Leverage shocks exert substantially on corporate performance in Nigeria. In addition, Earnings Per Share (EPS) depends more on feedback shock and less on leverage shock. Leverage shocks on Earnings Per Share indirectly affect the Net Assets Per Share of firms as the bulk of the shocks on the Net Assets Per Share was received from Earnings Per Share of the firms. Leverage therefore significantly affect corporate performance in Nigeria. Thus, theories that are adequate for indigenous macro-economic variables should be developed instead of depending on the structured theories of the advanced developed countries of the world, as these theories cannot be appropriate proxies for advancing the course of the developing nations. Jean and Siham (2013) in a study entitled “Does cross-listing in the US foster mergers and acquisitions and increase target shareholder wealth” the study examine the role of cross-listing in alleviating domestic market constraints and facilitating mergers and acquisitions. The results show that cross-listing allows shareholders of target firms to extract higher takeover premiums relative to their non-cross-listed peers. Moreover, shareholders of Sarbanes–Oxley-compliant targets seem to benefit from a higher premium. The researcher has found that cross-listed firms are more likely to be acquisition targets, consistent with the belief that cross-listing increases firms’ attractiveness and visibility on the market for corporate control. Matemilola et al. (2013) made a study entitled “Impact of Leverage and Managerial Skills on Shareholders’ Return” a sample of the study conducted on 94 firms listed on the Bursa Malaysia over the period 2000–2009 is empirically tested. The recent financial crisis that saw an increase in the risk premium and shareholders’ return around the world is partly caused by the management use of excessive leverage. The study investigates the effect of leverage and managerial skills on shareholders’ return. Our regression analysis that accounts for managerial skill factors reveals that leverage has a positive relationship with shareholders’ return. Similarly, managerial skills have a positive relationship with shareholders’ return. Based on the findings, the study suggests that leverage and managerial skills may be priced in equity valuation.
Statement of the Problems and Significance
Financial Leverage is a final component of Return on Equity (ROE). It is a measure of how much firm uses equity and debt to finance its assets. As debt increased financial leverage also increases. Management tends to prefer equity financing over debt since it carries less risk. When the surplus increases and deficit decreased, the return on the owners’ equity, referred to as a double-edged sword. Financial leverage provides the potentials for increasing the shareholders wealth as well as creating the risks of loss to them. The financial leverage is a prerequisite for achieving optimal capital structure. If value is added from financial leveraging than the associated risk will not have a negative effect.
Period of the Study
Period of the study is 10 years, i.e. from 2003-04 to 2012-13. The data used for analysis relate to the selected firms of Auto Mobile Industry in India for a period of 10 years on a year to year basis ranging from 2003-04 to 2012-13.
Objectives of the study
1) To measure the impact of leverage on shareholders’ wealth in automobile industry in India.
2) To identify the impact of leverage in automobile industry in India.
Hypothesis
H01: There is no significant impact of operating leverage on return on capital employed.
H02: There is no significant impact of financial leverage on return on capital employed.
H03: There is no significant impact of combined leverage on return on capital employed.
H04: There is no significant impact of Financial Leverage on Return capital Employed.
H05: There is no significant impact of Financial Leverage on Return on Equity.
H06: There is no significant impact of Financial Leverage on Return on Debt.
H07: here is no significant impact of combined Leverage on Return on capital Employed.
H08:There is no significant impact of Combined Leverage on Return on Equity.
H09: There is no significant impact of Combined Leverage on Return on Debt.
H010: There is no significant impact of Operating Leverage on Net worth, Reserve Fund, Borrowings, Investment, as well as Gross Fixed Asset.
H011: There is no significant impact of financial Leverage Net worth, Reserve Fund, Borrowings, Investment, as well as Gross Fixed Asset.
H012: There is no significant impact of Combined Leverage Net worth, Reserve Fund, Borrowings, Investment, as well as Gross Fixed Asset.
Regression Model used for Analysis
Regression is a statistical measure that attempts to determine the strength of the relationship between one response variable (usually denoted by Y) and a series of other changing variables (known as predictor variables).
The study used linear regression models such as:
ü OL= a + b (ROCE) + u for testing H01.
ü OL= a + b (ROE) + u for testing H02.
ü OL= a + b (ROD) + u for testing H03.
ü FL= a + b (ROCE) + u for testing H04
ü FL= a + b (ROE) + u for testing H05.
ü FL= a + b (ROD) + u for testing H06.
ü CL= a + b (ROCE) + u for testing H07.
ü CL= a + b (ROE) + u for testing H08.
ü CL= a + b (ROD) + u for testing H09.
Multiple regressions such as:
ü OL= a + b1 (Net worth) + b2 (Reserve fund) + b3 (Borrowings) + b4 (Investment) + b5 (Gross fixed asset) + u for testing H010.
ü FL= a + b1 (Net worth) + b2 (Reserve fund) + b3 (Borrowings) + b4 (Investment) + b5 (Gross fixed asset) + u for testing H011.
ü CL= a + b1 (Net worth) + b2 (Reserve fund) + b3 (Borrowings) + b4 (Investment) + b5 (Gross fixed asset) + u for testing H012.
Analysis of Corporate Leverages
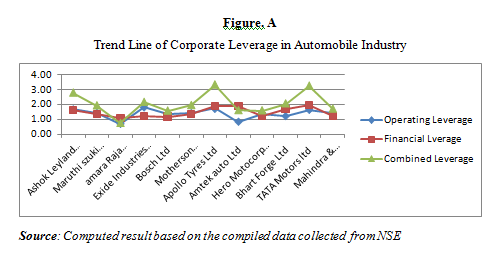
Operating Leverage, Financial Leverage, Combined Leverage of 12 Automobile companies of NSE
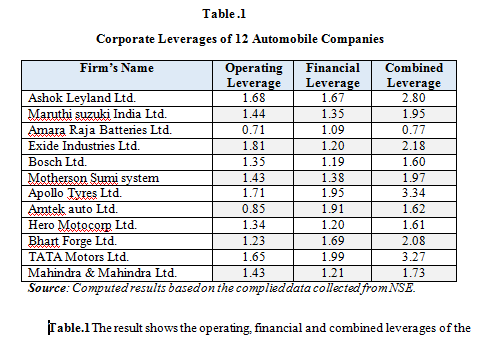
Table.1The result shows the operating, financial and combined leverages of the selected 12 automobile companies in India. Exide Industries Ltd. shows the highest Operating Leverage of 1.81 which means that the sale unit of Exide industries gives more marginal profit. TATA Motors Ltd. shows the highest Financial Leverage of 1.99 which means that TATA Motors Ltd uses high fixed income securities. Apollo tyres Ltd shows the highest Combined Leverage of 3.34 which means that the company earns high profit due to fixed costs.
IV.5.2 Net worth, Reserve fund, Borrowings, Investment and Gross Fixed Asset of 12 Automobile Companies of NSE
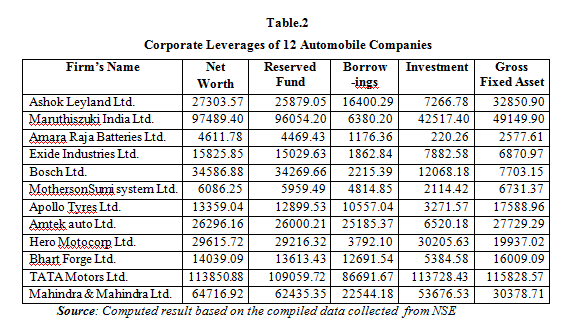
Table .2The result shows net worth, reserve, borrowing, investment, Gross fixed asset of the selected 12 automobile companies in TATA Motors Ltd shows the highest net worth of`. 1,13,850.88 Which means the TATA Motors Ltd has more asset value than its liabilities. TATA Motors Ltd shows the highest reserve fund of`. 1,09,059.72. Ashok Leyland Ltd shows the highest borrowings of`. 16,400.29. Maruthi suzuki India Ltd shows the highest investment of`. 42,517.40. Mahindra& Mahindra Ltd shows the highest gross fixed asset of`. 49,149.90 Which means the Mahindra & Mahindra Ltd to increase price that the individual asset.
Regression analysis
Regression analysis of OL of Automobile Industry
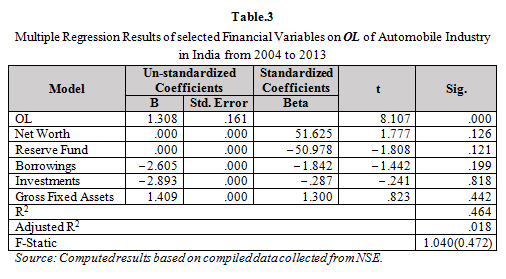
Table.3 The regression result shows that Net worth, Reserve fund, borrowings, Investment, Gross Fixed Asset don’t have impact on OL 0.000, 0.000, – 2.605, – 2.893, and 1.409 respectively. Hence, H010: “there is no significant impact of OL on Net Worth, Reserve Fund, Borrowings, Investments as well as Gross Fixed Assets”. Hence, the null hypothesis is accepted. It is found that the selected variables have no influence on the degree of OL of Automobile Industry in India.
The overall regression model represented by R² is at 46% of the changes in OL. F statistics 1.040 (0.472) is not significant at 5% level, indicating that the variance in the response variable is not significantly explained by the variance in the predictor variable.
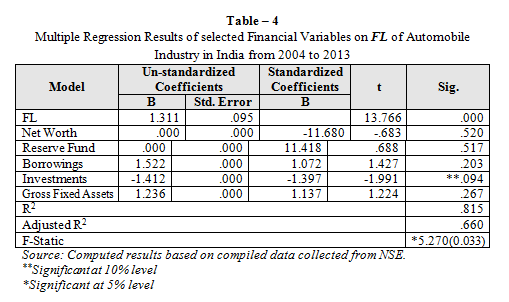
Table .4 The regression result shows that except the variable investment all other variables don’t have significant co-efficient on FL. Hence, H011: “there is no significant impact of Net Worth, Reserve Fund, Borrowings as well as Gross Fixed Assets on FL” is rejected at 10% level for the variable borrowings however the overall results show that the H011is rejected at 5% level. Hence, it is concerned that the investments have influenced the degree of FL of Automobile Industry in India at 10% level of significance with a co-efficient of -1.412.
The overall regression model represented by R² at 81.5% of the changes is influenced in FL. F statistics 5.270 (0.033) is significant at 5% level, indicating that the variance in the response variable is significantly explained by the variance in the predictor variable.
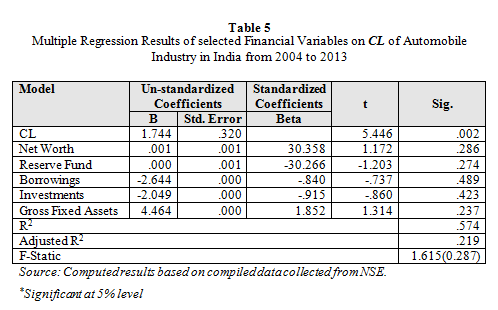
Table.5 The regression result shows that Net worth, Reserve fund, borrowings, Investment, Gross Fixed Asset has non-significant co-efficient of 0.001, 0.000, -2.644, -2.049, and 4.464 respectively on CL Hence, H012: “there is no significant impact of CL on Net Worth, Reserve Fund, Borrowings, Investments as well as Gross Fixed Assets. Hence, it is concerned that the selected variables have no influence on the degree of CL of Automobile Industry in India.
The overall regression model represented by R² is at 57% of the changes in CL. F statistics 1.615 (0.287) is significant at 5% level, indicating that the variance in the response variable is not significantly explained by the variance in the predictor variable.
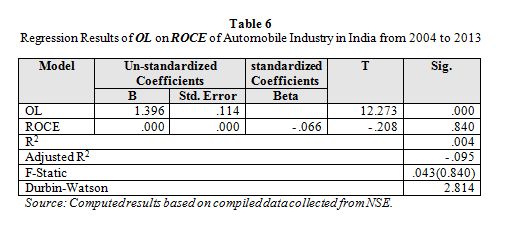
Table.6 The regression result shows that there is no significant impact of OL on ROCE in Automobile industry in India. Hence, H01: “there is no significant impact of O Lon ROCE” is accepted with adjusted R² of –0.095. The overall regression model represented by R² at 0.4% explains the changes in ROCE due to OL is 0.4%. F statistics 0.043 (0.840) is not significant indicating that the variance in the response variable is not significantly explained by the variance in the predictor variable.
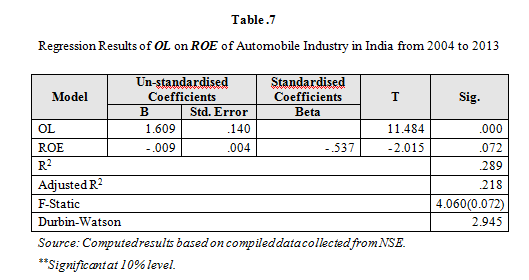
Table7.The regression result shows that there is a significant impact of OL on ROE in Automobile industry in India. Hence, H02: “there is no significant impact of OL on ROE” is rejected at 10% level; with adjusted R² 0.22. The overall regression model represented by R² is at 28.9% of OL changes in ROE. F statistics 4.060 (0.072) is significant at 10% level, indicating that the variance in the response variable is significantly explained by the variance in the predictor variable.
OL=1.609 + (-0.009) ROE, taking OL as dependent variable and ROE as independent variable
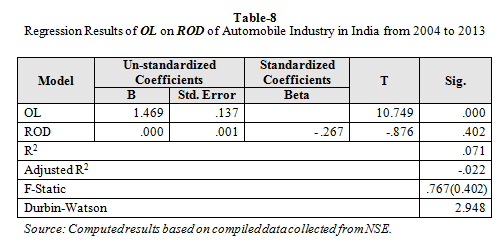
Table.8 The regression result shows that there is no significant impact of OL on ROD in Automobile industry in India. Hence, H03: “there is no significant impact of OL on ROD” is accepted with adjusted R² (-0.02). The overall regression model represented by R² is at 7.1% of the changes in ROD. F statistics 0.767 (0.402) is not significant indicating that the variance in the response variable is not significantly explained by the variance in the predictor variable.
OL=1.469 + 0.000 ROD, taking OL as dependent variable and ROD as independent variable.
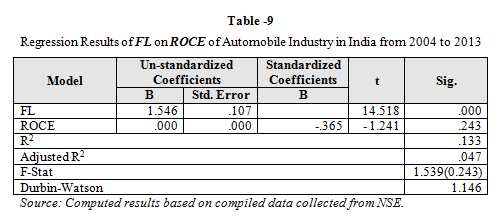
Table .9 The regression result shows that there is no significant impact of FL on ROCE Hence, H04: “there is no significant impact of FL on ROCE” is accepted with adjusted R² 0.047. The overall regression model represented by R² is that FL has 13.3% of the changes in ROCE. F statistics 1.539 (0.243) is not significant indicating that the variance in the response variable is not significantly explained by the variance in the predictor variable.
FL=1.546 + 0.000 ROCE, taking FL as dependent variable and ROCE as independent variable.
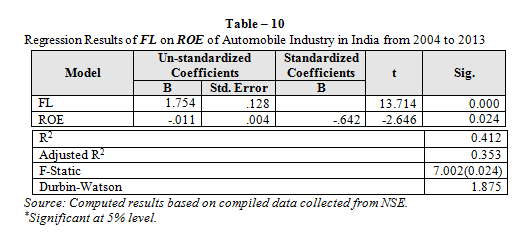
Table .10 The regression result shows that FL has significant negative co-efficient (-0.011) on ROE in Automobile industry in India. Hence, H05: “there is no significant impact of FL on ROE” is rejected at 5% level; with adjusted R² of 0.353. The overall regression model represented byR² is that FL has 41.2% of the changes in ROE. F statistics 7.002 (0.024) is significant at 5% level, indicating that the variance in the response variable is significantly explained by the variance in the predictor variable.
FL=1.754 + (-0.011) ROE, taking FL as dependent variable and ROE as independent variable.
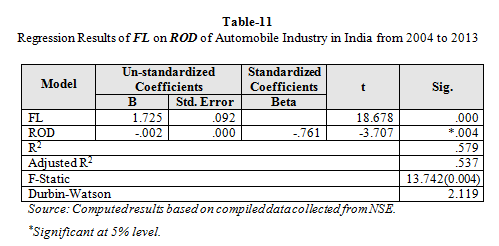
Table.11 The regression result shows that FL has significant impact on ROD in Automobile industry in India. Hence, H06: “there is no significant impact of FL on ROD” is rejected at 5% level; with adjusted R² of 0.537. The overall regression model represented by R² is that 57.9% of the changes happen in ROD by FL. F statistics 13.742 (0.004) is significant at 5% level, indicating that the variance in the response variable is significantly explained by the variance in the predictor variable.
FL=1.725 + (-0.002) ROD, taking FL as dependent variable and ROD as independent variable.
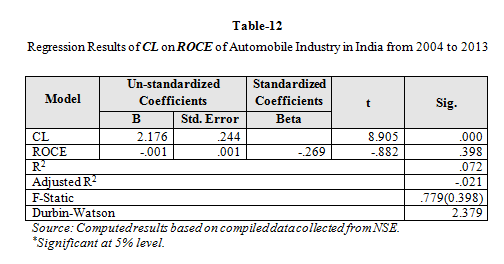
Table12. The regression result shows that there is no significant impact of CL on ROCE (F.0.779) Hence, H07: “there is no significant impact of C Lon ROCE” is accepted at 5% level; with adjusted R² of -0.021. The overall regression model represented by R² is at 7.2% of the changes in ROCE. F statistics 0.779 (0.398) is not significant indicating that the variance in the response variable is not significantly explained by the variance in the predictor variable.
CL=2.176 + (-0.001) ROCE, taking CL as dependent variable and ROCE as independent variable.
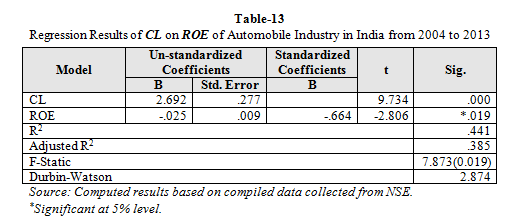
Table.13 The regression result shows that there CL has significant impact on ROE. Hence, H08: “there is no significant impact of CL on ROE” is rejected at 5% level; with adjusted R² of 0.385. The overall regression model represented by R² is at 44.1% of the changes in ROCE. F statistics 7.873 (0.019) is significant at 5% level, indicating that the variance in the response variable is significantly explained by the variance in the predictor variable.
CL=2.692 + (-0.025) ROE, taking CL as dependent variable and ROE as independent variable.
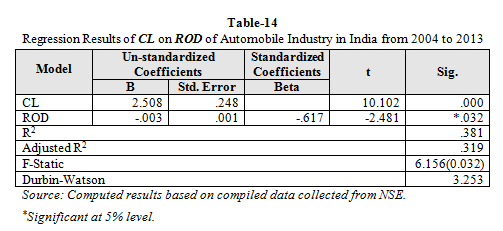
Table.14 The result shows that CL has significant impact on ROD. Hence, H09: “there is no significant impact of CL on ROD” is rejected at 5% level; with adjusted R² of 0.381. The overall regression model represented by R² is at 38.1% of the changes in CL. F statistics 6.156 (0.032) is significant at 5% and level, indicating that the variance in the response variable is significantly explained by the variance in the predictor variable.
CL=2.508 + (-0.003) ROD, taking CL as dependent variable and ROD as independent variable.
Findings of the Study
The analysis of the study has been the first part of the analysis deals with the study of descriptive statistics of the selected corporate leverages and the second part of the analysis gives focus on the regression model. As under:
Ø Exide Industries Ltd. shows the highest Operating Leverage of `. 1.81 among the selected 12 automobile companies in India which means that the sale unit of Exide industries gives more marginal profit.
Ø TATA Motors Ltd. Shows the highest Financial Leverage of `. 1.99 among the selected 12 automobile companies in India which means that TATA Motors Ltd. uses high fixed income securities.
Ø Apollo tyres Ltd shows the highest combined Leverage of `. 3.34 among the selected 12 automobile companies in India which means that the company earns high profit due to fixed costs.
Ø Net worth, reserve, borrowing, investment, Gross fixed asset of the selected 12 automobile companies in TATA Motors Ltd shows the highest net worth of
`. 1,13,850.88 among the selected 12 automobile companies in India which means the TATA Motors Ltd has more asset value than its liabilities. TATA Motors Ltd shows the highest reserve fund of `. 1, 09,059.72 among the selected 12 automobile companies in India.
Ø Ashok Leyland Ltd shows the highest borrowings of`. 16,400.29 among the 12 automobile companies in India.
Ø Maruthi Suzuki India Ltd shows the highest investment of`. 42,517.40 among the 12 automobile companies in India.
Ø Mahindra & Mahindra Ltd shows the highest gross fixed asset of `. 49,149.90 among the selected 12 automobile companies in India which means the Mahindra & Mahindra Ltd to increase price that the individual asset.
Suggestions of the Study
Ø Hence, irrespective of the firms as automobile industry in India should improve their operating performance so as to overcome their operating risk and financial risk maintaining by tolerable or manageable level of fixed cost.
Ø The FL shows impacted by all financial variables which clearly explains that the fixed cost relating to debt portion in the CS has to be determined with utmost care by not putting down the shareholders interest. The FL of Amara Raja Batteries, Apollo Tyres, Armtek auto, Bharat Forge, TATA Motors are higher than their OL which reveals that the financial risk is higher in these firms and firms like Ashok Leyland, Maruthi Suzuki India, Exide Industries, Bosch, Motor Sumi system, Hero Motocorp, Mahindra & Mahindra are higher than their FL that its FL revealing that the firms may suffer operating risk.
Limitations of the Study
Ø Determinants of leverage in Automobile industry could be better observed if more number of firms of automobile industry is considered as sample. The present study is limited to 12 firms of Automobile industry listed in NSE only for want of full-fledged data over the study period.
Ø Originally, it was decided to carry out the study on all the firms listed in NSE, covering a period 10 years i.e. 2003-04 to 2012-13. Considering the full-fledged availability of required data, however, it was found that the data were available for 12 firms only, Therefore, sample of 12 firms of automobile industry constitute the final sample.
Ø The study is based on secondary data. Therefore, the quality of the study depends purely upon accuracy, reliability and quality of the secondary data source.
Scope for Further Studies
In the study, a sample of 12 automobile firms has been considered for analysis the future; the researchers can consider more firms to take up a study with large sample to explore more possible results. In the study, simple regression, and multiple regression are only used for analysis, therefore analysis by use of appropriate advanced models may bring a differing inference. Attempts to categories the corporate firms into small medium and large based on total sales EBIT etc. which may categories the selected firms into various size classes and may bring a differing inference. The study considered only firm’s automobile industry and so future researchers can take up other industries in India.
References
Stein, R.G. (2001). An Earnings before Interest and Tax based Model of Dynamic Capital. The Journal of Business.74 (4): 483-512.
Pandey, I.M. (2002). Capital Structure and Market Power Interaction: Evidence from Malaysia .The Capital Market Review. 10(1):23-40.
Odit, M and Dhemant, (2004). Does Financial Leverage Influence in Investment Decisions? The case of Mauritian firms.The Journal of Business. 4(12): 49-60.
Narender, Vanyale and Abhinar, Sharma (2006).Determinants of Capital Structure in Public Enterprises.Journal of Applied Finance.12 (7): 60-80.
Huang, G., M. F. Song. (2006). The Determinant of Capital Structure: Evidence from China. China Economic Review. 17(1): 14-36.
Lemmon, M. L., M. R. Roberts, and J. F. Zender. (2008). Back to the Beginning: Persistence and the Cross-Section of Corporate Capital Structure. The Journal of Finance. 63(4): 1575-608.
MalabikaDeo and Jackline .S (2009).The Determinants of Debt Ownership Structure: Some Empirical Evidence .Indian Journal of Finance. 34(3): 22-27.
Ayesha Mazhar and Mohamed Nasr, (2011).Determinants of Capital Structure Decisions case of Pakistani Government Owned and Private Firms. .Journal of corporate finance. 2(10): 219-30.
Afza, T and A.Hssain, (2011). Determinants of Capital Structure: A Case Study of Automobile Sector of Pakistan. Journal of Contemporary Research in Business. 2(10): 219-30.
Hubert de La Bruslerie and ImenLatrous (2012). Ownership structure and Debt Leverage: Empirical test of a Trade-off hypothesis on French firms. Journal of Multinational Financial Management.22(8): 111– 30.
Qigui Liu, Gary Tian (2012). Controlling Shareholder, Expropriations and firm's Leverage Decision: Evidence from Chinese Non-tradable share reform.Journal of Corporate Finance. 18(2): 782–803
CA Sachchidan and Pachori, Dr. Navindra K. Totala (2012).Controlling Shareholder, Expropriations and Firm's Leverage Decision: Evidence from Chinese Non-tradable Share Reform.Influence of Financial Leverage on Shareholders Return and Market Capitalization: A Study of Automotive Cluster Companies of Pithampur, (M.P.), India. International Conference on Humanities, Geography and Economics. 12(2): 28-29.
OlayinkaAkinlo and TaiwoAsaolu, (2012). Profitability and Leverage: Evidence from Nigerian firms.Global journal of business research. 6(1):17-25.
Ben Amor Atiyet (2012). The Impact of Financing Decision on the Shareholder Value Creation.Journal of Business Studies Quarterly.4(1): 44-63.
Tomas Mantecon, James Conover, AcyaAltintig, and Kyojik Song, (2012).The Effects of the Reporting of Off-Balance-Sheet Investments on EPS Uncertainty, Leverage and Shareholders’ Wealth.Financial Management. 57(1):1009 – 42.
Akinmulegun (2012).The Effect of Financial Leverage on Corporate Performance of Some Selected Companies in Nigeria Canadian Social Science Vol. 8(1): 85-91
Jean-Claude Cosse, and SihamMeknassi (2013). Does Cross-Listing in the US Foster Mergers and Acquisitions and Increase Target Shareholder Wealth? Journal of Multinational Financial Management. 23(5): 54– 73.
KhaledAmira, Kose John, AlexandrosPrezas, and Gopala K. Vasudevan.Leverage, Governance and Wealth Effects of Asset Purchaser.(2013). Journal of Corporate Finance. 22(6): 209–20.
Matemilola, B.T, Bany-Ariffin, A.N and Azman-Saini, W.N.W. (2013).Impact of Leverage and Managerial Skills on Shareholders’ Return.Procedia Economics and Finance. 7 (3): 103 – 15.

