A Refereed Monthly International Journal of Management
EmotionalIntelligence and Attitude towards Work of Teachers: A Performance Improvement Model
|
Mrs M. Suvarchala Rani
(Research Scholar – Gitam University, India)
Assistant Professor
Bhavan’s Vivekananda College of Science, Humanities and Commerce
Sainikpuri, Secunderbad TS, India
Contact No.- +91 - 9177554053
Email: skorapole@yahoo.com
|
Dr. U. Devi Prasad
Associate Professor
Research Guide
Gitam University, India
Contact No.- +91 - 9032225988
Email: udeviprasad@gitam.in
|
Respected Sir,
We wish to submit our manuscript entitled, "EmotionalIntelligence and Attitude towards Work of Teachers: A Performance Improvement Model".
Enclosed is a manuscript to be considered for publication in Pacific Business Review International. The research reported in this manuscript has been self- funded.
We confirm that this work is original and has not been published elsewhere nor is it currently under consideration for publication elsewhere.
The paper should be of interest to readers in the areas of Human Resource Management. The present paper tries to identify the various factors that affect the Emotional Intelligence of teachers in the higher education field, and explore the factors that influence the attitude towards their work. It aimed to evolve a model to improve the performance of the teachers in the institution. The study uses valid statistical tools including factor analysis and regression method to analyze the data.
The findings of the research paper would support the teachers and organizations in enhancing their performance, through organizing various programs for personal development and Emotional Intelligence.
Please address all correspondence concerning this manuscript at skorapole@yahoo.com.
Thanking You,
Yours Sincerely,
Mrs M. Suvarchala Rani
(Research Scholar – Gitam University, India)
Assistant Professor
Bhavan’s Vivekananda College of Science, Humanities and Commerce
Sainikpuri, Secunderbad TS, India
skorapole@yahoo.com
Dr. U. Devi Prasad
Associate Professor
Research Guide
Gitam University, India
udeviprasad@gitam.in
91 - 9032225988
Abstract
Educational sector has metamorphosed to equip with the required challenges and changes. Quality of teachers is the most important criterion for success of the educational sector. In the educational process the crucial driver is teacher-student association. Teacher as a role model plays an important role in shaping a student’s personality. Emotional intelligence (EI) has evolved as a remarkable component to build a congenial atmosphere in educational institutions, especially in high schools, colleges (affiliated and autonomous), universities and the society at large.
EI can be defined as the ability to monitor one’s own as well as other’s emotions and feelings and to utilize the same information to direct one’s thinking and actions. EI is a union of emotions and intelligence. Both the abilities work simultaneously creating a huge impact on both personal and professional lives. EI makes a meaningful contribution for better understanding of people and the effective utilization of their potential for their overall growth and success. The present paper tries to identify the various factors that are associated with the traits of EI of teachers in the higher education field, and find out the factors that influence the attitude towards their work. With the resulting output, it is aimed to evolve a model to facilitate improving the performance of the teachers in their work situation. The study uses valid statistical tools including factor analysis and regression method to analyse the data.
The findings of the research paper indicate that EI of the teacher is significantly related to the teacher’s positive attitude towards work. In order to raise the level of the teachers’ work involvement it could be possible to enable them to improve their level of EI and be more confident and successful both personally and professionally. The study is considered to aid the teachers and organizations in enhancing their performance, through organising various programmes for personal development and EI.
Key Words: Emotional intelligence, attitude, personal and professional development, performance.
ntroduction
The 21st century has a growing focus on knowledge there is a need for educational sector to get equipped with the requisite challenges and changes. Success of the educational sector depends upon the quality of teachers. The relationship between a student and a teacher is vital in the educational process. Teachers play a vital role in shaping the personality of students. They should display high levels of Emotional Intelligence (EI) to create positive atmosphere in educational institutions and the society at large.
Probe into emotional competencies of people in terms of their impact on performance in work situations has gained wide popularity and interest in academic research when compared to the focus on traditional attributes like intellectual ability and personality in general. EI deals with one’s ability to understand emotions and feelings of self as well as emotions of others successfully. An individual’s EI helps in all areas of life in terms of awareness of one’s own emotions as well as handling and managing various relationships. A scientific method of
understanding of emotions of human mind helps in enhancing the quality of modern education system.
The concept of EI has been defined in various ways. Salovey and Mayer (1990) have described it as the ability to monitor one’s own as well as other’s emotions and feelings and to utilize the same information to direct one’s thinking and actions. Later, Daniel Goleman (1995) defined EI as the capability of identifying one’s own feelings as well as of others, to motivate and manage feelings and emotions considerably well in oneself as well as with others. Goleman (2002) has studied group competencies that come under four categories viz., Self-Awareness (knowledge of one’s own emotions, strengths, areas of improvement), Self-Management (managing one’s own emotions), Social Awareness (ability to understand emotions and needs of others i.e., society in general and Relationship Management (capability to establish relationships with others).
EI is an amalgamation of emotions and intelligence. It is a scientific method of filling the gap between mind or intelligence as well as heart or emotions. The alliance of individual emotions plays a significant role in deciding one’s own achievement and success. Both the abilities work in unison and create a huge impact in both personal and professional lives. EI can make a meaningful contribution for better understanding of people and the effective utilization of their potential for their overall growth and success.
A review of the literature on the subject of EI and the related attributes has revealed that only very few studies have been conducted on EI of teachers in India, particularly at higher education level. There seems to be a research gap in terms of an integrated approach in dealing with the concepts and attributes concerning EI. The studies devoted to the teachers in the field of higher education are found to be relatively less needing further additions to the literature. Further, higher education needs development of requisite skills in teachers with a regular upgradation in the context of the changing dynamics in this field. More so, the studies on EI and its relation to the attitude of teachers towards work are limited. In this context, a study of the EI of teachers at a higher educational institution, the related attributes, and the effectiveness of EI on performance in work situation, assumes major importance. Such a study is considered to contribute directly or indirectly towards quality improvement of higher education which is of great concern at present.
Keeping theses research gaps in view, the present study focuses on EI and its impact on the attitudinal factors, taken up in an integrated manner, on the work of the teachers, in the field of higher education. It is also attempted to develop a performance improvement model which benefits the teachers as well as the organizations in which they work, when applied in a concentrated manner. The study undertaken has statistical validity in terms of sample size and the tools used for analysis of the data. The scope of the study is confined to teachers of higher education in Hyderabad in Telangana State, India.
The objectives of the study have been set as: (a) to analyse the demographic characteristics of the select sample of teachers; (b) to identify the latent factors concerning emotional intelligence of the teachers selected; (c) to find out the relationship between the attitude of the sample of teachers towards their work and the EI factors; and (d) to evolve a model of performance improvement for the teachers in higher education field, based on the results of the study.
The research hypotheses have been formulated, keeping in view the objectives of the study, thus: (a) The attributes, having a bearing on the emotional intelligence of the teachers, have latent and interdependent factors associated with them; and (b) there is a significant relationship between attitude towards work of the teachers and their emotional intelligence.
For the study, a random sample of 70 teachers, working in a higher educational institution (teaching Under-graduate and Post-graduate students), located in Hyderabad, India were approached. Responses were received from 63 teachers which constituted the final sample. A structured questionnaire was administered for collection of data. Statistical tools, viz., descriptive statistics, factor analysis and regression analysis, were used in the study by applying SPSS 20 software package.
As for the succeeding structure of the study, Section 2 deals with a review of the existing literature on the subject. In Section 3, EI and related attributes have been analysed. Section 4is devoted to the development of the EI Model for Performance Improvement. Section 5gives the concluding observations.
Review of Literature
The literature has a wide range of studies dealing with the concept of EI and its relationship with various demographic factors and personality traits. There are a few studies concerning EI of some groups of people or employees such as students, teachers and other employees and the impact of EI on their performance in work situations, including academic institutions.
The ability model of EI has been applied in both educational and workplace setting. People with high Emotional intelligence function both intra-personally and interpersonally in both academic and workplace settings (Brackett, M. A., Rivers, S. E., & Salovey, P., 2009).
The emotional intelligence of secondary teachers was found to be low. (Pathan Young, and Yunus, G. 2004; Tyagi, S.K., 2004). Regarding demographic factors and the relationship to EI, in the case of B. Ed. teacher-trainees, it was found that the type of institution, gender, religion and age have significant influence on their EI. On the other hand, occupation of the family, income, degree at first level, type of management of the institution, entertainment, and community have no significant impact on EI (Gowdhaman, K., and Bala Murugan, M., 2010). The place of stay of the teachers did not have any influence on their EI (Edannur S., 2010).
It was observed that Emotional intelligence of trainee–teachers had no significant association between the EI and general intelligence as well as academic achievement of trainee-teachers (Vandana Jadhav, and Ajaykumar Patil, 2010). The trainee-teachers with low EI are more worried and uneasy about future, unhappy failures and feeling are irregular, less cautious, like to rest more, have lack of energy and restrain others. Trainee-teachers with high EI are more self-confident, competent, hardworking, energetic, help others, motivated, and full of enthusiasm (Upadhyaya, P., 2006). The best teachers were found to be caring, helpful and knowledgeable, and the effectiveness of teachers depends upon their knowledge, communication skills, organization of the material, motivating and inspiring students and being friendly and open to them, and classroom management. The teachers with high competency, feeling comfortable in work, empathy, leadership, self-esteem, and EI skills perform better in teaching effectively (Hwang, F.F., 2007). Successful people possess high degrees of interpersonal intelligence which is a significant attribute of EI (Goleman, D., 1995).
The teachers working in private institutions had more emotional awareness, impulse control and flexibility skills. The male teachers had more interest in getting into thinking-modes whereas female teachers had more interest towards personality-related issues (Amritha, M and Kadhiravan M., 2006).
There is a significant association between EI skills and dynamic leadership, success in the workplace and satisfying personal life experiences. This led to the introduction of EI competencies in university curriculum to acquaint students with EI skills. The university educators have to incorporate and coach with regard to EI skills of the students (Kautish, P., 2010).
The work mentality comprises attitudes, ideas and values related to work, being a synthesis among the community vision and the individual vision (Constantin, Ticu, 2004). The teachers’ work mentality would express their attitudes towards work, and the way they see the work, as an accomplishment. EI and self-efficacy of the teachers should be concentrated upon to enhance their work attitudes (Salami, S. O., 2007).
Overall, the literature has primarily studies relating to the concept of EI and its relationship with various attributes of people or teachers-trainees or teachers or other employees. These attributes are studied mostly in isolation such as demographic factors, or personality characteristics. Hence there is a dire need to study the emotional intelligence of higher educational teachers in relation to their attitude towards their work on which the present study focuses.
EI and Related Attributes
The responses have been obtained from the sample of teachers using mostly the Likert scale with labels. For analysing the data, its reliability needs to be tested for internal consistency. This is done using Cronbach’s alpha which is found to be .852. This value, being above 0.7, is acceptable (Nunnally 1978). Thus, the responses are considered as internally consistent.
To start with the demographic factors of the sample of higher education teachers are analysed. Next, it is attempted to identify the underlying factors concerning EI and the attitude of teachers towards their work is probed into. Based on the findings, an EI model has been developed for using it as a means to improve the performance of the teachers in higher educational institutions.
1. Demographic Factors
A glance at the data on the demographic factors (Table 1) reveals that out of the total sample of 63 higher education teachers, 18(28.6%) constitute male members while the rest of 45 (71.4%) comprise female teachers. Thus, majority of the sample represented female teachers.
Regarding age, the distribution of the teachers is relatively skewed towards the younger group with 16 (25.4%) in the age group of below 30 years, and 17 (27.0%) in the age group of 30-39 years. The modal age group is 40-49 years with 20 (31.7%) members belonging therein. A small number of 10 teachers (15.9%) are in the age group of 50 years and above.
The data on experience of teachers indicates that, majority of the respondents i.e. 29 (46.0%) have less than 5 years of experience, and 11 (17.5%) belong to the group of 5-9 years of experience. Out of remaining members, 16 (25.4%) have 10-14 years of experience, 4 (6.3%) have 15-19 years of experience and 3 (4.8%) possess experience of 20-24 years.
An analysis of the designations of the respondents shows that two-thirds of them i.e. 42 (66.7%) are Lecturers, 12 (19.0%) are Assistant Professors. The others are a smaller number of 4 (6.3%) Associate Professors, 2 (3.2%) Professors and 3 Programmers. Among these, 57 (90.5%) are on full-time and the balance of 6 (9.5%) are on part time basis.
Table1: Frequency distribution of Demographic Factors
|
S. No
|
Variable
|
Category
|
Frequency
|
Percent
|
|
1
|
Gender
|
Male
|
18
|
28.6
|
|
Female
|
45
|
71.4
|
|
Total
|
63
|
100.0
|
|
2
|
Age
|
<30
|
16
|
25.4
|
|
30-39
|
17
|
27.0
|
|
40-40
|
20
|
31.7
|
|
50 and Above
|
10
|
15.9
|
|
Total
|
63
|
100.0
|
|
3
|
Experience
|
<5
|
29
|
46.0
|
|
5-9
|
11
|
17.5
|
|
10-14
|
16
|
25.4
|
|
15-19
|
4
|
6.3
|
|
20-24
|
3
|
4.8
|
|
Total
|
63
|
100.0
|
|
4
|
Designation
|
Professor
|
2
|
3.2
|
|
Associate Professor
|
4
|
6.3
|
|
Assistant Professor
|
12
|
19.0
|
|
Lecturer
|
42
|
66.7
|
|
Programmer
|
3
|
4.8
|
|
Total
|
63
|
100.0
|
|
5
|
Employment Status
|
Full Time
|
57
|
90.5
|
|
Part Time
|
6
|
9.5
|
|
Total
|
63
|
100.0
|
2. EI and the Attributes
The responses given by the teachers numbering 63, to each of the 20 attributes of the EI considered for the study (Table 2), on the average, lie between 3.35 and 4.73, indicating that the teachers possess well these attributes within them. The variation in their responses is in the range of 0.45 to 1.11, reflecting consistency in the responses.
.
Table 2: Attributes – Mean and Standard Deviation
|
Attributes
|
Mean
|
Std. Deviation
|
|
VAR00001
|
4.25
|
1.02
|
|
VAR00002
|
4.08
|
.66
|
|
VAR00003
|
4.41
|
.87
|
|
VAR00004
|
3.78
|
.79
|
|
VAR00005
|
3.35
|
1.11
|
|
VAR00006
|
4.02
|
.98
|
|
VAR00007
|
4.08
|
.79
|
|
VAR00008
|
4.33
|
.97
|
|
VAR00009
|
3.87
|
.92
|
|
VAR00010
|
3.76
|
.78
|
|
VAR00011
|
4.03
|
.65
|
|
VAR00012
|
3.98
|
.68
|
|
VAR00013
|
3.95
|
.63
|
|
VAR00014
|
4.21
|
.72
|
|
VAR00016
|
4.33
|
.67
|
|
VAR00017
|
4.10
|
.91
|
|
VAR00018
|
3.89
|
.70
|
|
VAR00019
|
4.21
|
.85
|
|
VAR00020
|
4.73
|
.45
|
|
VAR00021
|
4.48
|
.69
|
The numbers of attributes, having a bearing on the EI of the teachers, is quite large and are reduced herein into a smaller and manageable number of latent and interdependent factors associated with them, by using exploratory factor analysis (EFA) method. This facilitates determining the underlying structure of EI. To validate the use of factor analysis, Kaiser-Meyer-Olkin (KMO) measure of sampling adequacy is found. Table 3 shows this value as 0.689, and being more than 0.5 it indicates multivariate normality among the original variables (Naresh Malhotra, 2011).
Table 3: KMO and Bartlett's Test
|
Kaiser-Meyer-Olkin Measure of Sampling Adequacy
|
.689
|
|
Bartlett's Test of Sphericity
|
Approx. Chi-Square
|
495.346
|
|
Df
|
190
|
|
Sig.
|
.000
|
The null hypothesis that ‘The variables taken into account for the study are uncorrelated’ is tested by using the Bartlett’s Test of Sphericity. The result, given by the chi-square statistic, shows the value of 495.346, with 190 degrees of freedom and significant value approximating to 0.000. Thus, the null hypothesis is rejected at 0.05level of significance, and it is concluded that the variables taken into account for the study are correlated, paving the way for the use of factor analysis. Further, the correlation matrix (Table 4) did not indicate any correlation (rvalue) greater or equal to 0.8 among the attributes of the study, which depicts that there is no multicollinearity issue in the factor structure.
Table 4: Correlation Matrix
|
|
V1
|
V2
|
V3
|
V4
|
V5
|
V6
|
V7
|
V8
|
V9
|
V10
|
V11
|
V12
|
V13
|
V14
|
V15
|
V16
|
V17
|
V18
|
V19
|
V20
|
|
V1
|
1
|
|
|
|
|
|
|
|
|
|
|
|
|
|
|
|
|
|
|
|
|
V2
|
.09
|
1
|
|
|
|
|
|
|
|
|
|
|
|
|
|
|
|
|
|
|
|
V3
|
.43
|
.40
|
1
|
|
|
|
|
|
|
|
|
|
|
|
|
|
|
|
|
|
|
V4
|
.17
|
.10
|
.30
|
1
|
|
|
|
|
|
|
|
|
|
|
|
|
|
|
|
|
|
V5
|
.34
|
.12
|
.25
|
.16
|
1
|
|
|
|
|
|
|
|
|
|
|
|
|
|
|
|
|
V6
|
.44
|
.05
|
.33
|
.13
|
.47
|
1
|
|
|
|
|
|
|
|
|
|
|
|
|
|
|
|
V7
|
.12
|
.18
|
.05
|
.16
|
.04
|
.10
|
1
|
|
|
|
|
|
|
|
|
|
|
|
|
|
|
V8
|
.21
|
.24
|
.12
|
.27
|
.03
|
.22
|
.35
|
1
|
|
|
|
|
|
|
|
|
|
|
|
|
|
V9
|
.57
|
.23
|
.29
|
.01
|
.22
|
.31
|
.24
|
.16
|
1
|
|
|
|
|
|
|
|
|
|
|
|
|
V 10
|
.33
|
.01
|
.05
|
.10
|
.10
|
.13
|
.11
|
.13
|
.47
|
1
|
|
|
|
|
|
|
|
|
|
|
|
V 11
|
.45
|
-.01
|
.23
|
.14
|
.16
|
.13
|
-.04
|
.03
|
.39
|
.50
|
1
|
|
|
|
|
|
|
|
|
|
|
V 12
|
.29
|
.11
|
.39
|
.14
|
.20
|
.56
|
.24
|
.11
|
.18
|
.05
|
.15
|
1
|
|
|
|
|
|
|
|
|
|
V 13
|
.45
|
.13
|
.36
|
.24
|
.09
|
.42
|
.14
|
.05
|
.35
|
.34
|
.20
|
.26
|
1
|
|
|
|
|
|
|
|
|
V 14
|
.48
|
.31
|
.71
|
.251
|
.23
|
.43
|
.14
|
.06
|
.26
|
.15
|
.30
|
.53
|
.27
|
1
|
|
|
|
|
|
|
|
V 15
|
.39
|
.09
|
.42
|
.41
|
.18
|
.17
|
.29
|
.22
|
.35
|
.42
|
.28
|
.19
|
.34
|
.34
|
1
|
|
|
|
|
|
|
V 16
|
.39
|
-.06
|
.26
|
.32
|
.21
|
.34
|
.07
|
.27
|
.30
|
.34
|
.31
|
.19
|
.19
|
.22
|
.57
|
1
|
|
|
|
|
|
V 17
|
.41
|
.18
|
.32
|
.16
|
.22
|
.40
|
.24
|
.15
|
.46
|
.33
|
.21
|
.24
|
.54
|
.31
|
.49
|
.45
|
1
|
|
|
|
|
V 18
|
.13
|
.09
|
.16
|
.13
|
-.07
|
.07
|
.16
|
-.04
|
.15
|
.01
|
.04
|
.27
|
.35
|
.33
|
.14
|
-.02
|
.45
|
1
|
|
|
|
V 19
|
.43
|
.17
|
.34
|
.24
|
.23
|
.15
|
.14
|
.11
|
.32
|
.17
|
.14
|
.06
|
.32
|
.38
|
.35
|
.22
|
.56
|
.48
|
1
|
|
|
V 20
|
.33
|
.07
|
.08
|
.01
|
-.13
|
.12
|
.43
|
.29
|
.31
|
.14
|
.20
|
.30
|
.13
|
.08
|
.28
|
.36
|
.22
|
.06
|
.19
|
1
|
The amount of variance accounted by the factor solution for each variable, i.e. communality, should be 0.5 or higher (Field, 2000; Hair et al., 2010, p 118) for a valid factor structure. The relative data (Table 5) show that most of the values are above 0.60 confirming validation of the analysis done.
Table 5: Communalities
|
|
Initial
|
Extraction
|
|
VAR00001
|
1.000
|
.642
|
|
VAR00002
|
1.000
|
.757
|
|
VAR00003
|
1.000
|
.732
|
|
VAR00004
|
1.000
|
.705
|
|
VAR00005
|
1.000
|
.464
|
|
VAR00006
|
1.000
|
.785
|
|
VAR00007
|
1.000
|
.623
|
|
VAR00008
|
1.000
|
.580
|
|
VAR00009
|
1.000
|
.698
|
|
VAR00010
|
1.000
|
.632
|
|
VAR00011
|
1.000
|
.574
|
|
VAR00012
|
1.000
|
.726
|
|
VAR00013
|
1.000
|
.518
|
|
VAR00014
|
1.000
|
.706
|
|
VAR00015
|
1.000
|
.677
|
|
VAR00016
|
1.000
|
.693
|
|
VAR00017
|
1.000
|
.688
|
|
VAR00018
|
1.000
|
.771
|
|
VAR00019
|
1.000
|
.614
|
|
VAR00020
|
1.000
|
.679
|
|
Extraction Method: Principal Component Analysis.
|
On extracting the 20 items based on the Principal Component Analysis (PCA) extraction method, and then choosing the Varimax rotation method, the initial rotation based on Eigen values greater than 1 have extracted 10 factors. However, in this case, the factor structure was more pronounced, and most of the variables were loaded. It has been advocated by varied academicians that if logic cannot be derived out of Kaiser Criterion, then multiple criteria should be used in order to extract factors based on fixed number of factors (Costello & Osborne, 2005). Hence, the extraction based on a fixed number of factors was conducted and it was observed that only six factors were showing face validity. Also, the cumulative percentage of variance criterion envisages that, for social sciences, 50-60% of variance explained is sufficing (Hair et al. 1995; Pett, Lackey, & Sullivan, 2003). Therefore, for the study, the EFA, with the aid of extraction technique PCA and the rotation method Varimax, based on a fixed number of six factors has been carried out. The output of is given in Table 6, and six factors cumulatively contribute to 66.8% of the total variance in the data.
Table 6:Eigen Values for the Six Extracted factors
|
Component
|
Rotation Sums of Squared Loadings
|
|
Total
|
% of Variance
|
Cumulative %
|
|
1
|
2.788
|
13.942
|
13.942
|
|
2
|
2.454
|
12.272
|
26.214
|
|
3
|
2.220
|
11.102
|
37.315
|
|
4
|
2.128
|
10.642
|
47.957
|
|
5
|
1.917
|
9.584
|
57.542
|
|
6
|
1.852
|
9.261
|
66.803
|
In order to determine the variable’s role and contribution in determining the factor structure, the factor loadings for each variable were processed. As the factor loading is the correlation of the variable and the factor, the squared loadings is the amount of the variable’s total variance accounted. Therefore, a 0.5 loading (R) denotes that 25% (R2) of the variance is accounted for the factor. On getting a satisfactory factor solution thus, the factors have been labelled. This process is about assigning the meaning to the factor structure. After examining all the significant variables for a particular factor, the factors were named by following the caveat of accurate reflection of the variables on the factor. The data on the rotated components, for each of the six factors, are given in Table 7. For each factor, the values of loadings indicate the correlations of the original variables with that factor. It is seen that variables 10, 11, 9 and 1 are highly loaded to factor 1, with values of 0.603 and above. Similarly, the set of variables highly loaded to the other five factors with values exceeding 0.5 can be identified.
Table 7:Rotated Component Matrix
|
|
Component
|
|
1
|
2
|
3
|
4
|
5
|
6
|
|
VAR00010
|
.763
|
-.065
|
.111
|
.072
|
.146
|
-.084
|
|
VAR00011
|
.737
|
.116
|
.005
|
-.081
|
.078
|
.069
|
|
VAR00009
|
.713
|
.147
|
.228
|
.249
|
-.100
|
.207
|
|
VAR00001
|
.603
|
.416
|
.225
|
.112
|
.122
|
.166
|
|
VAR00006
|
.146
|
.856
|
.112
|
.097
|
.089
|
-.044
|
|
VAR00012
|
-.049
|
.771
|
.183
|
.293
|
-.052
|
.086
|
|
VAR00014
|
.143
|
.536
|
.320
|
-.038
|
.142
|
.524
|
|
VAR00005
|
.203
|
.533
|
-.080
|
-.234
|
.242
|
.136
|
|
VAR00018
|
-.126
|
.036
|
.861
|
.052
|
-.070
|
.067
|
|
VAR00019
|
.206
|
.002
|
.676
|
.022
|
.242
|
.236
|
|
VAR00017
|
.344
|
.202
|
.671
|
.168
|
.223
|
.003
|
|
VAR00013
|
.293
|
.275
|
.587
|
.038
|
.101
|
.007
|
|
VAR00020
|
.263
|
.094
|
.081
|
.767
|
-.026
|
-.070
|
|
VAR00007
|
-.041
|
.040
|
.174
|
.756
|
.082
|
.107
|
|
VAR00008
|
.041
|
.043
|
-.157
|
.602
|
.388
|
.197
|
|
VAR00004
|
-.084
|
.079
|
.147
|
.018
|
.806
|
.139
|
|
VAR00015
|
.393
|
.067
|
.279
|
.216
|
.622
|
.077
|
|
VAR00016
|
.425
|
.255
|
.040
|
.208
|
.600
|
-.205
|
|
VAR00002
|
.025
|
-.032
|
.044
|
.192
|
-.025
|
.846
|
|
VAR00003
|
.157
|
.423
|
.217
|
-.070
|
.282
|
.630
|
|
Extraction Method: Principal Component Analysis.
Rotation Method: Varimax with Kaiser Normalization.
|
|
a. Rotation converged in 6 iterations.
|
Based on the factor loadings, the underlying factor structure has been identified as shown in Table 8. These factors are - Leadership (which explained 13.9 percent of variance), Intrapersonal (which revealed 12.3 percent of variation), Self-regulation (which spelt 11.1 percent of variation), Self-management (revealing 10.6 percent variation), Motivation (accounting for 9.6 per cent of variation), and finally Interpersonal (expressing 9.3 percent of variation). Hence the total variation is accounted to 66.8 percent. From this analysis, we find that the hypothesis that the attributes, having a bearing on the EI of the teachers, have latent and interdependent factors associated with them is accepted.
Table 8:Identification of Factors
|
Factors
|
Items (Variables)
|
Factor Loadings
|
|
Leadership
|
V10: People tell me that I am an inspiration for them.
|
.776
|
|
V11: I am able to encourage people to take initiative.
|
.746
|
|
V9: I can encourage others to work even when things are not favourable.
|
.675
|
|
V1: I can continue to do what I believe in, even under severe criticism.
|
.589
|
|
Intrapersonal
|
V19: I am able to identify and separate my emotions
|
.865
|
|
V20: My life is determined by my own actions
|
.698
|
|
V18: I am able to handle multiple demands
|
.688
|
|
V13: I can handle conflicts around me.
|
.582
|
|
Self-regulation
|
V6: I can concentrate on the task at hand despite disturbances.
|
.876
|
|
V12: I pay attention to the worries and concerns of others.
|
.719
|
|
V5: I can determine well what will happen in my life
|
.608
|
|
Self-management
|
V14: I can stand up for my beliefs
|
.845
|
|
V2: I try to see the other person’s point of view.
|
.822
|
|
V3: I believe in myself.
|
.675
|
|
Motivation
|
V21: I believe that happiness is a positive attitude.
|
.777
|
|
V7: I have built rapport and made and maintained personal friendships with work associates.
|
.752
|
|
V8: I love working in this organization.
|
.572
|
|
Interpersonal
|
V4: I am able to confront unethical actions of others.
|
.805
|
|
V16: I am able to meet commitments and keep promises.
|
.617
|
|
V17: I am organized and careful in my work.
|
.600
|
3. EI and Attitude towards Work
Having derived the latent factors embedded within the EI of the teachers, their relationship to the attitude towards work (ATW) is examined here using regression analysis.
For the six factors that have been extracted, indicating the characteristics of EI, factor scores have been obtained for each of the 63 respondents of the sample. The factors of EI could have an influence on the ATW of the teachers. The regression model used takes ATW as the dependent variable and the six factors of EI as independent variables viz., Leadership, Intrapersonal, Self-regulation, Self-management, Motivation and Interpersonal. The output is shown in Tables 9 to 11.
The value of adjusted R square, given in Table 9, indicates that 64.2 per cent of the variance in the dependent variable (ATW) is predicted by the predictor or independent variables (EI factors) which makes the model very explanatory. When the goodness of fit of the regression model is tested with F statistic, the output given in Table 10 shows the value of F as 19.5 with a level of significance (3.85E-12 for the calculated F) being less than the critical level of significance of 0.05. Hence we conclude that the regression model is a good fit.
Table 9: Regression Summary of EI and ATW
|
R
|
R Square
|
Adjusted R Square
|
Std. Error of the Estimate
|
|
0.822
|
0.677
|
0.642
|
0.396
|
Table 10: Anova Results for ATW and EI factors
|
|
df
|
SS
|
MS
|
F
|
Significance F
|
|
Regression
|
6
|
18.45127
|
3.075211
|
19.52831
|
3.85E-12
|
|
Residual
|
56
|
8.818575
|
0.157475
|
|
|
|
Total
|
62
|
27.26984
|
|
|
|
The regression statistics (Table 11) reveal that the p-values are significant at 5 per cent level and hence the intercept and the coefficients for leadership, self-regulation, self-management and motivation are interpretable. The p-values for the coefficients of interpersonal and interpersonal factors are greater than 0.05 level of significance and hence are omitted in the regression equation.
Table 11: Regression Statistics: Coefficients and Test Results for ATW and EI factors
|
|
Coefficients
|
Standard Error
|
t Stat
|
P-value
|
Lower 95%
|
Upper 95%
|
|
Intercept
|
4.31
|
0.05
|
86.04
|
3.49E-61*
|
4.20
|
4.40
|
|
Leadership
|
0.26
|
0.05
|
5.18
|
3.16E-06*
|
0.16
|
0.36
|
|
Intrapersonal
|
0.04
|
0.05
|
0.88
|
0.38
|
-0.06
|
0.15
|
|
Self-regulation
|
0.19
|
0.05
|
3.68
|
0.00*
|
0.08
|
0.29
|
|
Self-management
|
0.14
|
0.05
|
2.84
|
0.01*
|
0.04
|
0.24
|
|
Motivation
|
0.41
|
0.05
|
8.18
|
3.85E-11*
|
0.31
|
0.51
|
|
Interpersonal
|
0.05
|
0.05
|
1.01
|
0.32
|
-0.05
|
0.15
|
* Significant at 5 per cent level.
The regression model is formulated as equation (1) below.
Y = 4.3 + 0.26X1 + 0.18X2 + 0.14X3 + 0.41X4 ......... (1)
Where Y = Attitude towards Work (ATW)
X1 = Leadership
X2 = Self-regulation
X3 = Self-management
X4 = Motivation
Thus, the attitude of a teacher towards work is mostly influenced by motivation, followed by leadership, self-regulation and self-management. Hence, the research hypothesis that there is a significant relationship between ATW of the teachers and their EI is accepted.
EI Model for Performance Improvement
The six factors derived from the responses of the teachers have interdependence among them, and represent the construct of EI. Also, the attitude of the teachers under study, towards their work, is influenced by four factors viz., motivation, leadership, self-regulation and self-management. The two factors - interpersonal and interpersonal - are considered as embedded in these four factors.
It has been established conceptually in the above results that EI is an integrated construct of the factors of self-regulation and self-management of a person so that motivation triggers within. With interpersonal and intrapersonal strengths, such a person may be considered to have effective leadership qualities. Thus, the level of EI is influenced by the combined and integrated strength of these factors. The extent to which these factors influence the ATW of the teachers facilitates focusing on these factors more intensely and specifically.
Self-regulated behaviour of a teacher has a considerable impact on the ATW. A teacher with the self-regulated behaviour has a positive attitude towards work. Such behaviour would direct thoughts, feelings and action towards achievement of goals and expansion of expertise, and self-improvement.
A teacher with good self-management skills has positive attitude towards work and well-being. Self-managed teachers have clear priorities and be able to critically review their strengths and weaknesses. As the world of work changes and employees are expected to take responsibility for their own performance, self-management skills are seen as increasingly important.
People who are motivated tend to be more organised, have more self-esteem and confidence. Motivated teachers have a positive attitude towards work. People who are driven with enthusiasm and optimism tend to have a positive ATW.
Motivational and attitudinal patterns are very powerful influences on personality, emotions, competencies, and the resulting behaviour from all of these factors. In the end, the behaviour is what determines an individual’s performance.
Leadership behaviour in an individual has a significant relationship with the ATW. A teacher with leadership qualities is engaged with an energizing force and views any challenging situation with efficacy, resilience and optimism and can display positive ATW. A teacher with good leadership skills continually works to create improvements and hence increases individual as well as organizational performance.
The above results and discussion have shown that the attitude of a teacher towards work is mostly influenced by motivation, followed by leadership, self-regulation and self-management. Thus, we have a mechanism to improve the attitude of a teacher towards work, by providing opportunities and environment in the organisation, to develop and update in them the aspects of self-regulation, self-management, motivation and leadership traits. This may be named as the EI Model for Performance Improvement. This is depicted in Figure 1.
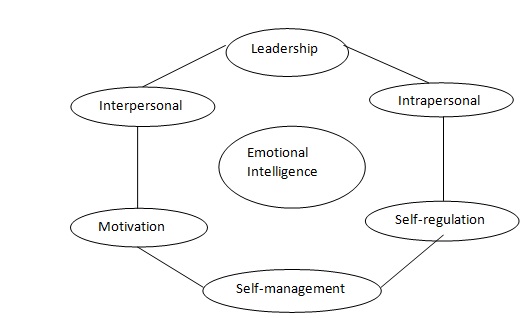
and the relationship given by the equation
Y = 4.3 + 0.26X1 + 0.18X2 + 0.14X3 + 0.41X4
Figure 1: EI Model for Performance Improvement
Source: Derived by the authors
The EI Model for Performance Improvement that has been developed can be applied in higher educational institutions to improve the performance of teachers, and thus the image of the institution itself.
Conclusion
Identification of teacher’s EI is important in teaching profession. The present study has attempted to identify the factors that are associated with the construct of EI of teachers in the higher education field, and find out the factors that influence the attitude towards their work. With the resulting output, a model has been evolved to facilitate improving the performance of the teachers in their work situation with better attitudes. It is shown that EI of the teacher is related with a positive attitude towards work. In order to raise the level of the teachers’ work involvement it could be possible to enable them to improve their level of EI and be more confident and successful both personally and professionally. Overall, the study is considered to facilitate the teachers and educational institutions in enhancing their performance, for better results.
Acknowledgements
We thank Prof. S. R. Subba Rao, for his assistance in the improvement and completion of this research paper. We would like extend our gratitude to all the teachers who provided their responses diligently. Findings and conclusions are the opinions of the authors only.
References
Amritha, M and Kadhiravan M., (2006), Influence of Personality on the Emotional Intelligence of Teachers, Edutracts, 5 (12), pp.25-29.
Anukool Hyde, SanjyotPethe, and UpinderDhar (2002), Manual for Emotional Intelligence Scale, Vedant Publications, Lucknow.
Brackett, M. A., Rivers, S. E., &Salovey. P. (2009), Emotional Intelligence: Implications for personal, social, academic, and workplace success,Social and Personality Psychology Compass, 5(1), 88–103.
Constantin, Ticu. (2004), Evaluarea psihologica a personalului. Iasi, Polirom
Costello, A. B., & Osborne, J. W. (2005), Exploratory Factor Analysis: Four recommendations for getting the most from your analysis, Practical Assessment, Research, and Evaluation, 10(7), 1-9.
S. (2010), Emotional Intelligence of Teacher Educators, International Journal of Education Science, 2(2).
Field, A. (2000). Discovering Statistics using SPSS for Windows, London – Thousand Oaks – New Delhi: Sage publications.
Goleman, D. (1995). Emotional Intelligence: Why it can Matter More than IQ, New York: Bantam Books.
Goleman, D. (1995), Emotional Intelligence, London: Bloomsbury Publishing.
Goleman, D., Boyatzis, R. E. and McKee, A. (2002), Primal Leadership: Realizing the power of Emotional Intelligence, Harvard Business Press.
Gowdhaman, K. and BalaMurugan M. (2010), Emotional Intelligence among the B.Ed. Teacher Trainees, Indian Journal of Psychometry and Education- 41(2) page- 137 – 142.
Hair J., Anderson RE, Tatham RL, Black WC. (1995), Multivariate data analysis, 4th ed. New Jersey: Prentice-Hall Inc.
Hair, J.F., Black, W.C., Babin, B.J., & Anderson, R.E. (2010), Multivariate Data Analysis, Seventh Edition. Prentice Hall, Upper Saddle River, New Jersey.
Hwang, F.F. (2007), The relationship between emotional intelligence and teaching effectiveness, D. dissertation Texas and M university – Kingsville, United States.
Kautish P. (2010), Emotional Intelligence and Business Education: An Analysis, Journal of All India Association for Educational Research 22, 1, June 2010, p 89-99.
Mayer, J. D. and Salovey. P. (1990), Emotional Intelligence, Imagination, Cognition and Personality. 9, 185-211.
Nunnally, J. C. (1978),Psychometric theory (2nd ed.). New York: McGraw-Hill.
Pathan Young, and Yunus G. (2004), Emotional Intelligence of Secondary teachers at D.Ed. College at Navaput, Maharashtra, Edutracts, 6 (1), pp.37-38.
Pett MA, Lackey NR, Sullivan JJ. (2003), Making Sense of Factor Analysis: The use of factor analysis for instrument development in health care research, California: Sage Publications Inc.
Rietveld, T. and Van Hout, R. (1993), Statistical techniques for the study of language and language behaviour, Berlin: Mouton de Gruyter.
Salami, S. O. (2007), Relationships of emotional intelligence and self-efficacy to work attitudes among secondary school teachers in southwestern Nigeria,Spring, 20 (3), 43-56.
Saroj Verma and Alka (2003), Emotional Intelligence and general well-being Among College Student,Journal of Community Guidance and Research, 20(1), 7-11.
Schutte, N.S., Malouff, J.M., Hall, L.E., Haggerty, D.J., Cooper, J.T., Golden, C.J., et al. (1998), Development and validation of a measure of emotional intelligence, Personality and Individual Differences, 25, 167-177.
Tyagi, S.K. (2004), Emotional Intelligence of Secondary Teachers in relation to gender and age, Journal of Educational Research and Extension, (3), 57.
Upadhyaya, P. (2006): Personality of Emotionally Intelligent Student Teachers. Journal of Educational Studies, Vol. 4 No. 1 & 2, p. 37 – 41.
Vandana V. Jadhav and Ajay Kumar Patil (2010), Emotional Intelligence among student Teachers in relation to General Intelligence and Academic Achievement, Edutrack, 10 (3), pp.36-37.

