A Refereed Monthly International Journal of Management
Title of the Manuscript: Analysis of the Efficacy of Black-Scholes Model -An Empirical Evidence from Call Options on Nifty-50 Index
|
Prof. A. Sudhakar
Professor
Department of Commerce
Dr. B.R. Ambedkar Open University, Hyderabad
Email: monakarthik@yahoo.com
|
CMA Potharla Srikanth
Assistant Professor
Department of Commerce
Post Graduate College, Constituent College of Osmania University, Secunderabad. Telangana
H.No. 1-9-471/9/17, Lalitha Nagar, Adikment, Hyderabad. Pin 500044.
Email: srikanthyadav444p@gmail.com
|
ABSTRACT
Normally theoretical price of an option represents its intrinsic value. The theoretical price of an option is computed by establishing mathematical relationship between the key variables which influence the price of an option. An effort was made by Fisher Black, Myron Scholes and Robert Merton to study this relationship. It had been resulted in the off-shot of Black-Scholes model which is a celebrated model in option pricing. The present study is an attempt to analyze the information content of theoretical price based on Black-Scholes model. The study has evaluated the efficacy of the model using regression analysis by regressing market price of Nifty-50 Index options on the theoretical price from January 2008 to December, 2014. The results of the analysis disclose that the Black-Scholes model is a well-reflected mathematical model and performs well in predicting the market price of the call options except in the case of options which belong to out-of-the-money and deep out-of-the-money categories.
Key Words: Call Options, Option Pricing Models, Black-Scholes Model, Index Options, Regression models.
Introduction
Option is a type of derivative which provides its holder a right but not an obligation to exercise the option. Call option holder will have a right but not an obligation to buy the underlying asset at the strike price, while put option holder will have a right but not an obligation to sell the underlying asset at the strike price. Option holder has to pay some price for getting the right in the form of an option whether it is a call option or a put option. The price which is paid by an option holder is also called option premium. The option premium (or option price) is determined by the interaction of demand and supply forces in the options market. So, the option price is highly dynamic depending upon the changes in the magnitude and direction of demand and supply forces. Demand and supply forces are influenced by myriad of factors in the market. Also, information asymmetry will play a critical role in the market. So, the option price may not always reflect the intrinsic value of the option. The intrinsic value of an option should represent the present value of potential payoff from exercising the option. It is also equally important that an option holder will exercise the option only when he can receive positive pay off from exercising the option. Hence, the present value of potential payoff receivable by exercising an option should be adjusted with the probability of in-the-money expiration of the option. It is the central tenet of the option pricing theory and it holds good for both the call options and the put options.
Theoretical Price of Options
Theoretical price of an option indicates the fair price of an option reflecting the intrinsic value of an option. Measurement of theoretical price of an option is based on developing a logical relationship between various companion variables influencing the option price in the market. Theoretical price guides an investor in taking appropriate decisions on option trading. When the market price of an option is more than its theoretical price, it is wise to sell an option. On the other hand, if the options market price is lower than the theoretical price, it is profitable to buy an option. This trading strategy is based on the tenet that a deviation of option’s market price from its theoretical price is only a short term phenomenon and in the near future market price of such option converges into its theoretical value. The nature of impact of the companion variables on option price is not the same for all call options and put options and so, the theoretical price needs to be computed for call options and put options individually.
Factors Influencing Option Pricing
The factors influencing an option price can broadly be divided into three categories viz., factors relating to underlying asset; factors relating to options market; and factors relating to macroeconomic environment. Underlying asset price, volume of trading in the underlying asset, momentum of the underlying asset price etc., are the key factors which can influence an option price. Option market relating factors can include number of option contracts traded, notional value of turnover, open interest and these are the crucial variables which can exercise preponderant impact on an option price. Macroeconomic variables like interest rate, forex rate, money supply, bench market index of stock market, oil prices, gold price industrial production etc., are the commonly quoted macroeconomic variables exhibiting paramount impact on spot market as well as derivatives market segments of capital market. The option pricing theories have constructed logical relationship between option price and the various key factors like underlying asset price, strike price, interest rate, volatility etc., and many empirical studies have revealed the significance of the relationship between an option price and factors determining the option price.
Black-Scholes Model
Black-Scholes option pricing model is evolved based on the underlying presumption that an investor can build a riskless portfolio by taking a contemporaneous position in the spot market and in the derivative market. It asserts that the position in the derivatives market offset the risk from the position in the spot market. The position in the spot market can be either a long position or a short position. If there is a perfect correlation between the behaviour of the spot market and the derivatives market, it is possible to yield a riskless profit, because the loss from the spot market position can be offset by the gain from the derivative market position and vice versa.
Option premium or theoretical price of an European style call option can be computed based on Black-Scholes model with the help of the following equation.
Where is price of the European style call option; is the underlying asset price and in the present study, it is the day-wise closing price of Nifty index; is the strike price of an option; is risk free rate and in the present study, it is MIBOR(Mumbai Interbank Offer Rate); is the time to maturity of an option; is the present value of strike price where the present value is exponential value of risk-free rate and the time to maturity. and indicates the probabilities of in-the-money expiry of a call option.
The first part of the equation i.e., indicates the expected value which an option holder will receive, if the option is exercised by him. So, the expected value of an option to be received by an option holder must be adjusted with the probability of ‘in-the-money’ expiry of the option, because an option will be exercised by an option holder only when it expires ‘in-the-money’.
The second part of the equation i.e., ‘ indicates the expected value of the payment to be made by an option holder, if he opts to exercise the option. It should also be adjusted with the probability of ‘in-the-money’ expiry of the option.
So, intuitively the value of call option under the Black-Scholes model is the difference between the expected value of the underlying asset receivable by an option holder and the expected value of payment to be made by the option holder to get the underlying asset. To put it otherwise, it is the present value of option’s potential payoff adjusted with the probability of in-the-money expiration of the option.
Computation of : refers to the expected value of underlying asset which can be received on exercise of an option. A call option holder would exercise the option only when the option is ‘in-the-money’ and on exercising the option, the holder of the option can receive the underlying asset. Hence, the receipt of the underlying asset is contingent on exercising an option. Computation of involves the measurement of and locating its value in the normal distribution table to find the . So, is computed by using the following equation:
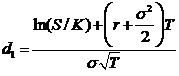
Where is the underlying asset price and in the present study, it is the day-wise closing price of Nifty-50 index; is the strike price of an option and is the natural log value of ; is the risk-free rate and in the present study, it is the MIBOR; is the squared value of ‘Annualized Standard Deviation’ which is computed based on the historical return from Nifty-50 for the 30 days immediately preceding the day of the selection of an option. is the time to maturity which is calculated as actual number of working days from the day of selection of an option contract till the day of expiry of that option.
After computation of , is estimated by identifying the area value under normal distribution curve. indicates the change in an option’s value given a one rupee change in the underlying security’s price. Hence, it is also called option’s ‘delta’. So, it can be used to estimate the number of shares that can be hedged by a single call option.
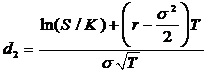
Computation of : computation involves the computation of which is done by using the following equation:
Alternatively d2 is computed as below:
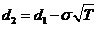
After computation of , is estimated by locating the value in the normal distribution table.
Assumptions underlying the Black-Scholes Model
Black-Scholes model is based on several assumptions which need careful analysis before applying the model in real-life situations. The model assumes that the volatility of the underlying asset is constant over the investment horizon. The volatility under Black-Scholes model is computed based on the annualized value of Standard Deviation. The standard deviation is computed for the historical returns for different time frames. Generally, one month period is considered for the computation of historical returns in case of near-month options. It also assumes that the stock market is informationally efficient indicating that the stocks quoted in the market instantly reflect the price sensitive information relating to the stock. Where the market is informationally efficient, stock prices move in random and no investor can get abnormal returns based on the past information of the stocks.
The original Black-Scholes model assumes that the underlying asset does not pay dividend. It is quite difficult to hold this assumption for all the securities in the market. Hence, later on, this assumption was relaxed by substituting the underlying asset price with the present value of future price where the present value is computed as an exponential value with a power of risk free rate and time to maturity. Interest rate reflect the opportunity cost of the funds required to be invested in the underlying asset, if it is purchased instantly in the spot market. Hence, interest rate will have paramount effect on an option price. Black-Scholes model assumes that the interest rate used in the computation of option price should be constant over the period of an option. In the present study, MIBOR is surrogated for the risk-free rate and it is assumed that the MIBOR is constant over the period of an option while computing the option price. Black-Scholes model assumes that the returns from an underlying asset are distributed lognormally. Since, stock prices can never be below zero, using lognormal distribution in modeling the stock price behaviour yields more pragmatic results.
The Black Scholes model assumes that the option is traded in the market in European style which means that an option can be exercised only on the day of expiry but not before the expiry date. In the present study, Nifty index options are European style options and so this assumption precisely holds good for the present study. Black Scholes model assumes that there are no transaction costs and commission in trading both the options and underlying assets. Lastly, it is assumed that both the underlying asset market and the options market are liquid.
Literature Review
Robert C. Merton (1973) examined and extended the Black-Scholes theory of option pricing with the help of additional assumptions and by deducing a set of restrictions on option pricing formulas based on the assumption of investors preferences. Additionally, effects of dividends and call provisions on the warrant prices are thoroughly examined. Louis O. Scott (1987) examined the European call option pricing on stocks with special focus on continuous time diffusion process for the return and the standard deviation parameters and came out with the solution which is an integral part of the Black-Scholes formulas. It is also opined that accurate option can be computed through Monte Carlo simulation. Nagendran, R (2010) applied Black-Schools on call options in India and the study reveals that call options are more sensitive to the stock price and strike price and least sensitive to the risk free rate. It is also found that the predictive ability of Black and Scholes model is reasonably high. V.K Singh (2011) compared the performance of Constant Elasticity of Variance (CEV) and Black – Scholes option pricing model for pricing S & P CNX Nifty 50 index. This study concludes that CEV is a better technique than Black and Scholes model when implementation cost and computational speed are the key factors.
Objective of the study
The main objective of the present study is to analyze the efficiency of theoretical price in predicting the market price of call options. The study also considers the impact of degree of moneyness on the efficiency of theoretical price of the call options.
Methodology of the study
1. Period of Study
The period of study is 7 years i.e., from January, 2008 to December, 2014.
2. Sources of data
The present study is based on secondary data which is compiled from the official website of National Stock Exchange of India(NSE). This day-wise data on market price of options, underlying asset price and MIBOR is sourced from NSE website.
3. Sampling framework of the study
Total number of call options available during the period from January 2008 to December, 2014 were 71,995. Out of the total available call options, call options on expiry day and three days immediately preceding the expiry day are excluded from the analysis in order to avoid the bias existing on the days nearer to expiry. So, the total observations excluded are 14,252 and the observations considered for the analysis are 57,743.
4. Moneyness-wise Classification of the Call Options
Moneyness of Option Contracts is computed using the following formula

Where indicates moneyness; is the strike price of an option contract; is the current price of future contracts on Nifty-50 index.
Options with moneyness between 0.98 to 1.02 considered as at-the-money options; options with moneyness between 0.90 to 0.98 considered as in-the-money options; options with moneyness between 1.02 to 1.10 considered as out-of-the-money options; options with moneyness less than 0.90 considered as deep in-the-money options; option with moneyness more than 1.10 considered as deep out-of-the-money options.
5. Analytical Framework of the Study
At the outset, to understand the behaviour of market price and theoretical price of the call options during the study period, descriptive statistics are calculated and analyzed. Descriptive statistics used for the analysis include mean, standard deviation, coefficient of variation, skewness and kurtosis for each category of moneyness and for the entire sample.
An Ordinary Least Squares(OLS) Regression has been modeled to evaluate the impact of theoretical price of options on their market prices. Market price is used as regressand and theoretical price is used as regressor in the model. The regression analysis is done for each group of moneyness separately and also for the entire sample. When the entire sample of observations is considered for the analysis, regression model is constructed in two different ways i.e., ignoring the moneyness of the options and incorporating the impact of moneyness of the options in the form of dummy variables.
The following equation shows the regression model used for the study.

……………………(1)
In equation(1), denotes market price of a call option ‘i’ at time ‘t’; is constant of the model; is theoretical price of a call option ‘i’ at time ‘t’ and is its slope coefficient; is error term of the model.
Regression model for the whole period including dummy variables for moneyness is as follows

……………..(2)
In equation(2), is the dummy variable for at-the-money category and is its slope coefficient; represents out-of-the-money category and is its slope coefficient; represents in-the-money category and is its slope coefficient; represents deep in-the-money category and is its slope coefficient; represents deep out-of-the-money category and is its slope coefficient; is error term. In order to avoid dummy variable trap, the equation(2) does not include intercept in it.
Analysis of the Results
1. Descriptive Statistics of Market Price and Theoretical Price of Options
In order to understand the characteristics of the market price of call options and also to capture the profile of theoretical price of the call options various key descriptive statistics have been analyzed.
Table 2 outlines the descriptive statistics of market price and theoretical price of call options in the five different categories of moneyness and for the entire sample ignoring the moneyness. Coefficient of variation reveals that the option price has exhibited comparatively lower deviations from its mean when it is in in-the-money regime. Options which are out-of-the-money and deep out-of-the-money have recorded comparatively higher fluctuations in their prices. Abnormal fluctuations can be evidenced when the options are deep out-of-the-money. Interestingly, when the options are deep in-the-money, the deviations of individual observations from their mean value are very low compared to that of deep out-of-the-money category. It signifies the leverage effect on the volatility of financial asset prices. It is also to be remembered that options are highly susceptible to leverage effect. Skewness of the distribution is positive in all the cases which indicates longer right tail of the distribution. Kurtosis is leptokurtic in all the regimes of moneyness except in case of theoretical price of option which are in-the-money category.
2. Estimation of Market Price of Call Options
This section encompasses the discussion on role of theoretical price of call options in estimation of market price of call options. Call options are divided into five types based on the degree of moneyness viz., at-the-money call options, in-the-money call options, out-of-the-money call options, deep in-the-money call options and deep out-of-the-money call options. In each category of moneyness, the theoretical price under Black-Scholes model is estimated and the role of theoretical price is examined by using OLS Regression analysis. This section contains the analysis of the role of Black-Scholes call option price in estimation of market price of call options.
Table-3 portrays the estimation of call option price for at-the money call option contracts with the regression model containing theoretical price from Black-Scholes model. The results of the analysis point out that both the constant and the theoretical price of call option have significant impact on the market price of call options. The beta coefficient of theoretical price of call option is comparatively larger than that of the constant highlighting the theoretical price estimated based on Black-Scholes model has preponderant impact in predicting the market price of the options. R-squared and Adjusted R-squared values are nearly 0.84 indicating that nearly 84% of the variation in the market price of call options can be explained by the fitted regression model. Significant value of F-statistic manifests that both the constant and theoretical price of call options have significant joint predictive power.
Table-4 maps out the results of the regression analysis conducted to estimate the market price of in-the-money call options with the help of theoretical price from Black-Scholes model. Just like the case of at-the-money options, both constant and theoretical price of the options have significant impact on market price of the call options. But there is a considerable increase in the weightage of constant. Besides, there is no noticeable change in the R-squared and adjusted R-squared values. The large F-statistic is mainly attributable to the fact that the number of observations in in-the-money regime are considerably greater than that of number of observations in at-the-money regime.
Table-5 delineates the estimation of market price of out-of-the-money call options by regressing it on theoretical price from Black-Scholes model. The results of the regression are different from those arrived for at-the-money and in-the-money option contracts. Coefficient of the constant is extremely larger than that of the theoretical price. But, both have significant impact on the market price of the out-of-the-money call options. R-squared and adjusted R-squared point out that nearly 52% of the variation in the market price of the out-of-the-money calls options can be explained by the fitted regression model. F-statistic value is relatively low, because of the lower number of out-of-the-money contract observations.
Table-6 depicts the estimation of market price of deep in-the-money call options based on the theoretical price from Black-Scholes model. Though, there is no considerable change in the coefficient of theoretical price of call option, sizeable increase in the coefficient of the constant can be noticed. Fairly large value of F-statistic highlights comparatively better predictability of the regression model.
Table-7 chalk outs the results of regression wherein market price of deep out-of-the-money call options is regressed on theoretical price. Theoretical price of deep out-of-the-money call options has trivial impact on the market price. Thus, the market price of deep out-of-the-money call options is difficult to predict with the help of theoretical value of call options. The superficial value of R-squared, adjusted R-squared and F-statistic substantiates the poor predictability of the theoretical price.
Table-8 outlines the results of regressing market price of entire selected call options in the study period ignoring the moneyness of the contracts. The results of the study unfold an interesting fact that the theoretical price of call options has a minor impact on their market value. Values of R-squared and Adjusted-R-squared have a very low value indicating that nearly 22% of the variance in the market price of call options can be explained by the fitted regression model. Even so, the significant value of F-statistic highlights that the fitted regression model has a significant predictive power.
Table-9 presents the results of the regression analysis conducted to test the predictability of the theoretical price of entire sample of call options while controlling the moneyness of call option contracts by incorporating the moneyness effect in the form of dummy variables in the regression equation. The results of the analysis manifest the paramount impact of moneyness on the prediction of market price of call options. The coefficient of the theoretical price of call option has insignificant impact on the market price of the same, while all the dummy variables of moneyness have significant impact. However, dummy variable for deep in-the-money category has greater impact followed by in-the-money dummy variable and deep out-of-the-money dummy variable.
3. Correlation between Residuals and Inputs of the Black-Scholes Model
The following section evaluates the efficacy of the regression analysis done in the preceding section, by analyzing the correlation between the residuals obtained from the regression model in each scenario and the inputs used in the measurement of option prices under the two option pricing models. Weak correlation between the residuals of the regression and inputs used in the option pricing model indicate the superior predictability of the theoretical price of options. If any input has moderate or strong correlation with the residuals, it indicates the exercise of bias by the inputs in predicting the market price of the options.
Table-10 delineates the correlation coefficients between the inputs of Black-Scholes regression model and the residuals of the regression model. Except in a few cases, the correlation coefficient does not exceed 0.30 which indicates the weak correlation between residuals of the regression model and the inputs of Black-Scholes model. The situations in which the correlation is greater than 0.30 are correlation between residual and spot price in deep out-of-the money category(-0.336); correlation between residuals and strike price in entire sample ignoring moneyness(-0.400); correlation between residuals and annualized standard deviation in deep out-of-the-money category(0.328). The weak correlation between residuals and inputs of the Black-Scholes model highlights that the information content of theoretical price is quite efficient in predicting the market price of the options.
4. Evaluation of the Regression Models
In this section, the forecast performance of the regression models is evaluated by employing four different ‘forecast performance evaluation measures’ viz., Root Mean Squared Error(RMSE), Mean Absolute Error(MAE), Mean Absolute Percentage Error(MAPE),Theil Inequality Coefficient(Theil-U). The following discussion outlines the forecast performance evaluation of the regression models.
Table-11 portrays the forecast performance evaluation measures which are computed separately for various regression models across all the categories of moneyness. Lower the measure, better the efficiency of the fitted regression model. Based on all the four measures of forecast performance evaluation, the regression model fitted for in-the-money options has been proved to be comparatively the most efficient model. The regression model constructed for the entire sample ignoring the moneyness has come out as the comparatively lowest efficient model. The evaluation measures are quite intuitive. When the entire sample of observations is considered for the regression analysis notwithstanding the fact of moneyness, the model ignores the most crucial factor which has major league on the market price of options.
Conclusion
The present research work is an attempt to measure the theoretical price of options based on Black-Scholes Option Pricing Model. It elucidates the importance of theoretical price of call options in making trading decisions. It also explains in detail the factor influencing the options prices in the market. Descriptive Statistics concludes that out-of-the-money and deep out-of-the-money options have exhibited a relatively higher fluctuations as indicated by the values of its coefficient of variation. The results of the regression analysis highlight that R-squared value is quite larger for at-the-money options, in-the-money options and deep-in-the-money options. The R-squared value is also significant when the market price of options is regressed with entire sample of observations by incorporating the effect of moneyness in the form of dummy variables. Very low value of R-squared can be observed for deep out-of-the-money options. So, it can be inferred that the Black-Scholes model performs well in predicting the market price of the call options except in the case of options which belong to out-of-the-money and deep out-of-the-money categories.
References
Robert C. Merton(1973), “Theory of Rational Option Pricing”, The Bell Journal of Economics and Management Science, Vol. 4, No. 1 (Spring, 1973), pp. 141-183.
Louis O. Scott(1987), “Option Pricing when the variance changes randomly: Theory, Estimation, and an application”, The Journal of Financial and Quantitative Analysis,vol.22, No.4(Dec.1987),pp.419-438.
Nagendran, R(2010), An empirical study of the Black-Scholes European option pricing formula in pricing the stock call: options in Indian stock option market’ (Doctoral dissertation). Retrieved from Shodhganga. URI: http://hdl.handle.net/10603/46
K. Singh and N. Ahmed(2011), “Forecasting Performance of Constant Elasticity of Variance Model: Empirical Evidence from India”, The international Journal of Applied Economics and Finance 5(1) pp.87-96.
ANNEXURE
Table 1: Moneyness-wise Classification of Number of
Observations of Call Options
|
Moneyness
|
Call Options Selected
|
|
At-the-money Options
|
4743
|
|
In-the-money Options
|
7477
|
|
Out-of-the-money Options
|
7534
|
|
Deep In-the-money Options
|
20915
|
|
Deep Out-of-the-money Options
|
17074
|
|
Total
|
57743
|
Source: Compiled from Official website of NSE and Classified as per Moneyness
Table 2: Descriptive Statistics of Market Price and Theoretical Price of Option
|
|
Mean
|
Standard Deviation
|
Coefficient of Variation
|
Skewness
|
Kurtosis
|
|
At-the-money options
|
|
Market Price
|
105.8037
|
64.38635
|
60.38000
|
1.845285
|
19.66200
|
|
Theoretical Price
|
108.2078
|
61.88978
|
57.41000
|
0.604488
|
3.201571
|
|
In-the-money options
|
|
Market Price
|
392.3387
|
147.5509
|
37.75510
|
0.744704
|
3.752551
|
|
Theoretical Price
|
400.1143
|
150.0351
|
37.50000
|
0.590928
|
2.854700
|
|
Out-of-the-money options
|
|
Market Price
|
17.86364
|
27.73426
|
155.5556
|
3.235180
|
22.65926
|
|
Theoretical Price
|
20.56730
|
33.38349
|
157.1429
|
2.579310
|
10.70293
|
|
Deep in-the-money options
|
|
Market Price
|
1393.808
|
714.1108
|
51.2195
|
1.390427
|
5.898432
|
|
Theoretical Price
|
1593.678
|
860.4337
|
53.9523
|
1.447375
|
5.697856
|
|
Deep out-of-the –money options
|
|
Market Price
|
61.57627
|
207.9174
|
335.4839
|
4.215231
|
21.07360
|
|
Theoretical Price
|
2.057566
|
8.495078
|
400.0000
|
6.529473
|
53.80014
|
|
Entire Sample
|
|
Market Price
|
584.8808
|
764.4236
|
130.5983
|
1.648710
|
6.091081
|
|
Theoretical Price
|
641.2336
|
895.5806
|
139.7816
|
1.792811
|
6.588809
|
Source: Computed from compiled data
Table 3: Estimation of Market Price of Call Options based on Theoretical Price from Black-Scholes Model [at-the-money call options]
|
Variable
|
Coefficient
|
Standard Error
|
t-statistic
|
P-Value
|
|
Constant
|
0.304771
|
0.026873
|
11.34125
|
0.0000
|
|
Theoretical Price from Black-Scholes Model
|
0.925019
|
0.005933
|
155.9042
|
0.0000
|
|
|
|
R-Squared
|
0.836782
|
F-Statistic
|
24306.11
|
|
Adjusted R-Squared
|
0.836748
|
P-Value
|
0.000000
|
| |
|
|
|
|
|
|
Source: Computed from compiled data
Table 4: Estimation of Market Price of Call Options based on Theoretical Price from Black-Scholes Model [in-the-money call options]
|
Variable
|
Coefficient
|
Standard Error
|
t-statistic
|
P-Value
|
|
Constant
|
0.555353
|
0.028405
|
19.55098
|
0.0000
|
|
Theoretical Price from Black-Scholes Model
|
0.902997
|
0.004788
|
188.5939
|
0.0000
|
|
|
|
R-Squared
|
0.826335
|
F-Statistic
|
35567.65
|
|
Adjusted R-Squared
|
0.826312
|
P-Value
|
0.000000
|
| |
|
|
|
|
|
|
Source: Computed from compiled data
Table 5: Estimation of Market Price of Call Options based on Theoretical Price from Black-Scholes Model [out-the-money call options]
|
Variable
|
Coefficient
|
Standard Error
|
t-statistic
|
P-Value
|
|
Constant
|
1.583523
|
0.012974
|
122.0563
|
0.0000
|
|
Theoretical Price from Black-Scholes Model
|
0.303482
|
0.003301
|
91.92449
|
0.0000
|
|
|
|
R-Squared
|
0.528723
|
F-Statistic
|
8450.112
|
|
Adjusted R-Squared
|
0.528661
|
P-Value
|
0.000000
|
| |
|
|
|
|
|
|
Source: Computed from compiled data
Table 6: Estimation of Market Price of Call Options based on Theoretical Price from Black-Scholes Model [deep in-the-money call options]
|
Variable
|
Coefficient
|
Standard Error
|
t-statistic
|
P-Value
|
|
Constant
|
1.086104
|
0.025605
|
42.41747
|
0.0000
|
|
Theoretical Price from Black-Scholes Model
|
0.832820
|
0.003526
|
236.1764
|
0.0000
|
|
|
|
R-Squared
|
0.727313
|
F-Statistic
|
55779.28
|
|
Adjusted R-Squared
|
0.727300
|
P-Value
|
0.000000
|
| |
|
|
|
|
|
|
Source: Computed from compiled data
Table 7: Estimation of Market Price of Call Options based on Theoretical Price from Black-Scholes Model [deep out-the-money call options]
|
Variable
|
Coefficient
|
Standard Error
|
t-statistic
|
P-Value
|
|
Constant
|
0.466969
|
0.023470
|
19.89627
|
0.0000
|
|
Theoretical Price from Black-Scholes Model
|
-0.003800
|
0.000669
|
-5.679975
|
0.0000
|
|
|
|
R-Squared
|
0.001886
|
F-Statistic
|
32.26212
|
|
Adjusted R-Squared
|
0.001828
|
P-Value
|
0.000000
|
| |
|
|
|
|
|
|
Source: Computed from compiled data
Table 8: Estimation of Market Price of Call Options based on Theoretical Price from Black-Scholes Model [complete call options -without controlling moneyness]
|
Variable
|
Coefficient
|
Standard Error
|
t-statistic
|
P-Value
|
|
Constant
|
4.261524
|
0.011990
|
355.4194
|
0.0000
|
|
Theoretical Price from Black-Scholes Model
|
0.077698
|
0.000606
|
128.1946
|
0.0000
|
|
|
|
R-Squared
|
0.221556
|
F-Statistic
|
16433.85
|
|
Adjusted R-Squared
|
0.221542
|
P-Value
|
0.000000
|
| |
|
|
|
|
|
|
Source: Computed from compiled data
Table 9: Estimation of Market Price of Call Options based on Theoretical Price from Black-Scholes Model [complete call options -controlling moneyness]
|
Variable
|
Coefficient
|
Standard Error
|
t-statistic
|
P-Value
|
|
Theoretical Price from Black-Scholes Model
|
-0.000810
|
0.000408
|
-1.986643
|
0.0470
|
|
At-the-money Dummy Variables
|
4.439851
|
0.022458
|
197.6990
|
0.0000
|
|
In-the-money Dummy Variable
|
5.905977
|
0.017990
|
328.2872
|
0.0000
|
|
Out-of-the-money Dummy Variable
|
1.785451
|
0.017762
|
100.5199
|
0.0000
|
|
Deep In-the-money Dummy Variable
|
7.124408
|
0.011061
|
644.1187
|
0.0000
|
|
Deep Out-of-the-money Dummy Variable
|
0.526804
|
0.014344
|
36.72764
|
0.0000
|
|
|
|
R-Squared
|
0.774696
|
F-Statistic
|
NA
|
|
Adjusted R-Squared
|
0.774677
|
P-Value
|
NA
|
| |
|
|
|
|
|
|
Source: Computed from compiled data
Table 10: Correlation between Residuals from the Select Options Pricing Models and Inputs of the Models
|
Inputs of the Model
|
Inputs of the Model
|
|
Spot price
|
Strike Price
|
Annualized Standard Deviation
|
Time to Maturity
|
MIBOR
|
|
At-the-Money Options
|
0.011122
|
0.001746
|
-0.204119
|
0.173925
|
-0.008997
|
|
In-the-Money Options
|
-0.025972
|
-0.031270
|
-0.102087
|
-0.016484
|
0.005092
|
|
Out-of-the-Money Options
|
-0.229990
|
-0.246430
|
0.270528
|
0.184555
|
-0.029244
|
|
Deep in-the-money options
|
0.072877
|
0.124419
|
-0.171476
|
-0.01267
|
0.170061
|
|
Deep out-of-the-money options
|
-0.336346
|
-0.235247
|
0.327568
|
0.137883
|
-0.072553
|
|
Entire Sample( ignoring Moneyness)
|
0.063588
|
-0.399841
|
-0.082283
|
0.000653
|
-0.105193
|
|
Entire Sample (controlling moneyness)
|
-0.198090
|
-0.154357
|
0.232446
|
0.135735
|
-0.015393
|
Source: Computed from compiled data
Table 11: Evaluation of the Regression Models
|
Evaluation Measures
|
Evaluation Measures
|
|
RMSE
|
MAE
|
MAPE
|
Theil-U
|
|
At-the-Money Options
|
0.307133
|
0.203604
|
5.577891
|
0.034159
|
|
In-the-Money Options
|
0.159058
|
0.085977
|
1.456915
|
0.013451
|
|
Out-of-the-Money Options
|
1.109781
|
0.867760
|
158.2546
|
0.244156
|
|
Deep In-the-Money Options
|
0.259622
|
0.168300
|
2.397579
|
0.018197
|
|
Deep Out-of-the-Money Options
|
2.518769
|
1.984088
|
136.6900
|
0.803973
|
|
Entire Sample(Ignoring Moneyness)
|
2.865271
|
2.427305
|
251.5908
|
0.298259
|
|
Entire Sample (Controlling Moneyness)
|
1.541473
|
0.998240
|
77.86493
|
0.150697
|
Source: Computed from compiled data

