A Refereed Monthly International Journal of Management
Performance Analysis of Public Sector General Insurance Companies Operating in India
|
Dr. P .Hanumantha Rao
Assistant Professor
NICMAR, Hyderabad
|
Abstract
Indian economy remained stable in last few years despite the global recession. Insurance sector has a very significant role to play in future to keep the momentum going as there is huge untapped potential in the sector. Insurance sector is divided into two groups, life and non-life. Public sector general insurance companies have a very contribution to make as far as non-life sector is concerned. In India, we have four important public sector general insurance companies, namely, National Insurance Co. Ltd. The New India Assurance Co. Ltd., The Oriental Insurance Co. Ltd., United India Insurance Co. Ltd. The article aims to examine the performance of these four companies on the basis of quarterly performance on various parameters like Gross Premium, Earned premium, Profit After Tax, Net Incurred Claim Ratio on Earned Premium(%), Net Incurred Claim Ratio on Earned Premium(%), Net Acquisition Cost Ratio on Earned Premium(%), Management Expenses Ratio to Earned Premium(%). It takes into accounts performance of six recent quarters.
.
Key Worlds: Earned Premium, Gross Premium, Profit after Tax, Net Acquisition cost.
Introduction
Despite economic recession all over the world and deficit monsoon in last few years, India could register a robust growth rate of of 7.2 per cent in 2014-15 and 7.6 per cent in 2015-16, and hence became one of the fastest growing major economies in the world. If we see quarterly results, Indian Economy has registered actual growth rates of 7.6%, 7.7% and 7.3% in Q1, Q2 and Q3 of the year 2015-16 respectively. As per the estimates of the International Monetary Fund (IMF), global growth rate was on an average 3.1 per cent in 2015, reflecting a decline from 3.4 per cent registered in 2014. While growth rate in advanced economies has been moderate since 2013, the emerging economies could witness a consistently declining trend in growth rate since 2010. It is in this context that the recent Indian growth story appears very significant. Insurance sector has a very significant role in realizing higher economic growth in the country. The insurance industry of India consists of 53 insurance companies of which 24 are in life insurance business and 29 are non-life insurers. India is ranked as the fifteenth largest insurance market in the world in terms of premium volume, and has the potential to grow exponentially in the years to come. The insurance market in India has a huge business opportunity waiting to be harnessed. India currently accounts for less than 1.5 per cent of the world’s total insurance premiums and about 2 per cent of the world’s life insurance premiums despite being the second most populous nation in the world. Insurance requirements have increased in order to keep pace with the increasing risks in today’s age of consumerism. Gone are the days when life insurances only mattered for the people; today we have a wide assortment of risk coverage commencing from health insurance to travel insurance to theft insurance to even a wedding insurance. With the increased spending capacity of middle class, there is a growing trend to fulfill needs, deal with responsibilities and secure one’s possessions, be it good health or worldly wealth. General insurance companies are there cater to these increasing demands and to offer a plethora of insurance covers that almost cover anything under the sun. Any insurance other than ‘Life Insurance’ comes under the category of General Insurance. It comprises of:
- Insurance of property against fire, theft, burglary, terrorism, natural disasters etc
- Personal insurance such as Accident Policy, Health Insurance and liability insurance which covers legal liabilities.
- Errors and Omissions Insurance for professionals, credit insurance etc.
- Policy covers such as coverage of machinery against breakdown or loss or damage during the transit.
- Policies that provide marine insurance covering goods in transit by sea, air, railways, waterways and road and cover the hull of ships.
- Insurance of motor vehicles against damages or accidents and theft
General insurance products and services are generally offered as package policies offering a combination of the covers mentioned above in various permutations and combinations. Various packages are specially designed for householders, shopkeepers, industrialists, agriculturists, entrepreneurs, employees and for professionals such as doctors, engineers, chartered accountants etc. Apart from standard covers, customized or tailor-made policies based on the personal requirements of the customer are also offered by the General insurance companies in India. A suitable general insurance cover is a necessity for every family. This is a required to overcome uncertainties and risks prevalent in life.
Classification of Insurance industry in India
General Insurance is called as Non-Life Insurance in India. There are totally 29 General Insurance (Non-Life) Companies in India at present. These 29 General Insurance companies have been classified into two broad categories namely:
Private sector undertakings:
Agriculture Insurance Co. of India Ltd., Apollo Munich Health Insurance Co. Ltd., Bajaj Allianz General Insurance Co. Ltd., Bharti Axa General Insurance Co. Ltd., Cholamandalam MS General Insurance Co. Ltd., Cigna TTK Health Insurance Co. Ltd., Export Credit Guarantee Corporation of India Ltd., Future Generali India Insurance Co. Ltd., HDFC ERGO General Insurance Co. Ltd., ICICI Lombard General Insurance Co. Ltd., IFFCO Tokio General Insurance Co. Ltd., L&T General Insurance Co. Ltd., Liberty Videocon General Insurance Co. Ltd., Magma HDI General Insurance Co. Ltd., Max Bupa Health Insurance Co. Ltd., Raheja QBE General Insurance Co. Ltd. , Reliance General Insurance Co. Ltd., Religare Health Insurance Co. Ltd., Royal Sundaram Alliance Insurance Co. Ltd., SBI General Insurance Co. Ltd., Shriram General Insurance Co. Ltd., Star Health and Allied Insurance Co. Ltd., Tata AIG General Insurance Co. Ltd., Universal Sompo General Insurance Co. Ltd., Kotak Mahindra General Insurance Co. Ltd.
Public Sector Undertakings
National Insurance Co. Ltd., The New India Assurance Co. Ltd., The Oriental Insurance Co. Ltd., United India Insurance Co. Ltd.,
Previous Studies on the Indian General Insurance Sector
Verma (2003) highlighted that motor insurance is the biggest and fastest growing general insurance portfolio in the Indian insurance market and it accounted for more than 42% of the cash flow of general insurers.
Gupta and Trivedi (2005) were of the opinion that both the private and public sector should be involved in partnerships with various other organizations to extend health coverage to the larger portion of the population.
Jawahar (2006) found that performance in some areas has been exceptionally good; other areas need to be addressed by all players to ensure an overall growth.
Sinha (2007) made a comparison between 12 private sector general insurance companies with respect to technical and scale efficiency and total factor productivity in a two output-three input framework, for the years 2003-2004 and 2004-2005, using the DEA and Malmquist total factor productivity index. The results have shown that the observed public sector insurance companies exhibited higher mean technical efficiency than the observed private sector insurers, taking into consideration net premium income.
Bishnoi and Sharan (2007) found that the private players have shown that they are tough players in the health portfolio. Both the private and public sector players have an almost equal contribution in the health portfolio but it seems that by 2010, the private sector players will overtake the public sector players and will be the market leaders in this sector.
Lloyds (2008) in its report observed that the non-tariffed products grew at a faster rate than tariffed products between 2005 and 2006. In particular, the non-tariffed portfolio of personal accidents, healthcare, marine hull, and liability experienced high growth rates.
Sinha (2009), in his paper, made a comparison between the technical efficiency of four public sector and six private sector general insurance companies using a non- 32 radial data envelopment analysis. The study was for the period from 2003-04 to 2005-06. The outputs considered were net premium income and operating income; and inputs were considered as operating expenses. The study had shown that there was a decline in the mean technical efficiency in 2004-05 relative to 2003-04, but it increased again in 2005-06. Among the observed general insurance companies, Reliance and New India consistently occupied the top two slots for all the years among the observed general insurance companies.
Objectives of the study
The main aim of the research paper is
- To analyze the performance of four Governments owned General insurance companies operating in India.
- To make a comparison between them
- To identify the factors leading to better performance
Research Methodology
The study is based on the performance analysis of four general insurance companied owned by Govt. of India. They are National Insurance Co. Ltd. (NICL), The New India Assurance Co. Ltd. (NIACL), The Oriental Insurance Co. Ltd.(OICL) and United India Insurance Co. Ltd.(UICL). The data is collected on the various parameters like Gross Premium, Earned premium, Profit After Tax, Net Incurred Claim Ratio on Earned Premium(%), Net Incurred Claim Ratio on Earned Premium(%), Net Acquisition Cost Ratio on Earned Premium(%), Management Expenses Ratio to Earned Premium(%). The data is collected for six quarters starting from first quarter of 2014-15 to second quarter of 2015-16. The various statistical tools used are mean, standard deviation, coefficient of various and ANOVA. The study is based on following hypothesis
H01: There is no significant difference in Gross Premium between the Sample Units and within the sample units during the study period.
H02: There is no significant difference in E Premium between the Sample Units and within the sample units during the study period.
H03: There is no significant difference in Profit after Tax between the Sample Units and within the sample units during the study period.
H04: There is no significant difference in Net Incurred Claim Ratio on Earned Premium (%) between the Sample Units and within the sample units during the study period.
H05: There is no significant difference in Net Acquisition Cost Ratio on Earned Premium (%) between the Sample Units and within the sample units during the study period.
H06: There is no significant difference in Management Expenses Ratio to Earned Premium (%) between the Sample Units and within the sample units during the study period.
Data Analysis and Discussion
Gross Premium: The premium charge for insurance that includes anticipated cost of losses, overhead, and profit is known as Gross Premium. The following table gives us an idea about the gross premium collected by various public sector general insurance companies for the period of study:
|
Gross Premium
|
|
| |
|
Years
|
New India Assurance Co. Ltd. (NIACL)
|
National Insurance Co. Ltd. (NICL)
|
Oriental Insurance Co. Ltd. (OICL)
|
United India Insurance Co. Ltd. (UIICL)
|
|
|
First Quarter (2014-15)
|
4019.62
|
2851.99
|
2047.93
|
2728.91
|
|
|
Second Quarter (2014-15)
|
7468.72
|
5415.56
|
3878.45
|
5291.05
|
|
|
Third Quarter (2014-15)
|
11553.54
|
8203.88
|
5867.2
|
7768.79
|
|
|
Fourth Quarter (2014-15)
|
16050
|
11282.64
|
7561.93
|
10691.73
|
|
|
First Quarter (2015-16)
|
4587.47
|
3044.99
|
2230.05
|
3185.08
|
|
|
Second Quarter (2015-16)
|
8569.3
|
5846.72
|
4309.3
|
5913.58
|
|
|
CAGR
|
16.35%
|
15.44%
|
16.04%
|
16.73%
|
|
|
Mean
|
8708.11
|
6107.63
|
4315.81
|
5929.86
|
|
|
S.D
|
4528.06
|
3215.62
|
2127.40
|
2974.74
|
|
|
CV
|
52.00
|
52.65
|
49.29
|
50.17
|
|
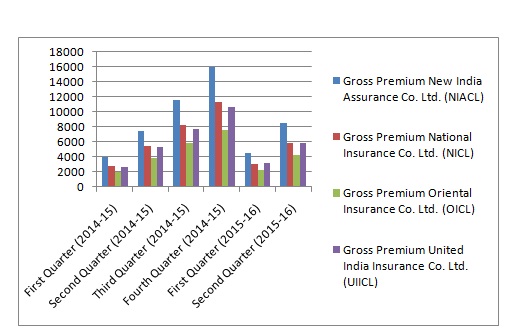
From the above table, we can see that average gross premium is highest in case of NIACL, followed by NICL, UIICL and OICL. However, the highest variation is also observed in case of NIACL. In the year 2014-15, it has steadily increased for all the four companies. Then, the first quarter of 2015-16 recorded a decline from the last quarter of previous year. So, we can observe same trend upward in gross premium in both the years. This can be observed from the diagram below also.
Now we test whether there is significant difference in the gross premium between the companies or not using a one way ANOVA as below:
|
One-way ANOVA Table
|
|
Source of Variation
|
SS
|
df
|
MS
|
F
|
P-value
|
F crit
|
|
Between Groups
|
61013009
|
3
|
20337670
|
1.989894
|
0.15614
|
3.238872
|
|
Within Groups
|
1.64E+08
|
16
|
10220478
|
|
|
|
|
|
|
|
|
|
|
|
|
Total
|
2.25E+08
|
19
|
|
|
|
|
Interpretation: As the calculated value (1.989894) is less than the critical value (3.238872) at 5% level of significance in Table 2, null hypothesis (H01) is accepted and hence it can be concluded that there is no significant difference in gross premium between NIACL, NICL, UIICL and OICL. Hence, we cannot differentiate their performance on the basis of gross premium collected during the sample period.
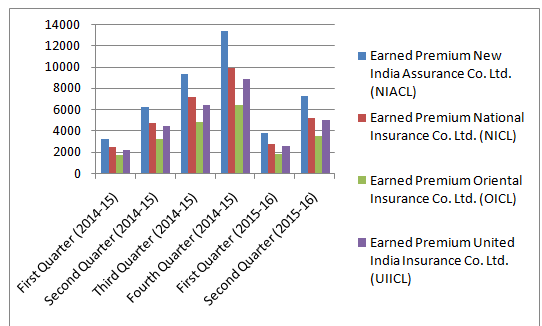
Earned Premium: The portion of premium that applies to the expired part of the policy period is known as earned preimum. Insurance premiums are payable in advance but the insurance company does not fully earn them until the policy period expire
|
Earned Premium
|
|
| |
|
Years
|
New India Assurance Co. Ltd. (NIACL)
|
National Insurance Co. Ltd. (NICL)
|
Oriental Insurance Co. Ltd. (OICL)
|
United India Insurance Co. Ltd. (UIICL)
|
|
|
First Quarter (2014-15)
|
3183.73
|
2448.81
|
1712.52
|
2167.92
|
|
|
Second Quarter (2014-15)
|
6225.91
|
4683.17
|
3217.95
|
4394.75
|
|
|
Third Quarter (2014-15)
|
9347.54
|
7168.82
|
4757.25
|
6401.9
|
|
|
Fourth Quarter (2014-15)
|
13315.29
|
9898.16
|
6425.16
|
8816.23
|
|
|
First Quarter (2015-16)
|
3777.84
|
2750.02
|
1829.03
|
2514.88
|
|
|
Second Quarter (2015-16)
|
7227.99
|
5201.23
|
3502.37
|
4996.13
|
|
|
CAGR
|
17.82%
|
16.26%
|
15.38%
|
18.17%
|
|
|
Mean
|
7179.72
|
5358.37
|
3574.05
|
4881.97
|
|
|
S.D
|
3762.91
|
2815.57
|
1798.40
|
2490.31
|
|
|
CV
|
52.41
|
52.55
|
50.32
|
51.01
|
|
From the above table we can see that the average earned revenue for the six quarter is highest for NIACL, followed by NICL and UIICL. It was least for OICL. For both the years, trend was upward rising from lowest in first quarter and highest in fourth quarter. Highest CAGR was noticed in case of NIACL with maximum deviation. The same observation can be found in the following graph:
Now we test whether there is significant difference in the earned premium between the companies or not using a one way ANOVA as below:
|
One Way ANOVA Table for Earned Premium
|
|
Source of Variation
|
SS
|
df
|
MS
|
F
|
P-value
|
F crit
|
|
Between Groups
|
41710538
|
3
|
13903513
|
1.929434
|
0.16553
|
3.238872
|
|
Within Groups
|
1.15E+08
|
16
|
7206005
|
|
|
|
|
|
|
|
|
|
|
|
|
Total
|
1.57E+08
|
19
|
|
|
|
|
Interpretation: As the calculated value (1.929434) is less than the critical value (3.238872) at 5% level of significance in the above Table, null hypothesis (H01) is accepted and hence it can be concluded that there is no significant difference in earned premium between NIACL, NICL, UIICL and OICL. Hence, we cannot differentiate their performance on the basis of earned premium collected during the sample period.
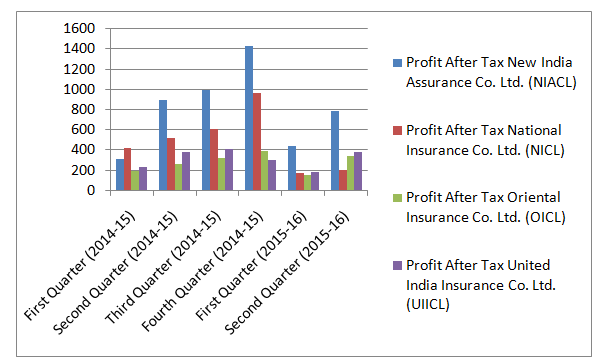
Profit After Tax is a financial performance ratio, calculated by dividing net income after taxes by turnover. A company's profit after tax is important because it tells investors the percentage of money a company actually earns on turnover.
|
Profit After Tax
|
|
| |
|
Years
|
New India Assurance Co. Ltd. (NIACL)
|
National Insurance Co. Ltd. (NICL)
|
Oriental Insurance Co. Ltd. (OICL)
|
United India Insurance Co. Ltd. (UIICL)
|
|
|
First Quarter (2014-15)
|
311.42
|
414
|
191.72
|
228.76
|
|
|
Second Quarter (2014-15)
|
899.09
|
521.12
|
260.77
|
376.23
|
|
|
Third Quarter (2014-15)
|
995.94
|
608.18
|
316.36
|
404.91
|
|
|
Fourth Quarter (2014-15)
|
1431.23
|
967.64
|
392.09
|
300.57
|
|
|
First Quarter (2015-16)
|
441.22
|
165.68
|
149.31
|
180.38
|
|
|
Second Quarter (2015-16)
|
787.7
|
195.66
|
335.4
|
374.79
|
|
|
CAGR
|
20.39%
|
-13.92%
|
11.84%
|
10.38%
|
|
|
Mean
|
811.10
|
478.71
|
274.28
|
310.94
|
|
|
S.D
|
403.36
|
296.62
|
91.65
|
90.64
|
|
|
CV
|
49.73
|
61.96
|
33.42
|
29.15
|
|
From the above table, we can see that the average profit after tax during six quarter under consideration for the study was highest in case of NIACL, followed by UIICL, NICL and OICL. The highest CAGR was also observed in case of NIACL. There is a negative CAGR in case of NICL with highest variability. If we plot these values in the form of a chart, we observe the following trend:
Now we test whether there is significant difference in the Profit after tax between the companies or not using a one way ANOVA as below:
|
One Way ANOVA Table for Profit After Tax
|
|
Source of Variation
|
SS
|
df
|
MS
|
F
|
P-value
|
F crit
|
|
Between Groups
|
1212405
|
3
|
404135.1
|
6.367034
|
0.004796
|
3.238872
|
|
Within Groups
|
1015569
|
16
|
63473.05
|
|
|
|
|
|
|
|
|
|
|
|
|
Total
|
2227974
|
19
|
|
|
|
|
Interpretation: As the calculated value (6.367034) is greater than the critical value (3.238872) at 5% level of significance in the above Table, null hypothesis (H01) is rejected and hence it can be concluded that there is a significant difference in the profit after tax between NIACL, NICL, UIICL and OICL. Hence, we can observe that profit after tax of NIACL is significantly better than other public sector general insurance companies in India. Profit after tax of NICL was lowest among others.
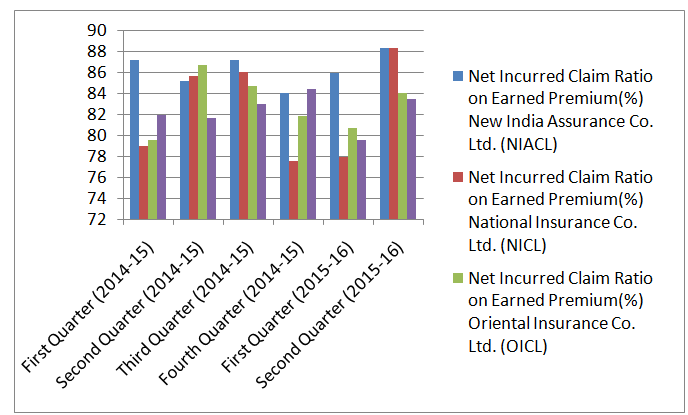
Net Incurred Claim Ratio on Earned Premium: Incurred Claims Ratio is nothing but the total value of all claims paid by the insurance company divided by the total amount of premium earned in the same period. Higher the ratio, higher is the expenses for the companies and lower is the earning of the companies. Let us have a look at the ratio as given in the following table:
|
Net Incurred Claim Ratio on Earned Premium (%)
|
|
| |
|
Years
|
New India Assurance Co. Ltd. (NIACL)
|
National Insurance Co. Ltd. (NICL)
|
Oriental Insurance Co. Ltd. (OICL)
|
United India Insurance Co. Ltd. (UIICL)
|
|
|
First Quarter (2014-15)
|
87.24
|
79
|
79.57
|
81.95
|
|
|
Second Quarter (2014-15)
|
85.17
|
85.67
|
86.74
|
81.7
|
|
|
Third Quarter (2014-15)
|
87.24
|
86.03
|
84.78
|
83.02
|
|
|
Fourth Quarter (2014-15)
|
84.02
|
77.54
|
81.89
|
84.42
|
|
|
First Quarter (2015-16)
|
85.94
|
77.94
|
80.76
|
79.61
|
|
|
Second Quarter (2015-16)
|
88.34
|
88.42
|
84.11
|
83.52
|
|
|
CAGR
|
0.25%
|
2.28%
|
1.12%
|
0.38%
|
|
|
Mean
|
86.33
|
82.43
|
82.98
|
82.37
|
|
|
S.D
|
1.58
|
4.80
|
2.70
|
1.68
|
|
|
CV
|
1.83
|
5.82
|
3.25
|
2.05
|
|
From the above table, we can see that the highest Net Incurred Claim Ratio on Earned Premium is for NICL and lowest is for UIICL. The ratio has grown faster for OICL. It has slightly increased for the all the companies as it can be seen from the following chart:
Now we test whether there is significant difference in the Net Incurred Claim Ratio on Earned Premium between the companies or not using a one way ANOVA as below:
Premium between the companies or not using a one way ANOVA as below:
|
One Way ANOVA Table for Net Incurred Claim Ratio on Earned Premium
|
|
Source of Variation
|
SS
|
df
|
MS
|
F
|
P-value
|
F crit
|
|
Between Groups
|
38.8621
|
3
|
12.95403
|
1.390855
|
0.281745
|
3.238872
|
|
Within Groups
|
149.0195
|
16
|
9.31372
|
|
|
|
|
|
|
|
|
|
|
|
|
Total
|
187.8816
|
19
|
|
|
|
|
Interpretation: As the calculated value (1.390855) is less than the critical value (3.238872) at 5% level of significance in the above Table, null hypothesis (H01) is accepted and hence it can be concluded that there is no significant difference in the Net Incurred Claim Ratio on Earned Premium between NIACL, NICL, UIICL and OICL. Hence, we can observe that it is difficult to differentiate companies based on Net Incurred Claim Ratio on Earned Premium.
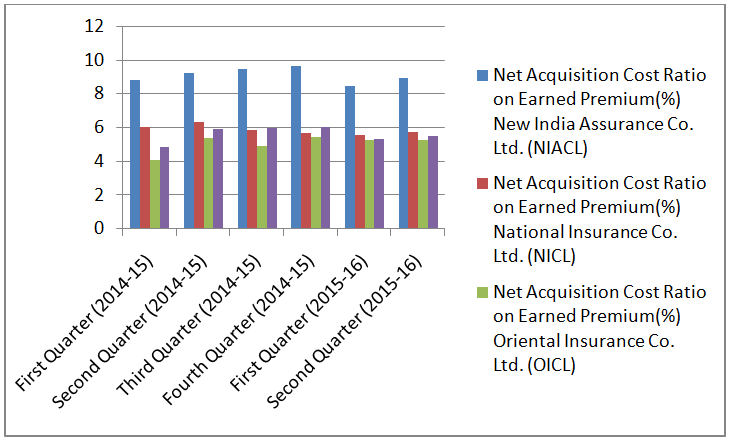
Net Acquisition Cost Ratio on Earned Premium: The total of net commission and operating expenses incurred in the generation of net earned premium are generally expressed as a percentage of net earned premiums. The following table gives an idea about the net acquisition cost on earned premium for the four general insurance companies in India:
|
Net Acquisition Cost Ratio on Earned Premium (%)
|
|
| |
|
Years
|
New India Assurance Co. Ltd. (NIACL)
|
National Insurance Co. Ltd. (NICL)
|
Oriental Insurance Co. Ltd. (OICL)
|
United India Insurance Co. Ltd. (UIICL)
|
|
|
First Quarter (2014-15)
|
8.78
|
6.04
|
4.09
|
4.87
|
|
|
Second Quarter (2014-15)
|
9.22
|
6.34
|
5.37
|
5.9
|
|
|
Third Quarter (2014-15)
|
9.45
|
5.87
|
4.91
|
5.98
|
|
|
Fourth Quarter (2014-15)
|
9.64
|
5.7
|
5.41
|
6.03
|
|
|
First Quarter (2015-16)
|
8.47
|
5.55
|
5.24
|
5.3
|
|
|
Second Quarter (2015-16)
|
8.92
|
5.76
|
5.28
|
5.47
|
|
|
CAGR
|
0.32%
|
-0.94%
|
5.24%
|
2.35%
|
|
|
Mean
|
9.08
|
5.88
|
5.05
|
5.59
|
|
|
S.D
|
0.44
|
0.28
|
0.50
|
0.46
|
|
|
CV
|
4.82
|
4.77
|
9.95
|
8.23
|
|
From the above table, we can see that the acquisition cost is highest in case of NIACL and least for OICL. It has declined over the six quarters for NICL. From the following chart, we can see that it has remained more or less same over the various quarters.
Now we test whether there is significant difference in the Net Acquisition Cost Ratio on Earned Premium between the companies or not using a one way ANOVA as below:
|
ANOVA
|
|
Source of Variation
|
SS
|
df
|
MS
|
F
|
P-value
|
F crit
|
|
Between Groups
|
47.82918
|
3
|
15.94306
|
141.6594
|
9.86E-12
|
3.238872
|
|
Within Groups
|
1.80072
|
16
|
0.112545
|
|
|
|
|
|
|
|
|
|
|
|
|
Total
|
49.6299
|
19
|
|
|
|
|
Interpretation: As the calculated value (141.6594) is more than the critical value (3.238872) at 5% level of significance in the above Table, null hypothesis (H01) is rejected and hence it can be concluded that there is a significant difference in the Net Acquisition Cost Ratio on Earned Premium between NIACL, NICL, UIICL and OICL. Hence, we can observe Net Acquisition Cost Ratio on Earned Premium is significantly higher for NIACL over other public sector general insurance companies.
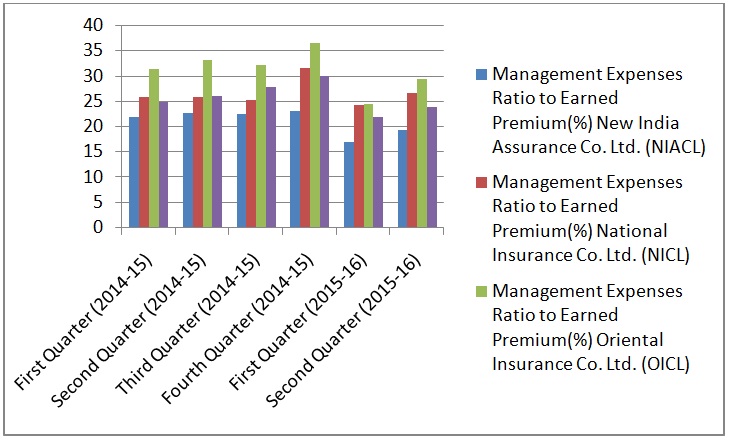
Management Expenses Ratio to Earned Premium: It is a ratio of expenses incurred on management and premium earned during the year. Higher ratio implies highest cost on management. Lower management ratio is better. Management expense ratio is found to be highest in case of OICL on an average, though it declined over the period of time. Almost all the companies’ management expenses ratios have come down, which indicates that there is a deliberate effort on part of companies to reduce managerial expenses. The least managerial expenses were observed in case of NIACL. It is even more significant in view of the fact that it has reduced over the period of six quarter under consideration for the purpose of the study.
|
Management Expenses Ratio to Earned Premium (%)
|
|
| |
|
Years
|
New India Assurance Co. Ltd. (NIACL)
|
National Insurance Co. Ltd. (NICL)
|
Oriental Insurance Co. Ltd. (OICL)
|
United India Insurance Co. Ltd. (UIICL)
|
|
|
First Quarter (2014-15)
|
21.81
|
25.86
|
31.31
|
24.83
|
|
|
Second Quarter (2014-15)
|
22.64
|
25.75
|
33.05
|
26.1
|
|
|
Third Quarter (2014-15)
|
22.49
|
25.29
|
32.15
|
27.76
|
|
|
Fourth Quarter (2014-15)
|
22.99
|
31.53
|
36.54
|
30.04
|
|
|
First Quarter (2015-16)
|
17.04
|
24.32
|
24.38
|
21.84
|
|
|
Second Quarter (2015-16)
|
19.24
|
26.59
|
29.44
|
23.81
|
|
|
CAGR
|
-2.07%
|
0.47%
|
-1.02%
|
-0.70%
|
|
|
Mean
|
21.04
|
26.56
|
31.15
|
25.73
|
|
|
S.D
|
2.38
|
2.55
|
4.06
|
2.91
|
|
|
CV
|
11.31
|
9.60
|
13.04
|
11.33
|
|
The following chart indicates a trend over the movements in the management cost over the six quarters. The line chart indicates that there is a declining trend as far as the management expense of these four general insurance companies is concerned.
Now we test whether there is significant difference in the Net Acquisition Cost Ratio on Earned Premium between the companies or not using a one way ANOVA as below:
|
One Way ANOVA Table for Management expenses to earned premium ratio
|
|
Source of Variation
|
SS
|
df
|
MS
|
F
|
P-value
|
F crit
|
|
Between Groups
|
308.7035
|
3
|
102.9012
|
11.08353
|
0.000168
|
3.098391
|
|
Within Groups
|
185.683
|
20
|
9.284152
|
|
|
|
|
|
|
|
|
|
|
|
|
Total
|
494.3865
|
23
|
|
|
|
|
Interpretation: As the calculated value (11.08353) is more than the critical value (3.238872) at 5% level of significance in the above Table, null hypothesis (H01) is rejected and hence it can be concluded that there is a significant difference in the management expenses to Earned Premium ratio between NIACL, NICL, UIICL and OICL. Hence, we can observe N the management expenses to Earned Premium ratio is significantly higher for OICL and significantly lower for NIACL over other public sector general insurance companies.
Findings and Conclusions
Based on the above data analysis, we can conclude on the performance of public sector general insurance companies in India in the following way:-
- Gross premium of NIACL was much higher than other companies, but on the basis of statistical test, it would not found to be significantly different. Hence, all four companies are doing well as far gross premium is concerned as can be seen from the CAGR which is above 15% for each of the company.
- Like gross premium, earned premium was much higher for NIACL but the difference was not found to be significant based on hypothesis testing. However, the growth as reflected by CAGR was highest in case of UIICL and least in case of OICL.
- Average Profit after tax at Rs 7 crores is much higher for NIACL as compared to second highest figure at 374.79 crores for UIICL. Further, it was found to be significantly different for all the companies. Hence, it was observed that there is a huge difference in the ability of the companies to earn profit. NICL was ranked last at 195.66 crores profit after tax on an average.
- Net Incurred Claim Ratio on Earned Premium was also highest for NIACL but the differences were not found to be significant.
- NIACL was spending highest on acquisition cost. It was found to be significantly higher than other companies.
- Management expenses were lowest for NIACL. It was also found to be significantly lower than other three companies.
- We can conclude that performance of NIACL was found to be very impressive based on the data of the six quarter under consideration for the purpose of the study.
References
Annual Reports of New India Assurance Co. Ltd. (NIACL)
Annual Reports of National Insurance Co. Ltd. (NICL)
Annual Reports of Oriental Insurance Co. Ltd. (OICL)
Annual Reports of United India Insurance Co. Ltd. (UIICL)
Bishnoi V and Sharan R (2007), "Health Insurance in India: Introspects and Prospects", The IUP Journal of Risk and Insurance, Vol. 4, No. 3, pp. 58-68.
Gupta I and Trivedi M (2005), "Health Care for All: The State of Voluntary Health Insurance in India", IRDA Journal, August, pp. 11-15.
Jawahar Lal (2006), "Indian Insurance – Market Scenario", in Kumar KBS (Ed.), Indian Insurance Environment Book, pp. 3-9, IUP, Hyderabad.
India 2010 – A Lloyd's View, The Indian Non life Market 2007, June, available at www.lloyd's.com/market intelligence
Sinha, R.P. (2007), "Productivity and Efficiency of Indian General Insurance Industry" The ICFAI Journal of Risk and Insurance, Vol. IV, No. 2, April, pp. 33-43.
Sinha, R.P. (2009), "Technical Efficiency of Indian General Insurance Companies: A Non-radial Approach", The ICFAI Journal of Risk and Insurance, Vol.VI, No. 1, pp. 16-29.
Verma V (2003), "Building Profitability in Auto Insurance", The Journal, July-December, pp. 52-71.
www.data.gov.in

