Efficiency
and Volatility of Foreign Exchange Market: Evidence from select exchange Rates
|
Gnyana Ranjan Bal
Assistant Professor
Department of Commerce
Guru Ghasidas Vishwavidyalaya
Bilaspur, Chhattisgarh-495009
Contact No.- +91-8109875791
Email: gnyana.friend@gmail.com
|
Dr. Budheshwar Prasad Singhraul
Assistant Professor
Department of Commerce
Guru Ghasidas Vishwavidyalaya, Bilaspur, C.G.
|
Abstract
The study attempts to test the random
walk behaviour and weak form efficiency of foreign exchange market. For this
purpose two exchange rates namely USD and YEN has been selected from April 2007
to Mar 2015. We have applied the Unit root and Variance ratio test to study the
random walk hypothesis. The findings shows the both the exchange rates do not exhibit
the random walk. Thus implies weak form of market inefficient. Further to analyze
the volatility clustering and persistence we have employed GARCH (1, 1). The results
show there is evidence of volatility clustering and persistence in case of both
the exchange rates. This type of study is highly relevant, as the healthy
functioning of foreign exchange market can lead to high economic growth.
Keywords:
Efficient Market Hypothesis, Volatility, Foreign Exchange Market, GARCH (1,1)
Introduction
In the past few decades the area of
market efficiency has received a significant attention of the both researchers
and academicians all over the world. Generally as per efficient market hypothesis,
the past informationcannot be utilized to predict the future returns in an
efficient market. In other words the past information are already been
reflected in present prices. The efficient market hypothesis can be three
typessuch as weak form of efficiency, Semi-strong and strong form of market
efficiency (Fama, 1970). Weak form of efficiency means the past prices related
information is useless i.e. the current price reflectsthe entire past price
information. In semi-strong form of efficiency the present price reflects all
past price related information as well as publically available information. The
strong form of market efficiency means the current prices reflect all the
public as well as non public information. In other word all the information are
useless even if the insider trading information. So nobody can make excess or
speculative profit in long run.
However,
the past studies have given mixed evidence in the context of market efficiency
in both stock and foreign exchange market. Like Barnes (1986) has shown
evidence of weak form of market efficiency in case of Kuala Lumpur stock
exchange. In another study Sharma and Seth (2011) haveanalyzed the impact of
global financial crisis on market efficiency. The study has taken both NSE and
BSE in two sub-periods (Pre and Post crisis). They did not find evidence of
weak form efficiency of Indian stock market. Also the study concluded that the results
are similar in both the period,so there is no impact of financial crisis on
market efficiency. Arora(2013) has tested the weak form of market efficiency
and random walk of Indian stock market. By taking the Nifty returns the study
conclude that Indian market rejects the weak form of market efficient
hypothesis.Chen (2008) has applied variance ratio test to study the random walk
hypothesis of Euro exchange rate. By taking the sample from January 1998 to
July 2008 the study conclude that Random walk cannot be rejected, thus the euro
exchange rate shows weak form of efficiency. Li and Liu (2012) have studied the
random walk in case of 34 MSCI country index. The study concluded that majority
of country are in weak form of efficient.
Charles and Darne(2009) studied the random walk behavior of major Euro
exchange rate. By applying Variance ratio test the study conclude that exchange
rates for major trading countries (such as Australia, Canada,Korea, Japan,New
Zealand, UK,USA, and Switzerland) follow a random walk hypothesis in case both
daily and weekly frequency data. But their findings are different for non major
trading currencies especially for Swedish Kroner. In overall among similar
studies in Indian market Rao and Shankaraiah (2003), Samanta (2004) and Sharma
andMahendru (2009) have supported weak form of efficiency. While the studies
like Guptaand Basu (2007),Choudhari (1991), Sharma and Seth (2011) and Arora
(2013) have rejected the random walk of market.
The
past literature shows that many of the studies have focused on the efficiency
of stock market, while very few studies have been made on foreign exchange
market. The present study attempts to test the random walk hypothesis and weak
form efficiency of foreign exchange market. We have selected two exchange rates
such as USD a nd YEN to study the random walk behavior of
foreign exchange market. In addition to this the study also analyses the
volatility clustering and persistence of the foreign exchange market.
Data
and Methodology
Two exchange rates namely USD and YEN has been taken for the
purpose of analysis. The study period ranges from April, 2007 to March, 2015.
The common samples in case of all the exchange rates have been selected to make
it standardized. The returns in case of both the exchange rates i.e. USDR and
YENR have been calculated as Ln (Pt/Pt-1),
here Pt price at t period and Pt-1 price at t-1
period and Ln natural log. The methodology of the study can explained as
follows.
1. Unit
root Test
The stationarity is one of the
underlying tests to study the random walk hypothesis. Stationarity of the data
means the mean and variance are constant over the period of time; that means
they are time invariant. In case of non-stationary the series will have time
varying mean and variance. This non-stationarity can be referred as unit root
problem. The random walk of exchange rates can be written as follows:
(1)
Here is exchange rate at t period, and exchange
rates at t-1 period, is a white noise error term. We know that a
series will be said to be random walk if value at t period is equal to its
value at t-1 period plus a random shock. In the equation (1), if ρ is significantly equal to 1,
then the stochastic variable is said to be having unit root.
In other case if then series can be said as stationary and does not follow a random
walk. The Unit root has been tested in the basis of Augmented Dickey Fuller
(ADF) and Phillips-Perron (PP).The ADF test consists of the following
regression:
Here
is pure white noise error term and, in ADF we test whether. Similariliy in Phillips-Perron use non-parametric statistical methods
to take care the serial correlations in the error terms without adding lagged
difference terms.
2. Variance
Ratio Test
The
variance ratio test of Lo and MacKinlay (1988) is based on the fact that if a
series follows a random walk in a finite sample then the variance increment is
linear in its data interval. The stochastic process with drift can be as
follows:
EXt=μ+EXt-1+εt
, (3)
Here is the drift
parameter, and expected value of error is zero. The restrictions in this imply,
error will grow linearly with time. The Variance Ratio VR (q) can be defined as:
VR (q) = (4)
Where is times the variance of - and is the variance of
The null hypothesis is that a time series or its first
difference follows a martingale difference sequence.
3. Volatility clustering and Spillover
We uses the ARCH
family models ARCH (Engel, 1982) and GARCH of Bollerslev (1986) to study the
volatility clustering and persistence. In the context of volatility standard
deviation is one of traditional crude measure of variance to assess
unconditional variance. While the GARCH is estimated to measure conditional
variance. The equation of GARCH model will be as follows assuming Exchange rate
can be represented by AR(1) process.
, (5)
In above equation (5) is the intercept, exchange rate respectively in t-1 period.
Similarly is the white noise error term of exchange
rate.
Results and Discussion
The figure-1 and figure-2 shows the
descriptive statistics of USDR and YENR respectively. We can see that the mean
of USDR is 0.000204 and Median is 0.000127. While the mean of YENR is 0.000202,
so it means the average return of USDR is more as compared to YENR. The
standard deviation of USDR is 0.005539 and YENR is 0.009496. The standard
deviation of YENR is greater than as of USDR, it indicates the YENR is more
volatile as compared to USDR. Both the USDR and YENR are positively skewed in
the sample period. Further to study the normalityJarque-bera has been tested.
In case both the exchange rates the Prob. is 0.0000 i.e. significant at 1%
level. So the null hypothesis of normality has been rejected, that is data are
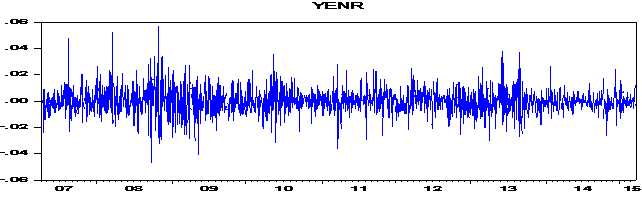
highly non-normal. Figure 3 and 4 shows the plot of return both the exchange
rates namely USDR and YENR. It can be observed that these exchange rates exhibit
some sort of volatility clustering.
Figure-1 Histogram and Descriptive
Statistics of USDR
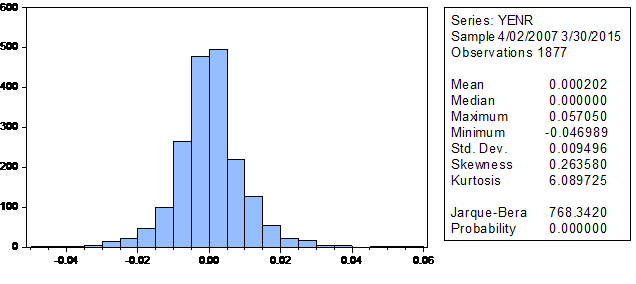
Figure-2 Histogram and Descriptive
Statistics of YENR/b<>
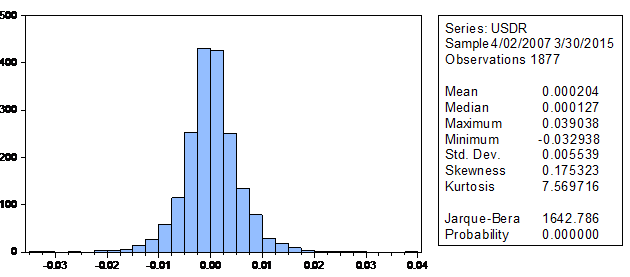
Figure 3: Plot of USDR
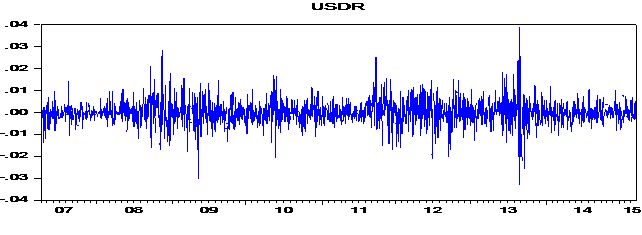
Figure 4:
Plot of YENR
1.
ADF and PP test:
To test the stationarity of data, unit root test has been
applied in basis of ADF and PP. As already been discussed stationarity means
the series does not contain unit root. The table 1 shows the results of Unit
root test on basis of ADF. The results shows that t-statistics is more than the
critical value. It indicates statistically significant, so the null hypothesisof
non-stationarity has been rejected. The USDR does not follow a random walk. The
result is similar in case of YENR, where also the null hypothesis has been
rejected. So YENR is stationary at level. Further the stationary has been
checked on the basis of PP. The does not vary as compared to ADF (see Table 2).
Both the USDR and YENR are stationary at level as the null hypothesis of
non-stationarity has been rejected. Thus the random walk hypothesis has been
rejected in case of both the exchange rates. This implies weak form inefficient
of these exchange rates.
Table
1: Augmented Dickey Fuller test
|
Variable
|
t –Statistics
|
Prob.
|
|
USDR
|
-31.61995***
|
0.0000
|
|
YENR
|
-42.31176***
|
0.0000
|
***indicates
significant @1% level
Table
2: Phillips-Perron Test
|
Variable
|
Adj.
t-statistics
|
Prob.
|
|
USDR
|
-40.78202***
|
0.0000
|
|
YENR
|
-42.30943***
|
0.0000
|
***indicates
significant @1% level
2.
Variance
Ratio Test
Further to verify the random walk hypothesis the
conventional variance test (Lo-Mackinlay, 1988) and the sign and rank test
(Wright, 2000) have been applied. The results of USDR have shown in table 3. We
can see that the all the variance ratios at different horizon of period are
statistically significant. Thus the null hypothesis has been rejected. It shows
USDR exhibitnon-random walk. Thus USDR is weak form of inefficient, as earlier
been observed in Unit root test.
Table 3 Variance
Ratio of USDR
|
Variance Ratio of USDR
|
|
Period
|
Var. Ratio
|
Rank Var. Ratio
|
Sign Var. Ratio
|
|
2
|
0.567421***
|
0.565437 ***
|
0.688699 ***
|
|
4
|
0.248658 ***
|
0.304772 ***
|
0.517591 ***
|
|
8
|
0.135856 ***
|
0.197216 ***
|
0.448294 ***
|
|
16
|
0.068313 ***
|
0.146277 ***
|
0.411381 ***
|
***indicates
significant @1% level
The results of YENR have shown in table 4. We
can see that at different lag all the variance ratios are statistically significant.
Thus the null hypothesis has been rejected. It shows YENR exhibitnon-random
walk. Thus YENR is weak form of inefficient, as earlier been observed in Unit
root test. The similar results have been observed in case of USDR in previous
table.
Table 4 Variance
Ratio of YENR
|
Variance Ratio of YENR
|
|
Period
|
Var. Ratio
|
Rank Var. Ratio
|
Sign Var. Ratio
|
|
2
|
0.524906 ***
|
0.576886 ***
|
0.703625 ***
|
|
4
|
0.250479 ***
|
0.312084 ***
|
0.529318 ***
|
|
8
|
0.129252 ***
|
0.185763 ***
|
0.453891 ***
|
|
16
|
0.066379 ***
|
0.141602 ***
|
0.418577 ***
|
***indicates
significant @1% level
3.
Volatility Clustering and Persistence
Further our study
applies the GARCH (1, 1) model to study the volatility of two exchange rates.
The results are presented in the following table 5 and 6 for both USDR and YENR
respectively. The results in table 5 signifythe coefficients of lagged squared
residuals and conditional variances are statistically significant. And also the
aggregate of this two is near to 1, so there is presence of both volatility
clustering and persistence in USDR. The GARCH (1, 1) results of YENR are
presented in table 6. The similar results also observed in case of YENR. The
aggregate of lagged squared residuals and conditional variances are near to 1
and both are statistically significant. So there is a presence of volatility
persistence.
Table
5: GARCH(1, 1) of USDR
|
GARCH of USDR
|
|
Parameters
|
Coefficient
|
Z-stat
|
P-Value
|
|
|
7.53
|
0.685428
|
0.4931
|
|
|
6.00
|
5.491459
|
0.0000
|
|
|
0.10123
|
9.658968
|
0.0000
|
|
|
0.881305
|
79.15431
|
0.0000
|
Table
6: GARCH (1, 1) of YENR
|
GARCH of YENR
|
|
Parameters
|
Coefficient
|
Z-stat
|
P-Value
|
|
|
-0.00013
|
-0.69389
|
0.4878
|
|
|
3.40
|
5.059509
|
0.0000
|
|
|
0.109688
|
8.689931
|
0.0000
|
|
|
0.853594
|
49.16145
|
0.0000
|
Conclusion
The studies in the context of weak form
of market are highly relevant with regards to usefulness of the past
information that is typically used in technical analysis, speculation and
arbitrage phenomenon. Also from the regulatory point of view this type of study
has significant implications, as the market inefficiency ensures the efficient
and optimal allocation of capital, savings and investment of the economy. This
is highly essential for a healthy economy growth.Our study concludes that the
foreign exchange market does not exhibit a random walk, so weak form of market inefficient.
So the usefulness of past information cannot be completely rejected. As in
inefficient market the future price can be predicted, one can earn abnormal
returns. This type of inefficiency may attract the investors in short run
because of excess return but in long run disturb the pricing phenomenon. As the
current price may not reflect all the past information’s, and lead to over and
under valuation.
References
Armeanu, D. S., & CioacĂ, S.
(2014). Testing the Efficient Market Hypothesis on the Romanian Capital Market.
Proceedings of The 8th International Management Conference “Management
Challenges For Sustainable Development”, November 6th -7th , 2014, Bucharest,
Romania Testing.
Arora, H. (2013). Testing Weak Form of Efficiency of Indian Stock Market. Pacific
Business Review International, 5(12), 16–23.
Barnes, P. (1986). Thin
Trading and Stock Market Efficiency: Case Study of the Kuala Lumpur Stock
Exchange. Journal of Business Finance & Accounting, 13(4), 609-617.
Bollerslev,
T. (1986).Generalized Autoregressive Conditional Heteroskedasticity, Journal of Econometrics, 31,307--327.
Brooks,
Chris(2008). .Introductory
Econometrics for Finance. Cambridge university press.
Charles, A., & Darné, O. (2009). Testing For Random Walk Behavior In
Euro Exchange Rates. Économie Internationale, 119, 25–45.
Chen, J. (2008). Variance Ratio Tests Of Random Walk Hypothesis Of The
Euro Exchange Rate. International Business & Economic Research Journal,
7(12), 97–106.
Chinhamu,
K., & Chikobvu, D. (2014). A Garch Model Test of the Random Walk
Hypothesis: Empirical Evidence from the Platinum Market. MJSS. http://dx.doi.org/10.5901/mjss.2014.v5n14p77.
Choudhari, S.K. (1991). Short Run Price Behaviour:
New Evidence on Weak Form of Market Efficiency. Vikalpa, 16(4), 17-21.
Dickey,
D. A.; Fuller, W. A. (1979). Distribution of the Estimators for Autoregressive
Time Series with a Unit Root. Journal
of the American Statistical Association, 74 (366):
427–431.doi:10.2307/2286348. JSTOR 2286348.
Enders, W. (2008). Applied
Econometric Time Series. Wiley, New Delhi.
Engel RF (1982).
Auto regressive conditional heteroskedasticityand estimates of the variance of
UK inflation. Econometrica50(4):987–1008.
Fama, E. (1965), Random Walks in Stock Market Prices, Financial Analyst Journal, 21(5), 55-59.
Fama,
E. (1970), Efficient Capital Markets:
A Review of Theory and Empirical Work, Journal of Finance, 25(2), 383-417.
Fama, E. (1991), Efficient Market Hypothesis: II, Journal of Finance, 46(5), 1515-1617.
Gupta, R. and Basu, P.K. (2007). Weak Form
Efficiency in Indian Stock Markets. International Business &
EconomicsResearch Journal, 6(3), 57-64.
Harrison, B. (2007). Do fat tails matter in GARCH estimation: testing
market efficiency in two transition economies. Economic Issues, 12(Part-2),
15–27. Retrieved from http://www.economicissues.org.uk/Files/207Harrison.pdf
Jain, Kapil and Jain, P. (2013). Empirical Study of the Weak Form of EMH
on Indian Stock Market. International Journal of Management and Social
Science Research, 2(11), 52–59.
Li, B., & Liu, B. (2012). A Variance-Ratio Test of Random Walk in
International Stock Markets. The Empirical Economic Letters, 11(8).
Lo, A.W. and Mackinlay, A.C. (1988). Stock Market
Prices Do Not Follow Random Walks: Evidence from a Simple Specification Test. Review
of Financial Studies, 1(1), 41-66.
Nisar, S. & Hanif, M. (2012). Testing Weak Form
of Efficient Market hypothesis: Empirical Evidence from South Asia. World
Applied Science Journal, 17 (4), 414-427.
Phillips,
P. C. B.; Perron, P. (1988). Testing for a Unit Root in Time Series
Regression. Biometrika, 75 (2):
335–346. doi:10.1093/biomet/75.2.335.
Rao, D.N. and Shankaraiah, K. (2003). Stock Market
Efficiency and Strategies for Developing GCC Financial Markets: A Case Study of
the Bahrain Stock Market. The Arab Bank Review, 5(2), 16-21.
Samanta, G.P. (2004). Evolving Weak-Form
Informational Efficiency of Indian Stock Market, Journal of Quantitative
Economics, 2(1), 66-75.
Sekar, P. C., & Arasu, B. S. (2007). Indian stock market efficiency
before and after the introduction of derivatives, Journal of Contemporary Research in Management(1), 139–154.
Sharma A.K. and Seth N.
(2011), Recent Financial Crisis and Market Efficiency: An Empirical Analysis of
Indian Stock Market, Indore Management
Journal, 2 (4), 27-39.
Sharma, G.D. and Mahendru, M. (2009). Efficiency
Hypothesis of the Stock Markets: A Case of Indian Securities. International
Journal of Business and Management, 4(3), 136-144.
Singh, B.-P., & Kumar, B. (2007). Variance Ratio Tests of the Random
Walk Hypothesis for Indian Stock Index Futures : Evidence from High
Frequency Data, (2002), 3–7. Retrieved from www.nseindia.com/content/press/NS_may2009_1.pdf.
Tiwari, A. K., & Mutascu, M. (2011). Economic Growth and FDI in Asia:
A Panel-Data Approach. Economic Analysis and Policy, 41(2), 173–187.
http://doi.org/10.1016/S0313-5926(11)50018-9.
Wright, J. H., 2000.Alternative
Variance-Ratio Tests Using Ranks and Signs, Journal
of Business and Economic Statistics, 18, 1-9.

