Measuring the Effects of Monetary Shocks on Superior
Industries Index in Capital Market of Iran
|
Zarifeh Jalili
Phd Student of Economics
Tarbiat Modares University
Tehran, Iran
|
Abbas Assari Arani
Assistant Professor of Economics
Tarbiat Modares University
Tehran, Iran
Email: Assari_a@modares.ac.ir
|
Kazem Yavari
Associate Professor of Economics
Tarbiat Modares University
Tehran, Iran
|
Hassan Heydari
Associate Professor of Economics
Tarbiat Modares University
Tehran, Iran
|
Abstract
The main purpose
of this study is analyzing the effect of monetary policies on stock exchange on
selected Top 10 Industries in Iran by using Structural Vector Auto Regressive
(SVAR) method and monthly data of 2005-2012. Obtained results using SVAR method
show that monetary policy has significant effect on
indices of Top 10 industries in the stock market. Moreover, monetary shocks
impulse respond function and the impact on index of top industries in stock
market are investigated. Obtained results show that monetary shocks have
different impacts on different industries. In general, obtained results show
that stock market can be considered as one asset market as a channel to
transfer effects of monetary policy.
Key
words: stock market, monetary policy, liquidity, interest
rate, loans, structural vector auto regressive (SVAR)
Introduction
Development of
capital market and banking system through increase in productive investment
opportunities, reduce transaction costs, reduce risks, mobilize savings,
increase transparency and facilitate the optimal allocation of resources can
lead to boom in production and economic growth. The interdependency between
asset price and monetary policy is one of the main issues of financial
economics, which has been especially considered after 2008, last financial
crisis of the world. Wide range studies are being conducted in field of
relationship between behavior of advanced stock market elements and monetary
policies, while this issue is remained almost unknown for the emerging markets
(Surial, 2002, p.3). Among different aspects of the interdependence,
effectiveness of monetary policy shocks on stock efficiency has been almost
considered more than other issues in theoretical literature. In Iran, according
to emergent of the capital market and on the other hand, because of bank-based
nature of financing system of majority of industrial groups, it is necessary to
conduct further studies in field of capital market indices, active groups and
especially top industries in this market and effects of monetary variables on
them in capital market of the country. It should be mentioned that
effectiveness of monetary policies and especially liquidity impulses on real
part of economics including investment, consumption and production are the most
important issues in field of implementing monetary policies and the active and
top industries in stock exchange can be the key and important axes in this
field. This effect could be created through a process that is called as the
transmission mechanism of monetary policy. In general, transmission mechanism
of monetary policy could be classified to 4 main classes including interest
rate channel, exchange rate channel, asset price channel and the credit
channel. Among the monetary policy transmission channels, asset price channel
plays key role. Effects of monetary policy on asset price could be transferred
through asset price channel and change in these prices to the economics
(Meshkin, 1996, p.7).
Theoretical framework
Over the years
and after emergence of financial crisis, effects of monetary policies on
financial markets have gained many attentions and its role has become brilliant
as a precondition for efficient markets. During recent financial crisis across
the world, Central banks have used wide range interferences of monetary
policies to create facilities in financial markets (Amador et al, 2013, p.50).
Monetary policy refers to a series of policies that follow macroeconomic goals
through changing interest rate and volume of money. One of the important
discussions in field of implementing monetary policies is its effectiveness.
Monetary officials should have exact evaluation of scheduling and effect of
monetary policies on the economics to be successful in this important field.
Therefore, it is necessary for them to identify mechanism, based on which
monetary policy affects economics and macroeconomic variables (Meshkin, 1996,
p.1). In this field, the most important affecting channels of monetary policy
and transferring its impacts are investigated. The channels are as follows:
1. Interest rate channel
Interest rate channel is the standard
direction of transferring monetary policy in view of Keynesians, so that
reduction of real interest rate can reduce capital cost and can increase also
investment expenses. As a result, total demand and input (product) is also
increased. Expansionary monetary policy that reduces short-term nominal
interest rate and increases liquidity in the society can also reduce short-tern
real interest rate and this is true under condition of dominance of rational
expectations. Lower real interest rates can increase capital of firms,
investments of domestic households, consumer durable expenses and capital
stock. All mentioned issues can also increase total output (Poddar, Tushar et al,
2006, pp.4-5).
2. Banks' loan channel
According to bank's loan channel,
restrictive monetary policy (such as increase in legal deposits or purchasing
commercial banks' reserve asset by central bank) can reduce usable deposits of
commercial banks. Moreover, tighter monetary policy can reduce attracting
deposits in commercial banks through affecting economic activities. These
factors can decrease supply of existing loans, especially allocated credit to
small firms. As a result, it can also affect investment activities in opposite
direction (Mukherjee et al, 2011, p.5).
3. Asset price channel
This channel includes 2 channels of
exchange rate and equity price channel:
- Exchange rate channel
Exchange rate channel has weak
cooperation and relationship with other channels. However, placing the exchange
rate besides loaning channel can result in expansion of effect of exchange rate
on the output. Moreover, exchange rate shows response to changes of short-term
rates of government bonds (Ghazanchyan, M, 2014, p.23). However, in countries
with flexible exchange rate, exchange rate channel can be a strong mechanism
for effects of monetary policy. Moreover, exchange rate can show more
transparent sign of monetary conditions in countries that time series
statistics of economics are not available easily (Mohanty, M.S, 2014, p.3).
- Equity price channel
There are two channels that are related
to equity price and are important in the discussion of transmission mechanism
of monetary policy. The two channels include Tobin's q theory in field of
investment and wealth effect on consumption. Tobin's q theory provides such
mechanism to affect monetary policy of economics through affecting corporate
asset value. Tobin defines q as market value of corporates that is distributed
by replacement cost of capital. If q is in high level, market value of
corporates is high compared to replacement cost of capital and the investment
equipment and machineries are also cheaper compared to market value of
commercial firms. As a result, companies can publish stocks and the price
received for it will be higher than machinery and equipment purchased by them.
Therefore, capital expenses would be increased, since companies can purchase
high volume of investment products through publishing small amount of stock.
Literature review
In this section, the relevant studies in
field of effects of monetary policies on stock market are investigated.
Ghosh (2009) has conducted a study in
India on investigating the effects of monetary policy on industries of this country
using VAR method and has found that different industries show different
responses to monetary shocks. Moreover, obtained results from the study showed
that response of industries is mainly related to difference in size of industry
and its intensity in using the capitals.
Amador et al (2013) have used SVAR model
for Euro zone and have conducted a study under the title of can monetary policy
determine liquidity of stocks? Obtained results from the study showed that
Expansionary monetary policy of European Central Bank could increase total
liquidity of stock market in Germany, France and Italy. Moreover, effect of
monetary policy on smaller stock markets has been significantly higher than
others and this refers to nonlinear effect of monetary policy on liquidity of
stock market (Amador, O et al, 2013).
Krainer (2014) has studied monetary
policy and bank credits in Euro Zone and has presented this question that is
there any stock market channel or interest rate channel in this field or not?
This study used non-nested hypothesis test, Test of omitted variables and
Granger causality tests and showed that central bank should try to make
monetary policies to achieve the target of economic stability and crediting by
banks and consider also changed in stock prices (Krainer, Robert E., 2014,
p.284).
Tsai (2014) has investigated effects of
monetary policy on stock returns under limited conditions of financing. The
research period has been 1999-2007. Obtained results showed that under
conditions that comments of Federal Reserve Monetary Committee are announced,
stock returns would significantly show response to sudden shocks of monetary
policy. The response would be in low level, when no announcement is taken
(Tsai, 2014, p.273).
Devtyan, Karen
(2016) has conducted a study under the title of distributive effects of
conventional and unconventional monetary policies using SVAR test and showed
that after financial crisis of 2008, many central banks reduces their policy
rates considerably and used Unconventional instruments of monetary policy.
Particularly, one of the executive samples of unconventional monetary policies
has been purchasing assets by Reserve Federal. The operations changed relative
supply of bonds and other assets and as a result, it could affect their prices
and the cash flow in economic system.
Gueriny, Pierre
and Danilo Leiva-Leonz (2016) have conducted a study under the title of effect
of monetary policy on stock returns in industries in the changing world and
used Factor-Augmented VAR (FAVAR) method to evaluate effects of unexpected
monetary policies on stock returns and showed that there is significant
difference among response of different industries on monetary shocks. Moreover,
the results of this study showed that to help understanding heterogeneity in
response to monetary shocks, industrial interdependence (measured by network
criteria) is important.
Keshavarz Haddad
and Mahdavi (2005) have also conducted a study under the title of "can
stock market in Iran economics be a channel to pass over monetary policy or
not". According to this study, through considering use of direct tools of
monetary policy, there is no indicator variable in economics of Iran to show
changes of monetary policy. Considering the mentioned limitations, the relationship
of conditional volatility, the conditional variance of stock returns and
conditional vitality of monetary variables is emphasized in this study. The
relationship between conditional vitality of variables is also measured using
bivariate vector autoregressive (VAR) method. Obtained results from the study
showed that stock market in Iran's economics is not a channel for monetary
transmission mechanism.
Shahbazi, Rezaei
and Abbasi (2012) have also used empirical evidence of Iran and have
investigated efficiency of stock market based on monetary policies. The desired
data of this study has been related to time period of 1999-2008. Analysis
method used in this study has been Autoregressive Distributed Lags (ARDL)
method. Obtained results from the study showed that current values of money
supply has significant and negative effect on current stock returns and hence,
the hypothesis of efficiency of stock market to monetary policies is confirmed.
Methodology
The general and
common method to explain the relationship between monetary policy (liquidity
impulses) and stock return behavior is to estimate Vector Autoregressive (VAR)
model for different monetary indices and stock return. In VAR models, Cholesky
decomposition is used to achieve impulse response functions. Cholesky
decomposition refers to a causal arrangement. Hence, if the purpose is to
investigate effects of more than one shock, it may be unacceptable. In this
study, to analyze effects of monetary shocks on stock market, SVAR model is
used. The main advantage of SVAR models compared to VAR models, in which
identification of structural impulses are implicitly and based on taste, is
existence of an economic logic based on economic theories to apply limitations.
In this study, to specify the model, SVAR model introduced by Lutkepohl (2005)
is used. Accordingly, effect of variables such as real interest rate (r),
Facilities granted to the private sector (l), real exchange rate (ex) and
liquidity (M2) are investigated using SVAR on efficiency of top 10 industries.
In terms of expansion of the subject and in line with facility of comparative
issues, this study is focused on effects of liquidity and its impulses.
Limitations can be applied in two forms of short-term and long-term. Applying
these limitations can be a basis to identify structural shocks.
In the above matrix, refers to shocks of
real interest rate of deposits in banking system; refers to shocks of granted facilities to the private sector; refers to exchange
rate shocks and refers to monetary
shocks. In this study, effects of these shocks on indices of top industries of
stock exchange are analyzed.
According to the4se shocks, the impulse respond
functions could be obtained and dynamic analysis of economic variables could be
done. In other words, for better analysis of impulses of monetary policy
through liquidity and analysis of short-term shocks and its relationship with
long-term shocks, impulse respond function (IRF) analysis is used.
1. Model estimations and data analysis
Granger causality test
In line with determining endogeneity of variables,
the method selected in this study is Granger Causality Test considered for
variables of indices of top 10 industries, liquidity, nominal exchange rate,
granted facilities to private sector and real interest rate (table 1). The
arrangement of endogeneity of variables based on results of the mentioned test
is as follows:
P… M2 ex
l r
Table
1: results of Granger Causality Test to determine arrangement of variable
endogeniety
|
Pairwise
Granger Causality Tests
|
|
Date:
06/21/15 Time: 15:43
|
|
Sample:
1384M01 1392M12
|
|
Lags:
2
|
|
|
|
Null
Hypothesis:
|
Obs
|
F-Statistic
|
Prob.
|
|
r
does not Granger Cause M2
|
106
|
0.03546
|
0.9652
|
|
M2
does not Granger Cause r
|
0.10554
|
0.8999
|
|
|
|
|
|
|
L
does not Granger Cause M2
|
106
|
22.8857
|
6.E-09
|
|
M2
does not Granger Cause L
|
1.45849
|
0.2374
|
|
|
|
|
|
|
P
does not Granger Cause M2
|
106
|
5.13452
|
0.0075
|
|
M2
does not Granger Cause P
|
2.23036
|
0.1128
|
|
|
|
|
|
|
Ex
does not Granger Cause M2
|
106
|
3.31110
|
0.0405
|
|
M2
does not Granger Cause Ex
|
0.79548
|
0.4542
|
|
|
|
|
|
|
L
does not Granger Cause r
|
106
|
0.30970
|
0.7344
|
|
r
does not Granger Cause L
|
1.20615
|
0.3036
|
|
|
|
|
|
|
P
does not Granger Cause r
|
106
|
0.51454
|
0.5993
|
|
r
does not Granger Cause P
|
1.44762
|
0.2400
|
|
|
|
|
|
|
EX
does not Granger Cause R
|
106
|
8.65182
|
0.0003
|
|
R
does not Granger Cause EX
|
3.05201
|
0.0516
|
|
|
|
|
|
|
P
does not Granger Cause L
|
106
|
3.99420
|
0.0214
|
|
L
does not Granger Cause P
|
8.11249
|
0.0005
|
|
|
|
|
|
|
EX
does not Granger Cause L
|
106
|
0.79470
|
0.4545
|
|
L
does not Granger Cause EX
|
1.79528
|
0.1713
|
|
|
|
|
|
|
EX
does not Granger Cause P
|
106
|
3.76076
|
0.0266
|
|
P
does not Granger Cause EX
|
0.70701
|
0.4955
|
In other words,
index of top 10 industries has had highest endogeniety and after that,
liquidity, nominal exchange rate, facilities granted to private sector and real
interest rate have possessed next places. Accordingly, in different analyses,
the criterion of placement of variables is based on result of Granger causality
test.
2. Variable viability test
To determine
variable viability, generalized Dickey-Fuller test is used. Results of the
tests are presented in table 2. All variables are unviable in their level,
since their probability value is always higher than 0.05 and hence, H0 based on
existence of unit root can't be rejected and as a result, all variables have
unit root. Secondly, first difference of all variables is viable, since their
probability is entirely lower than 0.05 and hence, H0 based on existence of
unit root (unviability) is rejected and as a result, all variables are viable
in first level. Considering obtained results, it could be demonstrated that the
studied variables I (l) are accumulated and they can be estimated and tested in
form of VAR model.
Table 2: results of
generalized Dickey-Fuller test
|
Variable name
|
Critical values in level:
|
t-stat
|
Prob
|
|
10%
|
5%
|
1%
|
|
M2
|
Level
|
-2.58
|
-2.89
|
-3.49
|
-1.32
|
0.62
|
|
First order difference
|
-2.58
|
-2.89
|
-3.49
|
-9.88
|
0.00
|
|
p
…
|
Level
|
-2.58
|
-2.89
|
-3.49
|
1.02
|
0.99
|
|
First order difference
|
-2.58
|
-2.89
|
-3.49
|
-5.92
|
0.00
|
|
ex
|
Level
|
-2.58
|
-2.89
|
-3.49
|
0.32
|
0.98
|
|
First order difference
|
-2.58
|
-2.89
|
-3.49
|
-7.67
|
0.00
|
|
r
|
Level
|
-2.58
|
-2.89
|
-3.49
|
1.27
|
0.99
|
|
First order difference
|
-2.58
|
-2.89
|
-3.49
|
-7.12
|
0.00
|
|
l
|
Level
|
-2.58
|
-2.89
|
-3.49
|
-2.81
|
0.06
|
|
First order difference
|
-2.58
|
-2.89
|
-3.49
|
-10.73
|
0.00
|
Source: research findings using Eviews software
2.1.
Short-term SVAR model
and effects of monetary shocks on top industries index
Determining VAR lag order
To determine lag order in VAR model, different
criteria such as likelihood ratio (LR), final prediction error (FPE), Akaike
information criterion (AIC), Schwartz information criterion (SC) and
Hannan-Quinn information criterion (HQ) are used. In all cases of using the
criteria in this study, Akaike criterion is considered as practical criterion.
Accordingly, existence of a lag in VAR order is proved based on Akaike
criterion, since the highest value of Akaike is equal to 9.62 in terms of
absolute value, which can determine VAR order in level of 1 lag (table 3). This
test is true for top 10 industries.
Table 3: assessing and
determining VAR order
|
Endogenous variables
|
p…M2 ex l r
|
|
Lag
|
LR
|
FPE
|
AIC
|
CS
|
HQ
|
|
0
|
-
|
0.00
|
5.22
|
5.36
|
5.28
|
|
1
|
1448.72
|
-4.81
|
-9.62*
|
-8.45*
|
-8.91*
|
|
2
|
67.18*
|
-5.35*
|
-9.47
|
-8.06
|
-8.89
|
|
3
|
26.34
|
-0.47
|
-9.28
|
-7.24
|
-8.46
|
|
4
|
26.24
|
0.76
|
-9.11
|
-6.43
|
-8.03
|
|
5
|
30.52
|
0.72
|
-9.03
|
-5.70
|
-5.70
|
Source:
research findings using Eviews software
2.2.
SVAR results and
effects of monetary shocks on top industry index
The results related to SVAR model for top 10
industries are presented in table 5 and the summary of the results of presented
in table 4.
Table 4: structural
effects of monetary shocks for top 10 exchange industries
|
Index
|
Coefficient of effects of liquidity shocks
|
Coefficients of effects of exchange rate shocks
|
Coefficients of effects of shocks in granted facilities
to private sector
|
Coefficient of effects of real interest rate shocks in
banking system
|
|
Pbank
|
0.03
|
0.001
|
-0.004
|
0.05
|
|
Pcmn
|
0.51
|
0.21
|
0.02
|
-2.61
|
|
Pcar
|
4.09
|
2.05
|
1.01
|
0.61
|
|
Pmd
|
0.85
|
0.18
|
0.24
|
0.23
|
|
Pchem
|
0.36
|
0.11
|
0.12
|
-0.54
|
|
Pmx
|
0.59
|
1.85
|
0.11
|
-0.29
|
|
Pmetl
|
0.13
|
0.11
|
0.61
|
-2.19
|
|
Pent
|
0.82
|
0.23
|
0.12
|
-5.32
|
|
Poil
|
1.29
|
0.17
|
0.8
|
-3.85
|
|
Pest
|
2.57
|
0.35
|
0.9
|
-6.39
|
Source:
research findings using Eviews software
In table 4, the indices are as follows: Pbank: index
of banks and credit institutes; Pcmn: cement industry index; Pcar: car and
assembly industry index; Pmd: multidisciplinary industry index; Pchem: chemicals
industry index; Pmx: metal excavation industry; Pmetl: fundamental metals
industry index; Pent: enterprise index; Poil: oil product and nuclear fuel
industry index; Pest: real estate and mass building industry index.
Table 5: results of
SVAR test
1) Pbank =0.03 M2(-1) +0.001EX
(-1)–0.004L (-1)+0.05 R (-1)
2) Pcmn =0.51M2(-1)+0.21EX
(-1)+0.02L(-1)-2.61 R (-1)
3) Pcar =4.09M2(-1)+2.05EX (-1)+1.01L(-1)-0.61 R (-1)
4) Pmd =0.85M2(-1)+0.18EX (-1)+0.24L(-1)-0.23 R (-1)
5) Pchem =0.36M2(-1)+0.11EX (-1)+0.12L(-1)-0.54R (-1)
6) Pmx =0.59M2(-1)+1.85EX(-1)+0.11L(-1)-0.29R(-1)
7) Pmetl =0.13M2(-1)+0.11EX(-1)+0.61L(-1)-2.19R(-1)
8) Pent =0.82M2(-1)+0.23EX (-1)+0.12L(-1)-5.32R (-1)
9) Poil =1.29M2(-1)+0.17EX
(-1)+0.80L(-1)-3.85R (-1)
10) Pest =2.57M2(-1)+0.35EX(-1)+0.91L(-1)-6.39R (-1)
|
According to
table 4:
-
In short-term,
expansionary policy can affect index of top 10 industries positively through
increasing liquidity (Reduction of legal reserves, injection of high-powered
money, reduce the penalty rate of the Central Bank and reduced the documents
discount rate by the Central Bank). Hence, Expansionary monetary policy
(restrictive) can have positive (negative) effect on index of top 10 industries
in terms of liquidity directly and in short-term.
-
Expansionary monetary
policy (restrictive) in field of facilities granted by banks can empower
(weaken) liquidity volume and can have positive (negative) effect in short-term
and indirectly on indices of cement, Lime & Plaster, car, multidisciplinary
industries, chemical industries, metal extraction, fundamental metals,
enterprises, oil products and nuclear fuel and mass building and can also
empower direct effect. However, in regard with exchange index of banks and
credit institutes, this effect is negative and neutralizes direct effect and
the overall effect of outcome of the two effects is not clear and is depended
on volume and amount of monetary shocks and granted facilities to private
sector (according to results of table 5).
-
In short-term,
liquidity, exchange nominal rate and facilities granted to private sector can
have positive effect on mass building and real estate and real interest rate
can have negative effect on the said index. Hence, as coefficient of real
interest rate is higher than total coefficient of other variables, it seems
that expansionary monetary policy (restrictive) can have positive (negative)
effect on mass building and real estate index in short-term.
-
In short-term, exchange
rates shocks can have negative effects on monetary policy; it means that shocks
resulted from exchange rate impulses can lead to turbulence of monetary policy
in short-term and such turbulence of monetary policy can lead to higher
turbulence in most studied exchange indices through restriction of liquidity.
-
In general, liquidity
and facilities granted to private sector can have positive effect on total
exchange index and also, exchange rate and real interest rate can have negative
effect on the said index.
-
In short-term,
liquidity, exchange rate and real interest rate and facilities granted by banks
can have positive effect on index of banks and credit institute group in
exchange.
-
Liquidity, nominal
exchange rate and facilities granted to private sector can have positive effect
on car industry and assembly index, cement, lime and plaster industry,
multidisciplinary industries, chemicals, enterprises, metal extraction, oil
products and nuclear fuel and real estate in short term. Also, real interest
rate of deposits has negative effect on the mentioned indices.
-
In field of facilities
granted by banks, expansionary monetary policy (restrictive) can empower
(weaken) volume of money and through this, it can have positive (negative)
effect on all exchange indices in short-term.
-
In short-term, monetary
policy shocks in regard with interest rate in case of expansionary policy
(increase in interest rate), it can enhance liquidity status (increase in bank
deposits) and as a result, it can improve all studied indices in stock
exchange.
As a result, expansionary monetary
policy resulted from increase in facilities granted to private sector can
empower exchange rate in short-term and through this, it can have positive but
small effect on bank and credit institute group index in stock exchange.
Restrictive monetary policy can worsen
status of granted facilities to private sector through increasing real interest
rate and through this; it can result in a little improvement in index of bank
and credit institute group in stock exchange. This shows that banks are not
significantly dependent on Revenues from credit facilities.
Testing normality of distribution of
residuals of SVAR model
Relevant results of normality of
distribution of residuals of SVAR model for top 10 industries in stock market
could be interpreted as follows:
a) As
probability of chi-square distribution in level of model residuals is more than
0.05, H0 based on no skew in distribution of residuals is related to SVAR model
of top 10 industries and distribution of the mentioned residuals has no
skewness.
b) As
probability of chi-square distribution among 5 variables is higher than 0.05,
H0 based on lack of skewness among residuals of vectors studied variables is
confirmed and hence, the relevant patterns of top 10 indices have not abnormal
skewness.
c) Total
distribution of the test based on Jarque-Bera criterion shows that probability
related to this distribution among 5 variables is higher than 0.05 and hence,
the H0 based on multivariate normal distribution of SVAR model for top 10 industries is confirmed. Hence,
the entire model is distributed normally.
2.3. Testing
lack of inequality of variances among residuals of variables
Obtained results from the Wite Test in
regard with inequality of variables of SVAR model for top 10 industries show
that (table 6):
a) Probability
of distribution of chi-square test with df of 300 is over 0.05 and hence, H0
based on no inequality among residuals of studied patterns is confirmed.
b) Although
there is inequality of variances among some residuals of variables, their
vector combination has no inequality of variance based on the results in
paragraph (a).
Table 6: results of total
correlation of inequality of variances
|
H0: lack of
cross terms
|
|
Df
|
Chi-square
(X2)
|
Prob
|
|
300
|
434.68
|
0.1125
|
Source: research findings using Eviews
software
2.4.
Variance decomposition
(VD) of SVAR model for indices of top 10 industries
Obtained results from the test in
variance decomposition section show that facilities granted to private sector
can have highest effect respectively in field of metal extraction, fundamental
metals, entire stock exchange, enterprises and cement. Real interest rate has
also showed highest effect during the study respectively in field of bank
indices, multidisciplinary industries and chemicals. Liquidity has had the
highest effect just in field of oil products index and exchange rate has had
the highest effect in field of car industry. Hence, the changes in facilities
granted to private sector and real interest rate have been the most important
factors affecting top exchange indices (table 7).
Table 7: summary of the results of
variance decomposition of monetary variables in top 10 industries
|
Monetary
variables of stock exchange indices
|
M2
|
L
|
R
|
Ex
|
|
Pbank
|
0.57
|
0.57
|
4.70
|
0.64
|
|
Pcmn
|
0.13
|
1.77
|
0.59
|
1.17
|
|
Pcar
|
0.10
|
1.45
|
0.11
|
3.93
|
|
Pmd
|
0.04
|
1.02
|
2.45
|
2.18
|
|
Pchem
|
0.04
|
1.02
|
2.44
|
2.18
|
|
Pmx
|
0.73
|
5.19
|
0.96
|
2.03
|
|
Pmetl
|
0.01
|
3.64
|
3.25
|
2.89
|
|
Pent
|
0.096
|
3.09
|
0.89
|
0.91
|
|
Poil
|
1.77
|
0.21
|
1.39
|
2.91
|
|
Pest
|
0.495
|
3.46
|
1.65
|
0.46
|
Source: calculations of the suthor
derived from Eviews
2.5.
Impulse respond
function analysis of SVAR model for top 10 industries
Impulse respond function (IRF) could be
presented structurally for bank and credit institute group index in stock
exchange according to the results in table 8 (diagrams 1-24):
Table 8: results of IRF test for
top 10 industries to one standard deviation monetary shock
|
Variable
period
|
Banks
|
Car
|
Multidisciplinary
|
Chemicals
|
Metal
extraction
|
Fundamental
metals
|
enterprises
|
Oil
|
Real estate
|
Cement
|
|
0
|
0
|
0
|
0
|
0
|
0
|
0
|
0
|
0
|
0
|
0
|
|
1
|
Positive and
Explosive
|
Positive
|
Positive
|
Negative and
Explosive
|
Negative and
Explosive
|
Negative and
explosive
|
Negative
|
Negative and
explosive
|
Positive
|
0
|
|
2
|
Negative and
explosive
|
Positive and
reductive
|
Positive and
reductive
|
Negative and
reductive
|
Negative and
reductive
|
Negative and
reductive
|
Negative and
reductive
|
Negative and
reductive
|
Negative and
explosive
|
Negative
|
|
3
|
Positive and
reductive
|
Constant
|
0
|
Positive and
reductive
|
Positive and
reductive
|
Negative and
reductive
|
Positive and
explosive
|
Positive and
explosive
|
Negative and
reductive
|
Negative and
reductive
|
|
4
|
Positive and
reductive
|
Positive and
reductive
|
0
|
Negative
|
Positive and
reductive
|
Negative and
reductive
|
0
|
Positive and
reductive
|
positive
|
Negative and
reductive
|
|
5
|
0
|
0
|
0
|
Negative and
reductive
|
Negative and
reductive
|
Negative and
reductive
|
0
|
Negative and
reductive
|
Positive and
reductive
|
0
|
|
6
|
0
|
0
|
0
|
Positive and
reductive
|
Positive and
reductive
|
0
|
0
|
Positive and
reductive
|
Negative and
reductive
|
0
|
|
7
|
0
|
0
|
0
|
00
|
0
|
0
|
0
|
Constant
|
0
|
0
|
|
8
|
0
|
0
|
0
|
0
|
0
|
0
|
0
|
Constant
|
0
|
0
|
|
9
|
0
|
0
|
0
|
0
|
0
|
0
|
0
|
Positive and
reductive
|
0
|
0
|
|
10
|
0
|
0
|
0
|
0
|
0
|
0
|
0
|
0
|
0
|
0
|
Source: research findings using Eviews
software
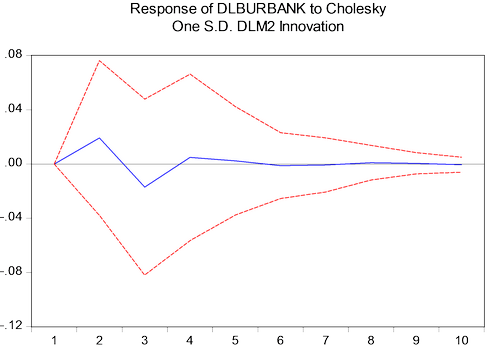
Figure 1: diagram of results of the
IFR of banks and credit institute index to monetary shocks
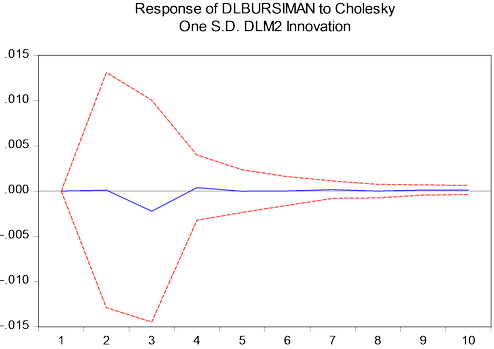
Figure 2: diagram of results of the
IFR of cement stock exchange index to monetary shocks
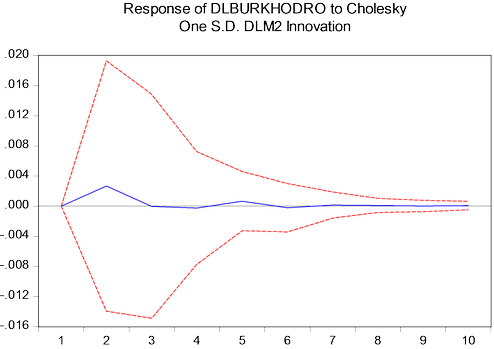
Figure 3: diagram of
results of the IFR of car industry stock exchange index to monetary shocks
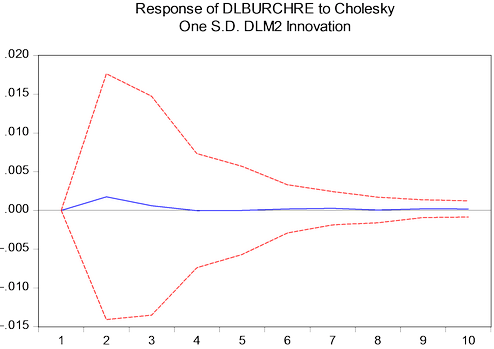
Figure 4: diagram of the IFR
results of multidisciplinary industry stock exchange index to monetary shocks
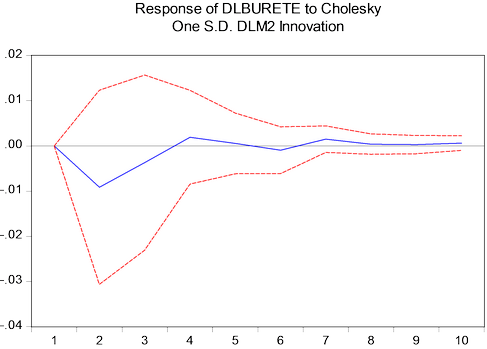
Figure 5: diagram of results of the
IFR of metal extraction industry stock exchange index to monetary shocks
Figure 6: diagram of results of the
IFR of fundamental metal industry stock exchange index to monetary shocks
Figure 7: diagram of results of the
IFR of enterprises stock exchange index to monetary shocks
Figure 8: diagram of results of the
IFR of oil product stock exchange index to monetary shocks
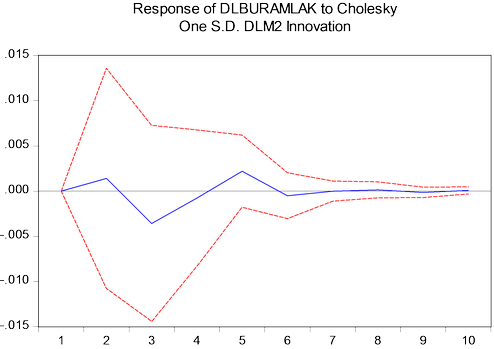
Figure 9: diagram of results of the
IFR of real estate stock exchange index to monetary shocks
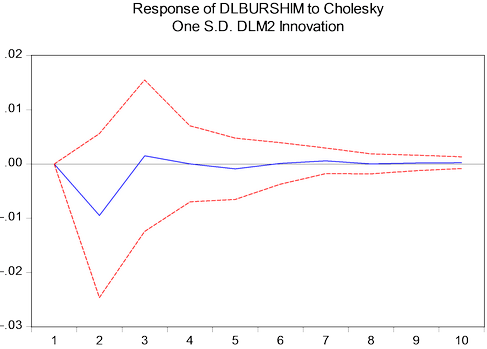
Figure 10: diagram of results of
the IFR of chemicals stock exchange index to monetary shocks
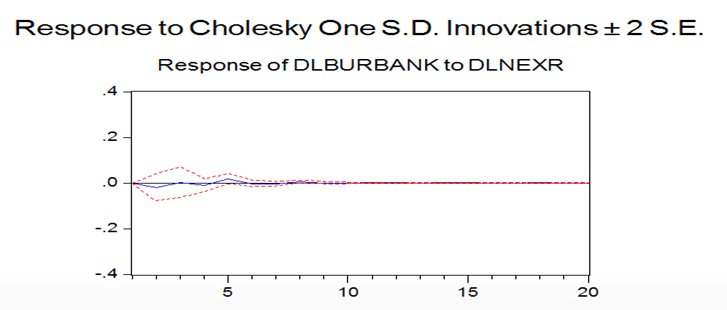
Figure 11: diagram of IFR of banks
and credit institute group index in stock exchange to monetary policy shock in
terms of exchange rate
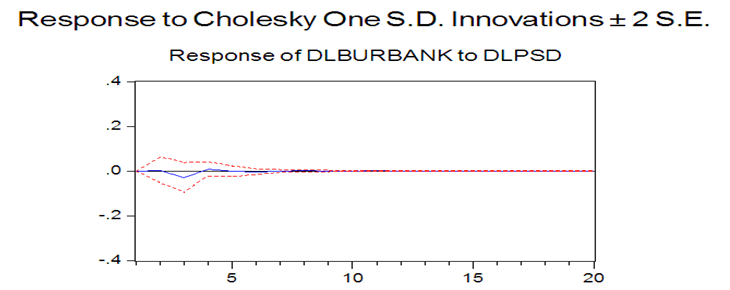
Figure 12: diagram of IFR of banks
and credit institute group index in stock exchange to monetary policy shock in
terms of grants
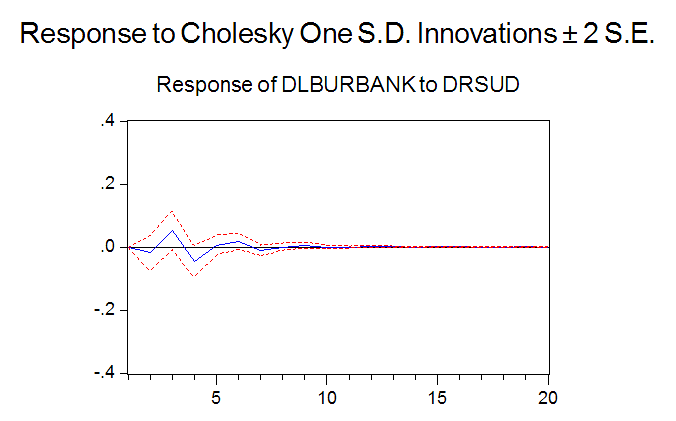
Figure 13: diagram of IFR of banks
and credit institute group index in stock exchange to monetary policy shock in
terms of real interest rate
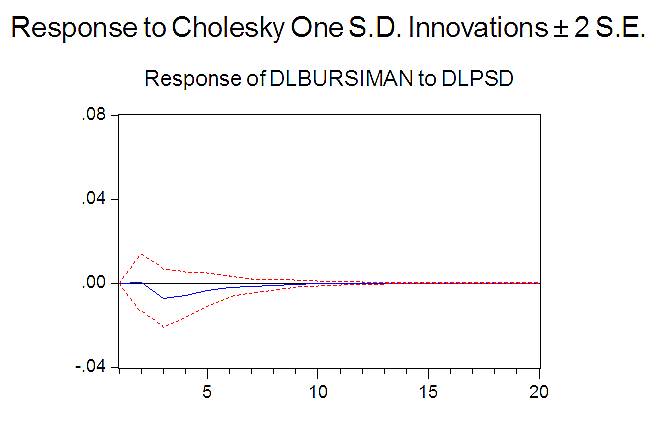
Figure 14: diagram of IFR of cement
group index in stock exchange to monetary policy shock in terms of grants
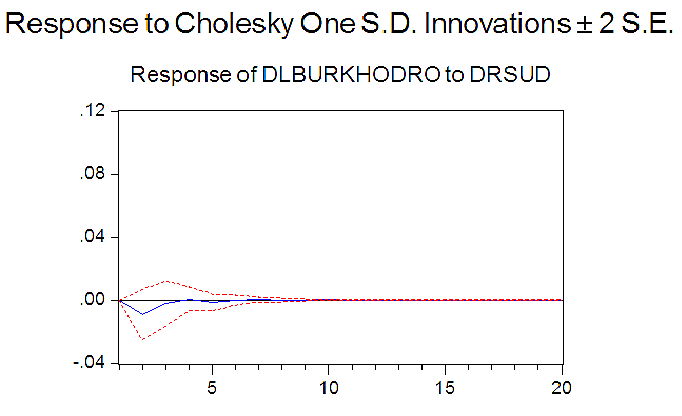
Figure 15: diagram of IFR of cement
group index in stock exchange to monetary policy shock in terms of real
interest rate
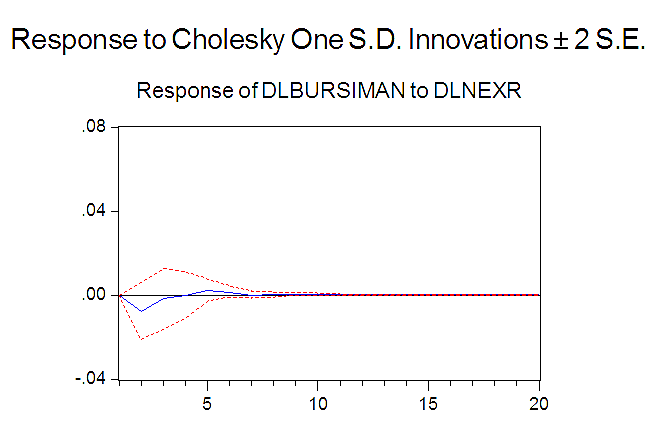
Figure 16: diagram of IFR of cement
group index in stock exchange to monetary policy shock in terms of exchange
rate
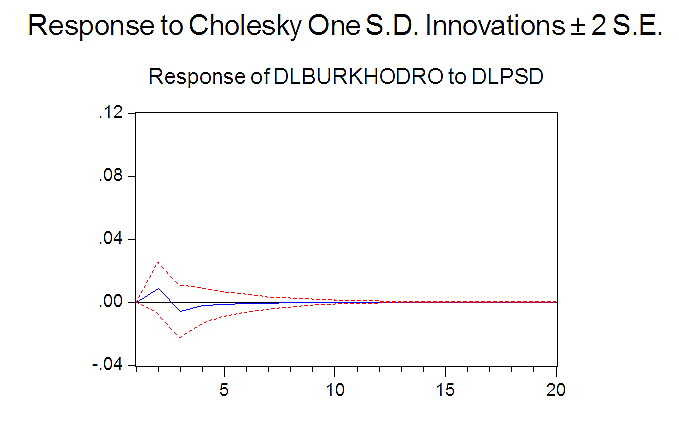
Figure 17: diagram of IFR of car
and assembly group index in stock exchange to monetary policy shock in terms of
grants
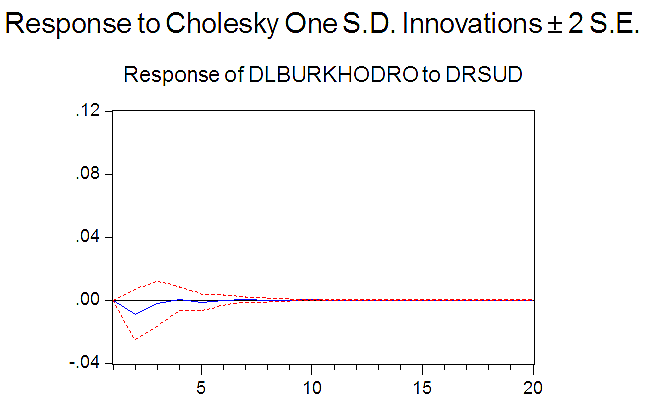
Figure 18: diagram of IFR of car
and assembly group index in stock exchange to monetary policy shock in terms of
real interest rate
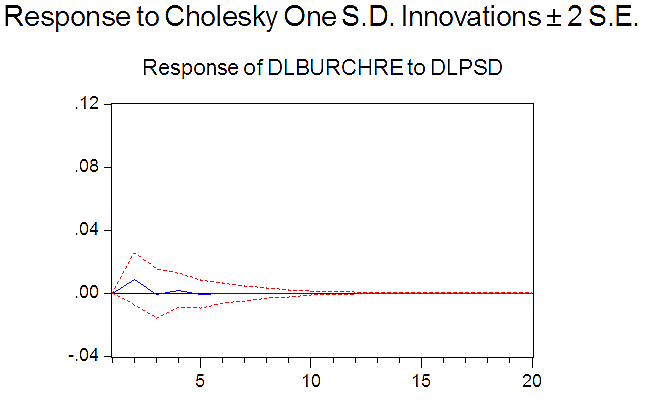
Figure 19: diagram of IFR of
multidisciplinary industries group index in stock exchange to monetary policy
shock in terms of grants
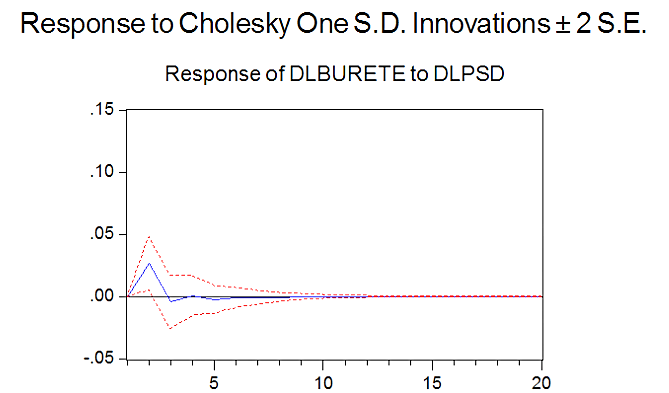
Figure 20: diagram of IFR of metal
extraction group index in stock exchange to monetary policy shock in terms of
grants
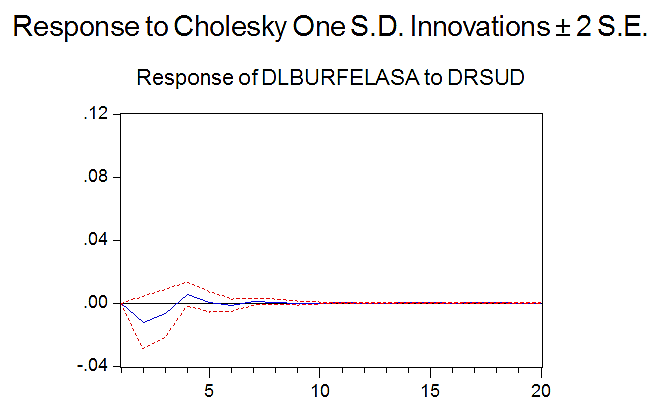
Figure 21: diagram of IFR of
fundamental metals group index in stock exchange to monetary policy shock in
terms of real interest rate
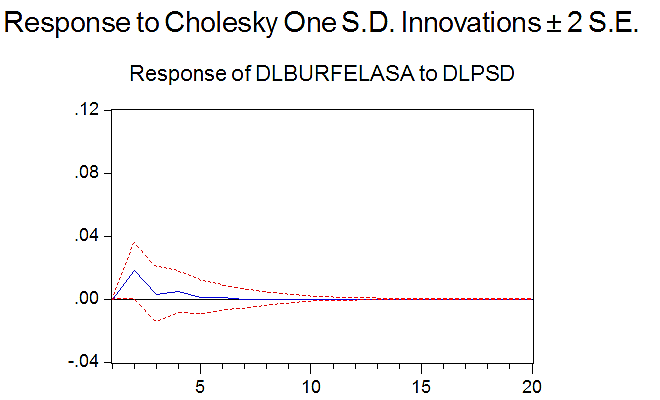
Figure 22: diagram of IFR of
fundamental metals group index in stock exchange to monetary policy shock in
terms of grants
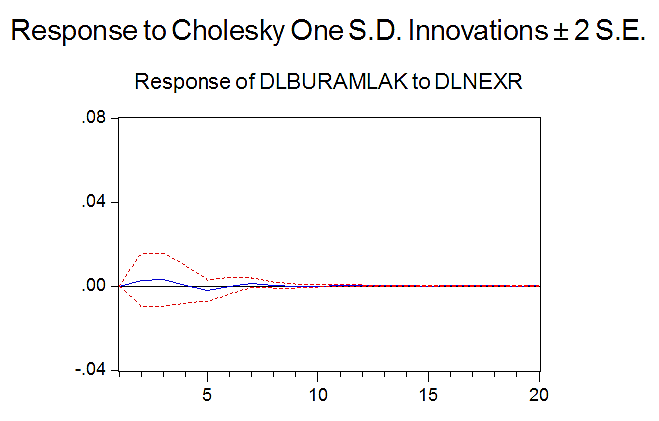
Figure 23: diagram of IFR of mass
building and real estate group index in stock exchange to monetary policy shock
in terms of exchange rate
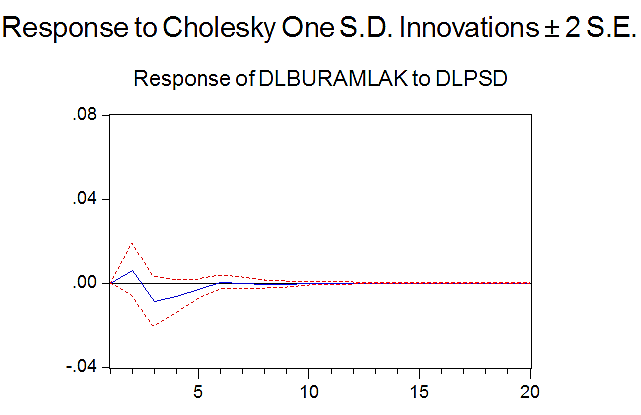
Figure 24: diagram of IFR of mass
building and real estate group index in stock exchange to monetary policy shock
in terms of grants
Conclusion
The interdependence of asset price and
monetary policy is the main issue of financial economics and has gained many
attentions especially after the last financial crisis of the world. Among
different aspects of the interdependence, effect of monetary policy shocks on
efficiency and stock index has been almost considered in theoretical literature
more than before. The literature could be divided to two groups:
a) Event
studies: these studies are based on descriptive method and can analyze
endogenous and unpredictable changes in monetary policy separately.
b) SVAR-based
studies, which apply some unique limitations that limit the interaction between
economic variables, so that they are not necessarily in consistence with the
data and backgrounds. The limitations are also divided to two types as follows:
1) Limitations
that introduce policy index and 2) limitations that specify method of
publishing monetary policy shocks.
Empirically, evaluation of effectiveness
of monetary policy transmission channels can result in better decision making
of Central bank through creation of a suitable insight. Monetary transmission
is a process, which can transfer monetary policy measures to economics and is
considered as an axial issue in macroeconomics. Structural features of
economics and financial markets can affect effectiveness of different channels
of monetary policy transmission. According to bank loaning channel,
expansionary monetary policy (such as increase in legal reserves or purchase of
reserve assets of commercial banks by Central Bank) can reduce usable reserves
of commercial banks. Moreover, controlled monetary policies can reduce
attraction of deposits in commercial banks through affecting economic
activities.
According to the mentioned, it could be
claimed that monetary policies can also affect stock market significantly. If
monetary policies affect real part of economics and as a result, affect prices,
monetary conditions of economics can affect behavior of return of stock
exchange. Hence, stock market as capital market plays vital role in
transferring effects of monetary policies on different economic sectors.
The common method of making relationship
between monetary policy and market behavior is estimation of SVAR model of
different monetary indices and stock returns. VAR models present flexible and
suitable framework to control the movement direction of monetary policy
mechanism. However, the relevant issue of omitted variables can lead to a
fundamental bias in VAR estimations in field of monetary policy. In this field,
a basic solution is to use SVAR method, which can solve this problem. Sims and
Bernanke (1986) have suggested a method to model deviation terms based on
economic decompositions to solve this problem. This method is based on
estimation of the relations between structural deviations based on an economic
model, which is used in this study.
Total distribution of SVAR test based on
Jarque-Bera criterion shows that probability related to this distribution among
5 variables is over 0.05 and hence, the H0 based on multivariate normal
distribution of SVAR model for top 10 industries is confirmed. As a result, the
entire model is distributed normally.
Obtained results from IRF test also show
that the shock resulted from monetary policy during first period have no effect
on indices of exchange industries; although effects of this shock would be
appeared after second period. In this field, effects of monetary shock have
been explosive on some indices (chemicals, metal and oil extraction); have been
sinus explosive on some indices (bank and credit institute exchange index) and
have been negative (enterprises and cement industry) or positive (car,
multidisciplinary industries and real-estate) on some others. However, it could
be found that among the top 10 industries, the index of banks and credit
institutes industries, oil industries, chemical industry and metal industry
have been shocked more than other ones. This can be rooted in large portion of
oil sector in economics and effect of domestic and foreign fluctuations on it
and secondly, the relationship of monetary shocks and banking network resources
and thirdly, can be rooted in high dependence of metal extraction on banking
resources.
According to obtained results in field
of SVAR model, it could be found that shocks can firstly have the most effect
on monetary policies belonged to real interest rate and on real estate and mass
building index, so that 1% increase in real interest rate has affected the said
index more than 6% negatively. Secondly, liquidity shocks have had the most
effect on car exchange index and then on real estate and mass building index.
Thirdly, exchange rate has shown most effect on car industry. Hence, with 1%
increase in exchange rate, car stock exchange index is improved to more than
2%. Fourthly, effects of monetary policies in terms of grants to private sector
have had the most effect on car industry, oil and real estate industries.
Obtained results from IRF showed that
depending on type of monetary shock, total index of stock exchange and top
indices can show different responses, so that relevant shocks of grants to
private sector have had the most and the worst effect and monetary shock has
had least and shortest effect on the mentioned indices. Relevant investigations
of SVAR model show that in short-term, expansionary policy can affect index of
top 10 industries positively through increasing liquidity (Reduction of legal
reserves, injection of high-powered money, reduce the penalty rate of the
Central Bank and reduced the documents discount rate by the Central Bank).
Hence, Expansionary monetary policy (restrictive) can have positive (negative)
effect on index of top 10 industries in terms of liquidity directly and in
short-term. On the other hand, Expansionary monetary policy (restrictive) in
field of facilities granted by banks can empower (weaken) liquidity volume and
can have positive (negative) effect in short-term and indirectly on indices of
cement, Lime & Plaster, car, multidisciplinary industries, chemical
industries, metal extraction, fundamental metals, enterprises, oil products and
nuclear fuel and mass building and can also empower direct effect. However, in
regard with exchange index of banks and credit institutes, this effect is
negative and neutralizes direct effect and the overall effect of outcome of the
two effects is not clear and is depended on volume and amount of monetary
shocks and granted facilities to private sector.
According to the objectives of this
study, the hypothesis included: 1) monetary policy can affect efficiency of top
10 industries of Tehran Stock Exchange; 2) effect of monetary policy on stock
return of different industries varies depending on type of industry. According
to obtained results, it could be mentioned that firstly, monetary policy
(monetary shocks, shocks of grants to private sector and nominal interest rate)
can affect different stock exchange indices through creating shocks in nominal
exchange rate and real interest rate (by
inflation rate). Hence, hypothesis 1 is confirmed. Secondly, monetary policies
can affect different indices of stock exchange industries and this effect
varies depending on type of industry and hence, hypothesis 2 is also
confirmed.
References
1. Central
Bank of the Islamic Republic of Iran, (2015) various indicators.
2. Securities
and Exchange Organization, (2015) monthly statistical reports.
3. Shahbazi,
K, et al, (2012). Monetary and fiscal policies and performance of the stock
market: the empirical evidence in Iran. Knowledge of financial &
securities analysis, No. 20, pp 63-77.
4. Keshavarz,
H, et al, (2005), does the stock market a channel for passing the monetary
policy in the economy? Economic Research Journal, No. 71, pp 147-170.
5.
Amador, Fernandez,
Octavio & Martin, Gachter & Martin, Larch
and Georg, peter. (2013). Does monetary policy determine stock market
Liquidity? New evidence from the euro zone. Journal of Empirical Finance.
No. 21. pp (54–68).
6.
Central Bank of Japan.
(2011), the roles of Bank of Japan and its functions in monetary policy.
7.
Devtyan, Karen. (2016),
the Distributive Effects of Conventional and Unconventional Monetary Policies.
Institut de Recerca en Economia Aplicada Regional.
8.
Ghazanchyan, Manuk.
(2014). Unraveling the Monetary Policy transmission mechanism in Sri Lanka.
IMF working paper, No. 190.
9.
Ghosh, Saibal. (2009). Industry
Effects of Monetary Policy: Evidence from India. Reserve Bank of India.
10.
Gueriny, Pierre and
Danilo Leiva-Leonz (2016), “The Effects of Monetary Policy on Industry-level
Stock Returns in a Changing World”, Bank of Canada, pp-2-4.
11.
Krainer, Robert, E.
(2014). Monetary policy and bank lending in the Euro area: Is there a stock
market channel or an interestrate channel. Journal money and finance. No.
49. P (283-298).
12. Lutkepohl,
H. (2005). New Introduction to Multiple Time Series Analysis. Berlin:
Springer Verlag.
13.
Mishkin, Fredric.
(1996), the channels of Monetary Transmission: Lessons for monetary policy.
Combridge NBER working paper series, No. 5464.
14.
Mohanty M. S. (2014). The
transmission of unconventional monetary policy to the emerging markets.
Bank for International Settlements, 78, 1-24.
15.
Mukherjee, Sanchita and
Bhattacharya, Rina. (2011). Inflation targeting and monetary Mechanism in
emerging market economies. IMF working paper, No. 229.
16.
Poddar, Tushar&
Sab, Randa and Khachatryan, Hasmik. (2006), the monetary transmission
mechanism in Jordan, IMF working paper, No. 48.
17.
Sourial, Maged Shawky.
(2002). Monetary Policy and it impact on the Stock Market: The Egyptian Case.
Ministry of Economy & Foreign Trade. Cairo, Egypt, (202), 3916-991.
18.
Tsai, chun-Li. (2014). The
effects of monetary policy on stock returns: Financing constraints and
“informative” and “uninformative” FOMC statements. International Review of
economics and finance. No. 29, pp 273-290.

