Management Practices in Working Capital -A Comparative Study in NALCO Vs HINDALCO
|
Dr. Suman Kalyan Chaudhury
Faculty Member
P.G. Department of Business Administration
Berhmapur University
Odisha
|
Mr. Pramath Nath Acharya
Research Scholar
P.G. Department of Commerce
Berhampur, Odisha
|
Abstract
Working capital
management is important in financial management due to the fact that it plays
an essential role in keeping the wheels of a business enterprises running. The
business will not be able to carry on day to day activities without the
availability of adequate working capital. In a common way, managing of current
assets and current liability is called the Working Capital management. In any
business firm, whether it is trading or manufacturing business, the relevance
of working capital can never be overemphasised. Shortage of funds for working
capital has caused many businesses to fail and in many cases has retarded their
growth. Lack of efficient and effective utilisation of working capital leads to
earn low rate of return on capital employed or even compel sustain losses. In
other words, the efficiency of a business enterprise depends largely on its ability
to manage its working capital. However the requirement of working capital
varies from firm to firm. It is depending upon the nature of the business like
production policies, market conditions, seasonality of operations, conditions
of supplies etc. For manufacturing companies, working capital creates
challenges because supplier and production expenses frequently require payment
several months before goods are sold to customers. Aluminium companies, as a
part of manufacturing sector, are required to give emphasis in this regard. In
this context, it is an effort to accesses the practice of working capital
management in Nalco and Hindalco through some
hypothesis testing. In this paper, the authors’ try to analyse the working
capital management practices of NALCO and HINDALCO which would facilitate in
maximizing the firm’s value and the wealth of the shareholders.
Keywords: Working Capital Management,
Capital Insolvency, Liquidity, Ratios
Introduction
Working
capital is considered as a significant issue in financial decision-making. It
calls for appropriate financing investment. However, according to Sanger,
working capital has always been ignored in financial decision-making because it
involves investment and financing in short-term period. It also acts as a
restrain in financial performance, since it does not contribute directly to
Return on Stakeholders’ Equity (ROSE). The essential part in management of
working capital lies in maintaining its liquidity in day-to-day operation to
ensure smooth running of the business and meets its obligations or else it
would lead to operational insolvency. Managers must ensure that the firm
functioning is efficient and profitable. Further, there are high possibilities
of mismatch between current asset and current liability during this process. If
this happens and firm’s manager fails to manage it properly then it will affect
firm’s growth and profitability which will further escort to financial distress
and finally firms can go capital insolvency.
Aluminium Industry in India
Aluminum industry is one of the highly concentrated industry
in India and the top five companies in this sector offers a great share towards
the production of the country. With the increasing demand for aluminum in
India, the top players in this sector are also growing at a faster
pace. The fact is that production of Aluminum in India has presently outpaced
the demand for aluminum in the country. India holds the third place in the
aluminum production in the world and the country has a competence of producing
2.7 million tones (MTPA), which is nearly 5% of the total aluminum production
all over the world.
Table-1 Major Aluminium
Producing Countries
|
Countries
|
Production
in ‘000 t
|
|
2008
|
% of total
|
2014
|
% of total
|
|
China
|
13,695
|
34
|
21,481
|
43
|
|
Russia
|
4,191
|
10
|
3,712
|
7
|
|
Canada
|
3,124
|
8
|
756
|
2
|
|
USA
|
2,658
|
7
|
1,754
|
3
|
|
Australia
|
1,978
|
5
|
1,727
|
3
|
|
Brazil
|
1,661
|
4
|
1,684
|
3
|
|
Norway
|
1,383
|
3
|
1,195
|
2
|
|
India
|
1,348
|
3
|
3,958
|
8
|
|
Dubai
|
899
|
2
|
1026
|
2
|
|
Others
|
9,194
|
23
|
13,042
|
26
|
|
Total
|
40,131
|
100
|
50,335
|
100
|
Source:
http://aluminium-india.org/Worldscenario.php
Table-2 Major Aluminium Consuming Countries
|
Countries
|
Consumption in ‘000 t
|
|
2008
|
% of total
|
2014
|
% of total
|
|
China
|
12,604
|
34
|
22,088
|
44
|
|
USA
|
5,147
|
14
|
5,505
|
11
|
|
Japan
|
2,319
|
6
|
2,259
|
4
|
|
Germany
|
1,929
|
5
|
2,054
|
4
|
|
Middle East
|
1,459
|
4
|
2,030
|
4
|
|
India
|
1,089
|
3
|
3,800
|
8
|
|
Italy
|
951
|
3
|
869
|
2
|
|
South Korea
|
937
|
3
|
1297
|
3
|
|
Brazil
|
933
|
3
|
1,198
|
2
|
|
Others
|
10,051
|
24
|
9,551
|
19
|
|
Total
|
37,419
|
100
|
50,651
|
100
|
Source:
http://aluminium-india.org/Worldscenario.php
Aluminium plays a key role in the industrial development of India as it
serves as a basic input for most of the industries. Progressing in long way
since early fifties, India’s aluminium industry is well placed to explore
untapped demand potential. With a meagre production capacity of 5000 tonnes
(TPA) in fifties, the production of Indian aluminium industry has reached 3958000
tonnes as on 2014. Aluminium industry
in India, comparatively a recent origin, has progressed very fast and has been ranked
as 2nd largest producer of aluminium in the world after China. However, in India, the production of primary aluminium
was stagnated around the 1.6 to 1.7 million tonne mark for the last three years
as surge in the global demand.
Simililarly the table -2 signifes the global consumption of alumninium,whereas
Indian consumption satands at 3rd position with a consuption 3800000
tonnes next to China and USA. The aluminium consuption of China and USA is
22088000 tonnes and 5505000 tonnes respectively. The major users in the segment of aluminium consumption continues
to be automotive & transportation sector followed by building &
construction, packaging, consumer durables, electrical & electronics, industrial
and other applications including defence in indian domestic market.
Fig No-1 Primary Aluminium Production
in India
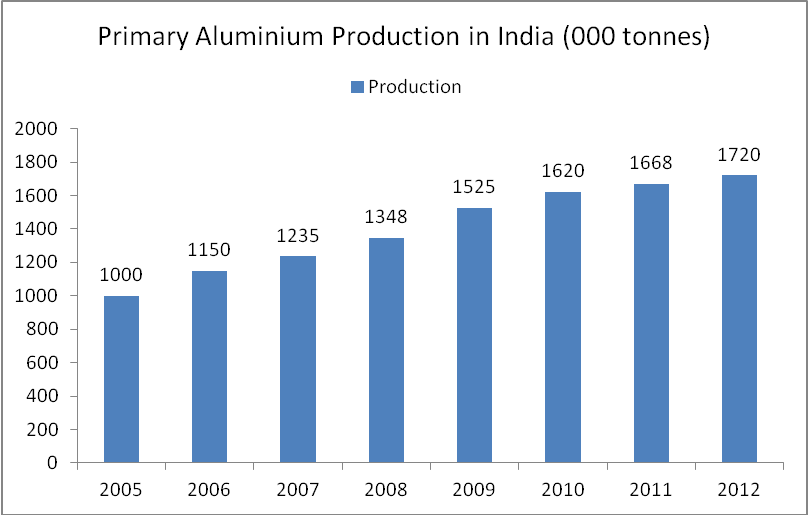
Source: Company Report/ MCG Research
Table-3
Production of Major Aluminium Players
|
Name of the Company
|
Production in Thousand Tonns
|
|
Year
|
2011-12
|
2012-13
|
2013-14
|
2014-15
|
|
HINDALCO
|
574
|
542
|
512
|
593
|
|
NALCO
|
413
|
403
|
316
|
244
|
|
VEDANTA
|
429
|
527
|
542
|
406
|
|
Total
|
1416
|
1472
|
1370
|
1243
|
Source: Press Information Bureau (PIB), Ministry of Mines,
Government of India.
Table-3
Sales of Major Aluminium Players
|
Sl. No
|
Name of the Company
|
2011-12
Sales in Cr’s
|
2012-13
Sales in Cr’s
|
2013-14 Sales in Cr’s
|
2014-15
Sales in Cr’s
|
|
01
|
HINDALCO
|
26596.78
|
26056.93
|
27850.93
|
34525.03
|
|
02
|
NALCO
|
6611.48
|
6916.48
|
6780.85
|
7382.81
|
|
03
|
VENDANTA
|
6513.45
|
2187.92
|
28536.53
|
32502.41
|
Source: Annual Reports
In India the
aluminium production is carried out by public sector as well as private sector
companies. A list of companies producing aluminium in India is given in table
no. 3. It can be observed from the table that Hindalco and Nalco have became
the largest players in this market. The three primary aluminum
producers, viz. Hindalco, Vedanta and Nalco have
expansion plans as well as greenfield projects that
should take the production to 2.5 to 3.0 million tonnes in the foreseeable
future.
Objective of Study
The study was
carried out with the objectives which are presented below:
- To
understand the concept of working capital management and its importance.
- To
understand the role and significance of various ratios related to working
capital.
- To
understand the working capital practices by NALCO and HINDALCO.
- To
determine whether there is any significant difference in various ratios of
working capital management between NALCO & HINDALCO.
Hypotheses of the Study
Based on the objectives as cited,
the following hypotheses were formulated for the study:
H01:
There is no significant difference between NALCO & HINDALCO with respect to
Current Ratio.
H02:
There is no significant difference between NALCO & HINDALCO with respect to
Quick Ratio.
H03:
There is no significant difference between NALCO & HINDALCO with respect to
Inventory Turnover ratio.
H04:
There is no significant difference between NALCO & HINDALCO with respect to Debtor Turnover Ratio.
H05:
There is no significant difference between NALCO & HINDALCO with respect to
Working Capital Turnover Ratio.
Research Methodology
The
study is carried out by considering NALCO & HINDALCO as the sample unit
which are among the largest Aluminium producers in India. The data collected
for this research was basically from secondary sources which include web
sources like www.moneycontrol.com and www.rediff.com/money data base for a
period of ten years i.e. 2004-05 to
2013-14. The collected was analysed by using statistical tools in Ms-Excel such
as Mean and Standard Deviation. To test the hypotheses, the researchers have
used t-test
to get the level of significance and draw inference for the study. The study
was carried out by developing and testing some hypotheses with respect to both
the companies.
Limitations of Study
In the course of
research certain problems were encountered which might had adverse effect on
the work. The study is based on the data collected from the secondary sources.
Time constraint is one of the most important limitations for the study. Limited
sample size is another problem where the result could not be generalised.
Data Analysis and Interpretation:
The analysis and
interpretation of the study are based on the parameters mentioned in the
methodology of the study. This section is divided in to two parts. The first
one makes the analysis of Trend in working capital and second part discusses
the testing of hypothesis.
Table
4 Gross Working Capital (in Rs.)
|
Years
|
NALCO
|
HINDALCO
|
|
Mar '05
|
1,861.83
|
4,476.43
|
|
Mar '06
|
3,346.65
|
7,315.07
|
|
Mar '07
|
5,044.95
|
7,846.17
|
|
Mar '08
|
5,103.21
|
7,926.26
|
|
Mar '09
|
4,605.57
|
7,824.24
|
|
Mar '10
|
5,333.42
|
8,962.11
|
|
Mar '11
|
6,213.33
|
10,904.79
|
|
Mar '12
|
7,469.73
|
12,869.15
|
|
Mar '13
|
7,206.08
|
15,433.66
|
|
Mar '14
|
7,742.79
|
16,530.55
|
Figure 2 Gross Working Capital
The above graph
shows the trend in gross working capital of NALCO and HINDALCO during the study
period. It can be observed that HINDALCO maintains higher level of working
capital comparing to NALCO. It shows positive trend after 2009 in HINDALCO
because the firm invested more in current assets. But in case of NALCO
fluctuation is noticed during the study period.
Testing of Hypotheses
The hypotheses
of the study have been tested by applying t-test
which is normally used to determine if two sets of data are significantly
different from each other with an assumption that the test statistics would
follow normal distribution. The t-test results
are depicted in the tables given below and suitable interpretations are made
accordingly.
Hypothesis
(H01): There is no significant difference
between NALCO & HINDALCO with respect to Current ratio.
Table 5 Current ratio
|
NALCO
|
HINDALCO
|
|
Mean
|
1.883
|
1.101
|
|
Variance
|
0.151756667
|
0.009987778
|
|
Observations
|
10
|
10
|
|
Pooled Variance
|
0.080872222
|
|
|
Hypothesized Mean Difference
|
0
|
|
|
Degree of freedom
|
18
|
|
|
t Stat
|
6.148824064*
|
|
|
P
|
0.000
|
|
|
t Critical
|
2.100922037
|
|
*1% level of significance
The above table-5
presents the current ratio of the both companies. Since the t- stat (calculated value) is greater
than t critical (tabulated value)
i.e. 6.14 > 2.11. The t stat values
are positive & significant at 1% level of significance. So the null
hypothesis will be rejected. Hence, there is a significant difference between NALCO
& HINDALCO in maintaining the current ratio. The mean value of current
ratio of NALCO is found to be better than mean value of HINDALCO during the
study period. The higher the ratio the better it will be in a position to meet
its current obligation easily. So NALCO’s position is good comparing to
HINDALCO.
Hypothesis
(H02): There is no significant difference
between NALCO & HINDALCO with respect to Quick ratio.
Table
6 Quick Ratio
|
|
NALCO
|
HINDALCO
|
|
Mean
|
1.541
|
0.628
|
|
Variance
|
0.14892111
|
0.0354178
|
|
Observations
|
10
|
10
|
|
Pooled Variance
|
0.09216944
|
|
|
Hypothesized Mean Difference
|
0
|
|
|
Degree of freedom
|
18
|
|
|
t Stat
|
6.72453556*
|
|
|
P
|
0.00
|
|
|
t Critical
|
2.10092204
|
|
*1%
level of significance
Here the calculated Table-6
presents the quick ratio of NALCO & HINDALCO. Since the t stat (calculated value) is greater
than t critical (tabulated value)
i.e. 6.72 > 2.11, the null hypothesis is rejected at 1% level of
significance. Hence there is a significant difference between NALCO and HINDALCO
in maintaining the quick ratio. Comparing the current ratio and quick ratio of
both the companies, it can be seen that HINDALCO has higher inventory position
as compared to NALCO. It is also found that the quick ratio of HINDALCO is less
than 1:1 which is considered as an ideal in a manufacturing Industry. This
means that the liquid assets of HINDALCO are not equal to its current
liabilities.
Hypothesis
(H03): There is no significant difference
between NALCO & HINDALCO with respect to Inventory turnover ratio.
Table
7 Inventory turnover ratio
|
|
NALCO
|
HINDALCO
|
|
Mean
|
8.247
|
3.809
|
|
Variance
|
14.78406778
|
0.469454444
|
|
Observations
|
10
|
10
|
|
Pooled Variance
|
7.626761111
|
|
|
Hypothesized Mean Difference
|
0
|
|
|
Degree of freedom
|
18
|
|
|
t Stat
|
3.593372405
|
|
|
p
|
0.002
|
|
|
t Critical
|
2.100922037
|
|
*1% level of significance
Inventory turnover ratio of the
firms are calculated and presented in Table-7. Since the t stat (calculated value) is greater than t critical (tabulated value) i.e. 3.59 > 2.11, the null
hypothesis is rejected at 1% level of significance. Hence there is a
significant difference between both the firms in maintaining the Inventory
turnover ratio. The higher the inventory turnover ratio, the better it is. As
compare to HINDALCO, NALCO shows higher inventory turnover ratio. This means
that NALCO is able to convert the inventory into finished stocks quickly.
Hypothesis
(H04): There is no significant
difference between NALCO and HINDALCO with respect to Debtor turnover ratio
Table
8 Debtor turnover ratio
|
NALCO
|
HINDALCO
|
|
Mean
|
77.221
|
15.539
|
|
Variance
|
2440.945
|
10.10492
|
|
Observations
|
10
|
10
|
|
Pooled Variance
|
1225.525
|
|
|
Hypothesized Mean Difference
|
0
|
|
|
Degree of freedom
|
18
|
|
|
t Stat
|
3.939874*
|
|
|
p
|
0.00096
|
|
|
t Critical
|
2.100922
|
|
*1% level of
significance
Debtor turnover ratio of the firms are calculated and presented in Table 8. Since
the t stat (calculated value) is
greater than t critical (tabulated
value) i.e. 3.93 > 2.11, the null hypothesis is rejected at 1% level of
significance. Hence there is a significant difference between both the firms in
maintaining the Debtor turnover ratio. In case of NALCO the mean debtor
turnover ratio is high whereas in case of HINDALCO it is low. This ratio
indicates the speed with which these debtors are collected that effects the
liquidity position of the firms. It is found from the above study that NALCO is
able to collect from the debtors quickly as compare to HINDALCO.
Hypothesis
(H05): There is no significant
difference between NALCO and HINDALCO with respect to Working Capital turnover
ratio.
Table 9 Working Capital turnover
ratio
|
|
NALCO
|
HINDALCO
|
|
Mean
|
0.6572073
|
1.665
|
|
Variance
|
0.028035634
|
0.054761111
|
|
Observations
|
10
|
10
|
|
Pooled
Variance
|
0.041398373
|
|
|
Hypothesized
Mean Difference
|
0
|
|
|
Degree of
freedom
|
18
|
|
|
t Stat
|
-11.07553*
|
|
|
P
|
0.00
|
|
|
t Critical
|
2.100922037
|
|
*1% level of significance
Here the calculated Table-9
presents the working capital turnover ratio of the both companies. Since the t stat (calculated value) is greater
than t critical (tabulated value)
i.e. 11.07 > 2.11, the null hypothesis is rejected at 1% level of
significance. Hence there is a significant difference between NALCO and HINDALCO
in maintaining the working capital turnover ratio. Working capital turnover
ratio shows the velocity or utilization of the working capital of the firm
during a year. A high working capital turnover ratio reflects the better
utilization of the working capital of the firm.
Findings and Conclusions
In the current
study it shows that the current ratio of NALCO is higher than HINDALCO. So it
will be in a position to meet with the current obligation easily. In case of
quick ratio HINDALCO has higher inventory position as compared to NALCO because
the quick ratio of the manufacturing industry is less than the ideal ratio i.e 1:1. Inventory
turnover ratio of NALCO is higher than HINDALCO which proves that NALCO is able
to convert the inventory into finished stock quickly. It can be concluded that NALCO
can meet the current obligation comfortably. With respect to debtor turnover
ratio it is found that NALCO is able to collect from the debtors quickly as
compare to HINDALCO. It is found from the working capital turnover ratio that HINDALCO
convert the overall working capital quickly into the finished stocks.
Working capital
management is a significant issue in firm’s corporate financial decision making
process which needs careful consideration. The present study move in this
regard that from the quick ratio it is found that the NALCO is maintaining
higher quick ratio of 1.5 against 1:1 which is an ideal ratio in manufacturing
industry. Hence NALCO should take necessary steps to reduce the cash
equivalence. When we analyse the both companies in these ratios such as i.e Current
Ratio, Quick Ratio, Inventory turnover Ratio, Debtor turnover Ratio, Working
capital turnover Ratio it is found that NALCO’s performance is better than HINDALCO.
References
[1] Agrawal, A.
(2011), How to Manage Working Capital: An Empirical Study of Maruti Suzuki India Limited, Journal of Accounting and
Finance, Apr-Sept, Vol.25, pp. 85-92.
[2] Annual Reports of NALCO 2004-05 to 2013-14.
[3] Achrya,P.N and Mahpatra,R.P (2013), Working Capital
Management: A case study of NALCO, Journal of Accounting and Finance, Vol.27 ,
No.2, pp.35-44.
[4] Bhatachrya,H (2011), Working Capital Management, PHI, New Delhi.
[5] Chandara, H. and Selvaraj, H. (2012), Working Capital management in selected
Indian Steel Companies, Indian journal of Finance, Vol.6, No.11, pp.5-15.
[6] Chandra P.,(2009), “Financial management”, Tata Mc Grow-Hill
Publishing Company Limited, 7 West Patel Nagar ,New Delhi – 110008.
[7] Mukhopadhyay. D.
(2004), “Working Capital Management in heavy engineering Firms.” The
Management Accountant, Vol.10, No.23, pp.115.
[8] Pandey, I.M (2006),“Financial Management”, Ninth Edition, Vikash
Publishing House, New Delhi.
[9] Singh, J.P. and Pandey, S. (2008), Impact
of Working capital Management in the profitability of HINDALCO Industries
Limited, The ICFAI University journal of
Financial Economics, Vol.VI, No.4, pp 62-72.
[10]
www.hindalco.co.in
[11]
www.moneycontrol.com
[12]
www.nalcoindia.co.in
[13]
www.rediffmoney.com

