A Refereed Monthly International Journal of Management
An Empirical analysis of Factors affecting the Loan Repayment Performance of Microfinance institutions
Author
|
Kashif beg
Faculty of Commerce
Aligarh Muslim University, Aligarh-202002 (India)
Address- Room no 24 MOF hostel, Sir Ziauddin hall, Amu, Aligarh-202002 (India)
E-mail- kashifbeg90@gmail.com
Phone- +91-8267850784
|
Hajam Abid Bashir
Faculty of management studies and research (FMSR),
Aligarh Muslim University, Aligarh-202002 (India)
Address- Room no 24 MOF hostel, Sir Ziauddin hall, Amu, Aligarh-202002 (India)
E-mail- sam19amu@gmail.com
Phone- +91-8439880813
|
Abstract
Andhra Pradesh Microfinance Crisis 2010 triggered by accounts of suicides, rising debt stress among over-indebted clients of some of India’s biggest microfinance institutions (MFIs): SKS Microfinance, Spandana, Share, and others. The Non-Performing Assets (NPAs) of Andhra MFIs were at an all-time high over 96 %. Thereby, smaller emerging MFIs shut down their business operations. This is a matter of concern for Microfinance sector and the causes of declining recovery rate to be analyzed. Therefore the important issue of rising Non-Performing Assets (NPAs) has been examined. The study used panel data over the period 2006 to 2013 withdrawn from MIX (Microfinance information Exchange) market of Andhra MFIs. The findings revealed that important determinants of loan repayment performance are yield on gross loan portfolio, average loan balance per borrower adjusted by GNI per capita, labour cost to assets ratio and percentage of female clients. Moreover, the findings revealed that increasing interest rates resulted in increasing loan delinquencies and increasing share of women borrower in loan portfolio reduces loan defaults.
Keywords: MFI’s, Non-Performing assets, Women borrowers, Microfinance crises 2010
Introduction
Microfinance in India has grown at tremendous pace in recent years, achieving significant outreach amongst the poor household across the country. According to the status of Microfinance report (2011-12), there are about 1,000 MFIs in the country working in various legal forms. The southern state of Andhra Pradesh accounts for about 30% of the credit extended by MFIs. Andhra Pradesh Microfinance crisis can be traced back in the year 2006 when state government in Krishna district closed down 57 branches of few smaller MFIs. The reason behind to close down these MFIs came because of the allegations of unethical collections, poor governance, usurious interest rates and profiteering (CGAP, 2010). There was an allegation that ten borrowers of MFIs in Krishna district commit suicide because they were unable to repay the loan taken from MFIs (Shylendra, 2006). Kaur and Dev (2013) mentioned that MFIs had to face the brunt of Act in 2010, for not learning a lesson from 2006 crisis and ignoring all the warnings related to high-interest rates and concentration of the activities in the region. Over-indebtedness in the Andhra Pradesh can be known from the fact in comparison to the national average of 7,700 crores, The average debt outstanding per household was Rs 5,000, (CGAP, 2010). The inability of the borrowers to pay such huge amount resulted in stress on the part of the borrowers and use of coercive methods by MFIs to recover the loan repayments which ultimately lead the borrowers to commit suicide. Government reports the death of 54 customers by suicide. Microfinance crisis 2010 endangered the existence and viability of operations of MFIs in India. Now a day’s MFIs are grappling with the issue of their sustainability. Enactment of Andhra Pradesh Microfinance Institutions (regulation of money lending) Acts 2010 stifled the operations of MFIs very badly. After the enactment of Act 2010, provisions related to loan repayment rates fall from 99% to 10% only. The crisis in the Microfinance sector has left MFIs like SHARE, ASMITHA, SPANDANA and FUTURE FINANCIAL SERVICES (FSS) with negative net worth (Business Standard, 13 sept, 2013). Gross loan portfolio reduced by 14 percent in 2011-12 and reduced to Rs 172 billion (Microscape, 2012). According to the status of Microfinance report 2011-12 in India, the gross nonperforming assets of SHGs increased from 4.72% as on March 2011 to 6.09% as on March 2012. According to the state of sector report (2012) out of 61 MFIs studied 11 registered negative returns on assets (ROA). Only 5 MFIs achieved the ROA above 5 percent. This is a matter of concern for Microfinance sector and the causes of declining recovery rate to be analyzed. This study is meant to determine the factors affecting loan delinquencies in context of Andhra Pradesh MFIs.
Literature Review
Bassem (2013) examined the relationship between MFIs governance and repayment performance. The empirical investigation is based on data of 250 MFIs from Mix market database from different countries. The portfolio at risk 30 days is used as a dependent variable and proxy for loan repayment performance and other firm-specific variables as independent variables. The results indicate that MFI’s size and use of individual level model improve the loan repayment performance. However, the MFIs age positively affects the percentage of portfolio at risk
Aseefa, Hermes and Meesters (2010) examined the effect of competition among MFIs on their performance. They used innovative approach by constructing Lerner index, they assessed the effect of increase competition on outreach, loan repayment performance and financial performance. The empirical investigation is based on datasets of 362 MFIs taken from MIX market database over the period 1995-2009. The study concluded that competition is negatively associated with outreach while it is positively associated with rising defaults. Increased competition is negatively associated with efficiency of MFIs.
Mosbah, Slama and Mostorakis(2008) in their paper identified determinants of loan repayment default phenomenon. Data of 30 MFIs is withdrawn from MIX (Microfinance information exchange) market database in MENA region. Their regression findings revealed that average loan balance per borrower and gross loan portfolio positively affects the portfolio at risk. Moreover, empirical findings confirm that higher percentage of female clients is associated with lower portfolio at risk.
Crabb& Keller (2006) in their empirical work used data of 37 MFIs studied over 12 quarters of individual trust bank and group lending model located in different countries. To determine how lending methodology contributes to loan repayment performance measured by using portfolio at risk 30 days. Their findings revealed that group lending methodologies reduce the risk in MFIs portfolios compared to individual loans. However, greater lending to women raises portfolio at risk.
- Research Objectives
The study is focused on achievement of following objectives:
- What are important determinants of loan delinquencies of Andhra Pradesh Microfinance institutions?
- To examine the Impact of increasing interest rates on loan delinquencies.
- To identify that woman borrowers are more reliable and have better reputation in terms of loan repayment performance.
- Data and Methodology
The study used financial data withdrawn from MIX market (Microfinance Information Exchange) database. This study used panel data of 10 Microfinance Institutions namely (AML, SHARE, SKS MICROFINANCE, SPANDANA, SWAWS, TRIDENT MICROFINANCE, AWS, INDUR MACS, SAADHANA AND SMSS) over the period 2005 to 2013. These institutions are representative of around 55% of total number of MFIs in Andhra Pradesh. The study used models of panel data (Pooled, Fixed effect and Random effect) to examine the relationship between variables and also to check consistency of results.
- Variables and their expected Hypothesis for Portfolio at risk model
This section states about definitions of independent variables and their expected hypothesis sign related to factors affecting Portfolio at risk model. Hypotheses of the study, In line with the main objective of the study, the researcher have developed the following hypotheses based on the theories and empirical studies discussed in literature related to Portfolio at risk.
5.1. Yield on gross loan portfolio
Stiglitz and Weiss (1981), Crombruggheet. al. (2008) and literature surveyed in Ahlin and Townsend (2007) found positive relationship between portfolio at risk and yield on gross loan portfolio. Economic theory also predicts positive relationship interest rate and portfolio at risk. Cull et. al. (2007) empirical findings revealed the different relationship between yield and portfolio at risk for different types lending methodologies. Kar (2010) observed the negative significant effect of interest rates on loan repayment and suggested that quality of loan portfolio deteriorates at relatively low-interest rates.
HP1: There is a significant positive relationship between the yield on gross loan portfolio and MFIs loan portfolios quality.
5.2. Average loan balance per borrower
Crabb and Keller (2006) empirical findings show that average loan size is insignificantly and negatively associated with portfolio at risk. Crombruggheet. al. (2008) observed no significant correlation between average loan size and portfolio at risk. Mosbahet. al. (2008) findings revealed average loan balance per borrower is insignificantly associated with portfolio at risk.
HP2: There is a significant negative relationship between Average loan balance per borrowers and MFIs loan portfolios quality.
5.3. Gross loan portfolio to total assets ratio
Cull et. al. (2007) empirical findings revealed loan to assets ratio is negatively associated with portfolio at risk and concluded that there is negative relationship between charging higher interest rates and having a large customer base. Kar (2010) found negative insignificant relationship between loan to assets ratio and portfolio at risk.
HP3: There is a significant positive or negative relationship between gross loan portfolio to total assets ratio and loan portfolios quality.
5.4. Labour cost to assets
Cull et. al. (2007) found significant and positive relationship between labour cost to assets and portfolio at risk. Kar (2010) findings revealed the insignificant relationship between labour cost to assets ratio and portfolio at risk.
HP4: There is a significant negative relationship between Labour cost to assets ratio of MFIs and MFIs loan portfolios quality.
5.5. Percentage of women borrowers
The percentage of loan extended to women is reliable indicator for measuring the depth of outreach of an MFI. Generally, by extending loan to women clients MFIs focus on the objective of women empowerment and poverty-fighting as women in developing countries perceived poorer than their male partner (Kar, 2010). Moreover, women borrowers perceived to be more reliable and have better reputation in terms of loan repayment performance. Therefore, the study supposes that women borrowers should negative affects portfolio at risk.
HP5: There is a significant negative relationship between the ratio of women borrowers and MFIs loan portfolios quality.
5.6. Age
Coleman and Osie (2008) found a negative relationship between age of MFIs and its performance. Bassem (2009) found that that the age of MFIs is negatively correlated with the default probability. Soltane (2009) found that MFI age is negatively correlated with loan defaults. Therefore, the study supposes that MFI age will positively affect the loan repayment performance.
HP6: There is a significant positive relationship between age of MFIs and MFIs loan portfolios quality
5.7. Size
Fama and French (1993) concluded that firm performance is negatively associated with the size of MFIs. However, Coleman and Osei (2008) and Bassem (2009) concluded that large MFIs have the ability to accommodate to enhance productivity through diversification of product or services. Therefore, the study supposes that size will be positively correlated with repayment performance.
HP7: There is a significant positive relationship between the size of MFIs and the MFIs loan portfolios quality.
Table 1: Definitions of the independent variable and their expected hypothesis sign related to factors affecting portfolio at risk model.
|
S/N.
|
Variable Standard Name
|
Description
|
Variable description as used in regression model
|
Expected effect on the Dependent variable (P30)
|
|
1.
|
Real Gross Portfolio Yield
|
(Yield on gross portfolio (nominal) - Inflation
rate) / (1+ Inflation rate)
|
YOGP
|
Positive
|
|
2.
|
Average loan balance per borrower to GNI per capita
|
(Average loan balance per borrower divided by GNI per capita)
|
ALBPBG
|
Negative
|
|
3.
|
Gross loan portfolio to total assets ratio
|
Gross loan portfolio/total assets
|
GLPTA
|
Positive or Negative
|
|
4.
|
Labour cost to assets
|
Personnel expenses/total assets
|
PEA
|
Negative
|
|
5.
|
Percentage of female Borrowers
|
Percentage of borrowers who are women.
|
POFB
|
Negative
|
|
6.
|
MFI AGE
|
Years since its establishment to when the evaluation is considered. It also measures thelength of its outreach.
|
AGE
|
Positive
|
|
7.
|
SIZE OF MFI
|
The size of MFIs measured by value of its Assets
|
l_ASS
|
Positive
|
Table 1 depicts the independent variables related to Portfolio at risk employed in the model. This table provides the description about variable standard name and its description column present the formula used for calculation of variable. Variable description as used in regression model depicts the abbreviated name of variables used in regression model. Finally expected effect on the dependent variable depicts the expected hypothesis relationship of independent variables with dependent variables based on the literature review of prior empirical studies and theories as discussed in literature review.
- Descriptive Statistics
Table 2 provides the descriptive statistics of all the variables used in the study over the period 2005-2013. All the dependent and independent variables have 76 observations in total. The measure or proxy for the size of microfinance institutions is the total assets and average loan balance per borrower is a measure for depth of outreach. Total assets and average loan balance per borrower are transformed into natural logarithm form.
Table 2: Descriptive statistics of dependent and independent variable
|
Descriptive Statistics of Dependent and Independent variables
|
|
Variable
|
Mean
|
Standard deviation
|
Minimum
|
Maximum
|
No. of Observations
|
|
FSS
|
0.657846
|
0.313578
|
0.0360245
|
1.78001
|
76
|
|
Oss
|
1.01925
|
0.422616
|
0.0415000
|
1.80040
|
76
|
|
albpbg
|
0.135682
|
0.0377198
|
0.0520000
|
0.253200
|
76
|
|
Yogp
|
0.109191
|
0.197436
|
0.130400
|
0.995400
|
76
|
|
Ccta
|
0.0705189
|
0.0574553
|
0.000800000
|
0.365500
|
76
|
|
Glpta
|
1.11314
|
0.997195
|
0.652800
|
8.91600
|
76
|
|
Pofb
|
0.989755
|
0.0250685
|
0.884900
|
1.00000
|
76
|
|
p30
|
0.192328
|
0.320923
|
0.000000
|
0.995400
|
76
|
|
Pea
|
0.0471257
|
0.0163077
|
0.0165000
|
0.0917000
|
76
|
|
l_ass
|
17.3295
|
1.99854
|
13.9942
|
20.6751
|
76
|
|
AGE
|
15.5263
|
5.37767
|
4.00000
|
27.0000
|
76
|
|
l_albpb
|
4.98210
|
0.241976
|
4.34381
|
5.45959
|
76
|
|
Albpb
|
149.947
|
35.3323
|
77.0000
|
235.000
|
76
|
Note: Fss = financial self-sufficiency ratio, Oss = Operational self-sufficiency ratio,
Albpbg = Average loan balance per borrower to gni per capita, Yogp = yield on gross loan portfolio to total assets ratio, Ccta = Capital cost to total assets ratio, Glpta = gross loan portfolio to total assets ratio, Pofb = Percentage of female borrowers, P30 = Portfolio at risk (30) days, Pea = Labour cost to total assets ratio, l_ass = Log of total assets (size), AGE = age of MFIs since its establishment, l_albpb = log of average loan balance per borrower, Albpb = Average loan balance per borrower.
- Multicollinearity
Before applying regression analysis technique, the multicollinearity between different dependent variables with independent variables is detected as reported in the Table (3). The analysis was meant to check the problem that variables are correlated or not. If variables were not correlated then using several simple regression variables or one each multiple regression models would provide similar results (Dougherty, 2007). Correlation analysis determines the problem of multicollinearity. If variables are correlated, regression provides biased result i.e. which are not accurate. The overall results of correlation analysis revealed that only few variables are highly correlated.
The problem of multicollinearity arises when there is high, but not perfect correlation between two or more explanatory variables. (Cameron and Trivedi, 2009; Wooldridge, 2006; Churchill and Iacobucci, 2005) reported that multicollinearity between explanatory variables reduces the efficiency of estimates. Another effect of multicollinearity is that small change in data causes wide swing in parameter estimates. However, multicollinearity tolerable limit is not well defined. Kennedy (2008) and Wooldridge (2006) suggest that there is no absolute correlation limit on the basis of which it can be concluded multicollinearity is a problem. He suggested that problem of multicollinearity arises if the total sample variation (SST) and the variance square of the respective variable are highly correlated. Hair et. al. (2006) reports that correlation coefficient (0.9) is acceptable and may not cause multicollinearity problem. Moreover, Kennedy (2008) suggests that correlation coefficient below 0.7 may not cause multicollinearity and coefficient above 0.7 lead to multicollinearity. Table 3 provides the result of multicollinearity between dependent and independent variables.
Multicollinearity results
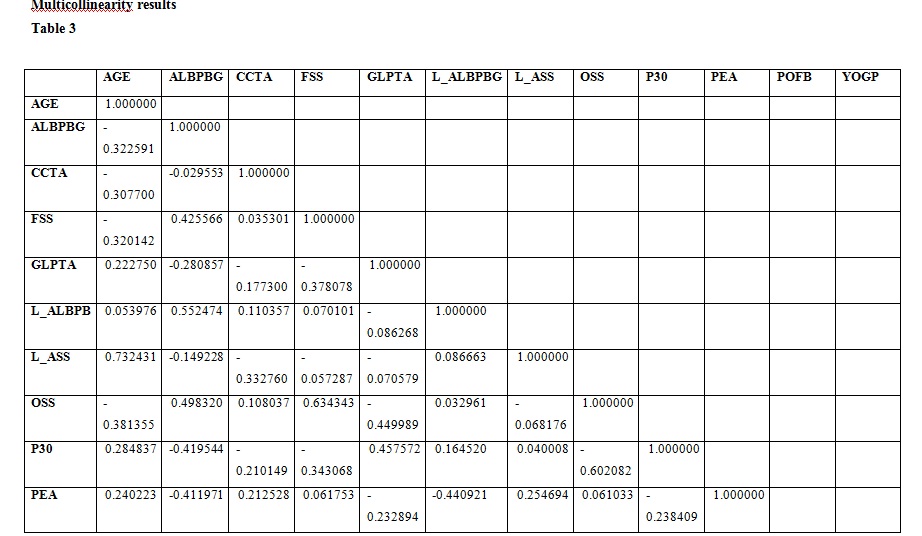
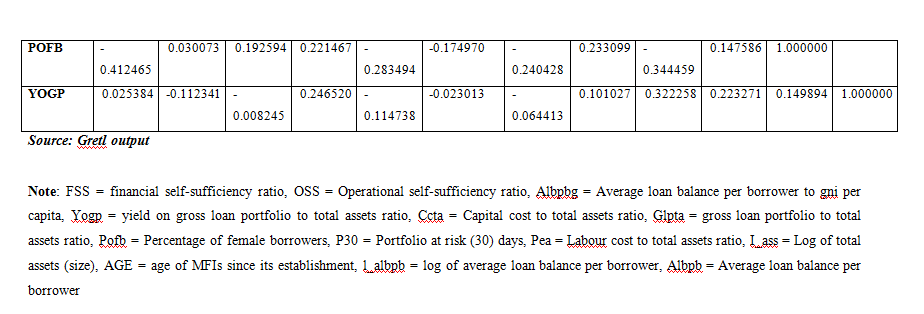
The result of the pair wise correlation is reported in Table no. (3).The results of correlation analysis show that all the variables except age and (l_ass) are below the threshold limit of (0.7). The result revealed that the variable age is highly correlated with size at (0.73). The study further computed variance inflation factor (VIF) for each coefficient to detect the culprit variable causing multicollinearity. Gujarati (2003) and Hair et. al. (2006) suggest that variance inflation factor above 10 causes multicollinearity. Following the Hair et. al. (2006) criteria of VIF. The results of variance inflation factor of all models are reported in Appendix (A). The VIF values of independent variables in all the models ranges from 1 to 3 i.e. within the threshold which point toward nonexistence of multicollinearity. It implies that regression coefficient will be fairly estimating the model.
Operational model for Portfolio at risk 30 Days (P30)
(P30) i,t= αi + β1 (YOGP) i,t+ β2 (ALBPBG)i,t + β3 (GLPTA)i,t + β4 (PEA)i,t+ β5 (POFB)i,t+ β6 (AGE)i,t + β7 (L_ASS)i,t+ εi,t
- Results of Portfolio at Risk model by Pooled OLS model, Fixed effect model and Random effect regression models
This section shows the result of factors affecting Portfolio at risk (P30) model by pooled OLS model, random effect model and fixed effect model. To check consistency, all the three models of panel data are employed. Finally, results and interpretations are based on a most appropriate model which is chosen on the basis of the result of F test to make a choice between pooled OLS and fixed effect model, Breusch pagan test to make a choice between pooled OLS and random effect model. Finally, Hausman test to make a choice between random and fixed effect model.
8.1. Summary of panel data
This section summarised the coefficients of econometric regressions (pooled, fixed and random)to facilitate an overall overview. The table 4 shows panel data regression for the year 2005-2013 with regression results of portfolio at risk (P30) on yield on gross loan portfolio (yogp), average loan balance per borrower adjusted by GNI per capita (albpbg) Gross loan portfolio to total assets ratio (glpta), labour cost to assets (pea), Percentage of female borrower (pofb), age of mfis in years (AGE), size of mfi-log Assets (l_ass).
Table (4) shows the results from pooled, fixed, and random models. The dependent variable is Portfolio at risk. According to the result of panel diagnostic command pooled OLS model is most appropriate and consistent than fixed effect and Random effect model. *, **, *** indicate significant at 10%, 5% and 1% level respectively. Figures that are in bold are p values. Figures in parenthesis are t values based on Robust (HAC) standard errors. Figures in brackets are coefficients.
Table 4 Model: Dependent variable: Portfolio at Risk (P30)
Included 10 cross-sectional units
Time-series length: minimum 5, maximum 9
Robust (HAC) standard errors
|
Variable
|
Pooled OLS regression model
|
Fixed effect regression model
|
Random effects regression
|
|
Const
|
(0.385589)
[2.9654]
0.00417***
|
(0.385589)
[0.8108]
0.42076
|
(0.803666)
[2.8880]
0.00519***
|
|
YOGP
|
(0.578711)
[4.0503]
0.00013***
|
(0.578711)
[3.1518]
0.00255***
|
(0.685151)
[5.4276]
0.00001***
|
|
ALBPBG
|
(-3.75632)
[-5.3822]
0.00001***
|
(-3.75632)
[-5.0482]
0.00001***
|
(-4.12839)
[-5.4553]
0.00001***
|
|
GLPTA
|
(0.0102105)
[1.4859]
0.00001***
|
(0.0102105)
[0.4426]
0.65964
|
(0.0552382)
[1.9361]
0.05702*
|
|
PEA
|
(-9.28711)
[-4.2896]
0.00006***
|
(-9.28711)
[-9.2954]
<0.00001***
|
(-9.39354)
[-5.2981]
0.00001***
|
|
POFB
|
(-6.86591)
[-3.1390]
0.00251***
|
(-6.86591)
[-5.9781]
0.00001***
|
(-2.94498)
[-2.9036]
0.00497***
|
|
AGE
|
(0.349701)
[1.1593]
0.25039
|
(0.349701)
[1.5622]
0.12358
|
(0.0784175)
[0.8453]
0.40089
|
|
L_ASS
|
(-0.018961)
[0.0664]
0.94722
|
(-0.018961)
[-0.9308]
0.35573
|
(0.000819632)
[0.0472]
0.96248
|
|
R- squared
|
0.643135
|
0.766323
|
0.643135
|
|
Adjusted R2
|
0.606399
|
0.702953
|
0.606399
|
|
F-statistics
|
17.50690
|
12.09285
|
17.50690
|
|
P-value (F)
|
4.84e-13
|
3.66e-13
|
0.000000
|
|
Durbin Watson
|
1.319928
|
1.944875
|
1.520716
|
Source: Gretl. Output
The study employed pooled OLS model, fixed effect model and Random effect model of panel data to check the consistency of results. Though, results and interpretation are based on most appropriate model which is determinedon the basis of result of F test, Breusch-pagan test and Hausman test. The result in Appendix (B) of panel diagnostic command for Portfolio at risk (P30) model shows that the F-statistic value is 1.499 with P value (0.168). It clearly shows that the corresponding P value of F-statistic is greater than the 0.05 (5%) level of significance. Thus, the null hypothesis articulated as (pooled OLS model) is more appropriate and consistent than the fixed effects model stands accepted. Secondly,Breusch-Pagan test is applied on P30 model to decide between pooled regression and random effects model. The LM statistic value is 0.082 with P value 0.773. As the P-value is much greater than the 5 % level of significance. Therefore, Null hypothesis articulated as pooled regression is more consistent and appropriate than the random effects model remains accepted. Finally, the choice between fixed effects and random effects tested through Hausman’s specification test. The null hypothesis is framed as the random effect is more appropriate and consistent with fixed effects model. The result of Hausman test in Appendix (B)for P30 model indicates that the lowp-value of 0.01 is much less than the 5% level of significance. A low p-value count against the random effects model is consistent, in favour of the fixed effect model. Hence, fixed effect is more consistent than the random effects model. Thus based on the panel diagnostic test in case of the portfolio at risk model revealed that pooled OLS is more consistent and appropriate than the Fixed effect and Random effect models. Therefore, results and interpretation for Portfolio at risk (P30) model are based on the Pooled OLS model.
The explanatory power (R2) for P30 model is 0.643 in the case of pooled OLS model. This reflects that 64% change in P30 model can be explained jointly by the given firm or MFIs specific factors; while the remaining 36% is attributed to the factors outside the model. In the case of fixed effect for P30 model explanatory power (R2)is 0.766 which reflects that 77% changes can be explained by the firm-specific determinants, while 23% is attributed to the factors outside the model. Moreover, the value of (R2) for P30 random effect model is 0.643 reflecting that 64 % change in P30 model is due to Firm-specific variable and remaining 36% is attributed to the factors outside the model.
- Findings and discussion of Portfolio at Risk model
The factors affecting repayment rates performance is examined by using portfolio at risk (30) days as dependent variable and independent variable as yield on gross loan portfolio, average loan balance per borrower adjusted by GNI per capita, Gross loan portfolio to total assets ratio, Labour cost to assets ratio, Percentage of female borrowers, Age of MFIs since its existence, Total Assets.
8.2.1. Yield on gross loan portfolio: The study determine whether higher interest rates are associated with rising loan defaults by using yield on grossloan portfolio a measure of interest rates. The econometric findings of regression analysis show that the coefficient is strongly significant at 1% level and positively associated with Portfolio at risk. It indicates that Yield on gross loan portfolio is an important indicator influencing loan repayment performance of Andhra microfinance institutions. The econometric result suggest that for one unit increase in Yield on gross loan portfolio i.e. interest rates, Portfolio at risk (30) days ratio is expected to increase by (0.68) units, holdings all other variable constant. It clearly indicates that increasing interest rates increases loan delinquencies. This findings is contrary to the findings of Kar(2010) their empirical findings show that yield on gross loan portfolio is negatively associated with portfolio at risk. The study of Cull et. al. (2007) found that loan delinquencies are more common for individual based lenders that charge high interest increasing rates as predicted by the theory. The finding of individual based lenders is similar to the result of positive association of yield on gross loan portfolio. However, the result contradict with the findings for solidarity and Village bank lenders MFIs. The finding do validate the alternative hypothesis articulated as yield on gross loan portfolio is positively associated with portfolio at risk.
8.2.2. Average loan size per borrower adjusted by GNI per capita: The average loan size (a measure of depth of outreach) is strongly significant and negatively associated with portfolio at risk in most appropriate model i.e. pooled model. This means that average loan size adjusted by GNI per capita is an important variable influencing loan repayment rates. It indicates that increasing average loan size sharply reduces loan delinquencies. Andhra microfinance institutions are performing better in terms of loan repayment performance when their average loan size is increasing. This finding is contrary to the findings of Kar (2010) whose empirical findings found that average loan size and portfolio at risk (30) days relationship is insignificant. In general, the empirical findings do validate the alternative hypothesis of negative relationship with portfolio at risk.
8.2.3. Gross loan portfolio to total assets ratio: The econometric findings of pooled OLS model show that the coefficient is positively and insignificantly associated with portfolio at risk. It means that gross loan portfolio to total assets ratio is not an important determinant of portfolio at risk. This finding is consistent with findings of Kar (2010) whose empirical findings showed that average loan balance (GNI adjusted) is an insignificant predictor of portfolio at risk. The results contradict withCull et. al. (2007) whose findings revealed that gross loan portfolio to total assets ratio is significantly and positively related to portfolio at risk. Therefore, on the basis of this finding, the null hypothesis framed as there is no significant relationship between gross loan portfolio to total assets ratio and portfolio at risk is accepted.
8.2.4. Labour cost to assets ratio: The result of regression analysis shows that the coefficient is highly significant and negatively associated with portfolio at risk. It means that the labour cost to assets ratio is an important variable influencing loan repayment rates of Seemandhra Microfinance institutions. It indicates that increasing labour cost to assets ratio reduces loan delinquencies of seemandhra microfinance institutions. This finding is contrary to the findings of Cull et. al. (2007) and Kar (2010) their empirical findings show that labour cost to assets is an insignificant predictor of portfolio at risk ratio. The empirical findings of regression do reject the alternative hypothesis of no significant association between portfolio at risk and labour cost to assets ratio.
8.2.5. Percentage of women borrowers: The percentage of women borrowers is a measure of depth of outreach since women in poor countries are considered poorest of poor in general. The result of regression analysis shows that the coefficient of percentage of women borrower is highly significant and negatively associated with portfolio at risk. It means that percentage of women borrowers is an important indicator influencing loan repayment rates. The empirical findings suggest that increasing share of women clients reduces loan delinquencies of Andhra microfinance institutions. This finding is in the line with Crombrugghe et. al. (2008) whose findings revealed that percentage of women borrower is significantly and negatively associated with portfolio at risk. However, this finding is contrary to the Kar (2010) whose findings show that the percentage of women clients is an insignificant predictor of portfolio at risk 30 days. Crabb and Keller (2006) empirical findings is contradictory with the findingof positive association. They concluded that greater lending to women consistently raises the risk of the portfolio. This finding does confirm the alternative hypothesis articulated as percentage of women borrowers is expected to be negatively associated with portfolio at risk.
8.2.6. Age (log value): The age of microfinance institutions refers to the period an MFI has been in operational since it came into existence. The result of regression analysis shows that the coefficient of age MFIs is insignificant and positively associated with portfolio at risk. It means that age is not a significant variable influencing portfolio at risk. This finding is consistent with the findings of Kar (2010); Nyamsogoro (2010); Cull et. al. (2006) and (2007) observed that age of an institution is an insignificant variable influencing portfolio at risk. This finding is also contrary to the findings of Crombrugghe et. al. (2008) found that age is significantly and negatively related to portfolio at risk. Therefore, on the basis of this finding the alternative hypothesis articulated as age of an institution is positively associated with portfolio at risk remains rejected.
8.2.7 Size: Log Assets is a proxy used for size of MFIs. The empirical findings of regression analysis show that the size of an MFI is insignificantly and positively related to portfolio at risk. This suggests that size of MFIs is not an important predictor influencing portfolio at risk of Andhra microfinance institutions. This finding is consistent with the findings of Cull et. al.. (2006) and (2007) and Nyamsogoro (2010) observed that size of an institution is an insignificant variable influencing portfolio at risk (30) days. In general, findings do reject the alternative hypothesis of positive association between size of MFIs and portfolio at risk.
- Conclusion
The study discusses about the loan repayment performance of MFIs in Andhra Pradesh. The inference is that the important determinants of loan repayment performance are yield on gross loan portfolio, average loan balance per borrower adjusted by GNI per capita, labour cost to assets ratio and percentage of female clients. The p value of these variables is strongly significant at 1% level. However, gross loan portfolio to total assets ratio, age and size are insignificant predictors of loan repayment performance. The findings that increasing interest rates are increasing loan delinquencies are consistent with Cull et. al.(2007) and contradicts with Kar (2010). The findings that increasing average loan size reduces loan delinquencies are contradictory with Kar (2010). The findings that heavily spending on labour cost is contrary to the findings of Cull et. al. (2007) and Kar (2010). The findings of women borrowers revealed that increasing share of woman clients reduces loan delinquencies. This finding is in line with Crombrugghe et. al. (2008). However, it contradicts with the findings of Kar (2010) and Crabb and Keller (2006).
- Limitations and Areas for Future research
- Further study may be conducted on considering MFIs geographical location, growth stages, MFIs product delivery methodology and Institution design.
- Further study may be conducted on considering longer time period and large sample size of MFIs. This study is confined to 10 MFIs of Andhra Pradesh.
- Researchers and Microfinance practitioners can focus on other aspects such as program sustainability and human resource sustainability.
- Findings of this study may not be applicable to other Microfinance institutions in other states of India.
- Findings of this study may not be applicable to microfinance institutions in other countries.
- This study do not cover all the Microfinance institutions in Andhra Pradesh because some MFIs do not report data to MIX market.
References
Ahlin, C., & Townsend, R. M. (2007). Using Repayment Data to Test across Models of Joint Liability Lending.The Economic Journal,117(517), F11-F51.
Assefa, E., Hermes, N., &Meesters, A. (2013). Competition and the performance of microfinance institutions.Applied Financial Economics, 23(9), 767-782.
Bassem, B. S. (2009). Governance and performance of microfinance institutions in Mediterranean countries.Journal of Business Economics and Management,10(1), 31-43.
Bassem, B. S. (2013). Governance Quality and MFIs Repayment Performance.Journal of Economic Cooperation & Development,34(2), 47.
Cameron, A. C., & Trivedi, P. K. (2009). Microeconomics using stata. College Station, TX: Stata Press Publications.
Churchill, G. A., &Iacobucci, D. (2005). Marketing research: methodological foundations, 9thedn. USA: Thomson south- western.
Coleman, A. K. and Osei, K. A. (2008). Outreach and profitability of microfinance institutions: the role of governance, Journal of Economic Studies, 35(3), 236-248.
Cull, R., &Demirgüç-Kunt, A.,Morduch J. (2006). Financial performance and outreach: a global analysis of leading microbanks.World Bank Policy Research Working Paper, (3827).
Cull, R., Demirgüç-Kunt A.&Morduch, J. (2007). Financial performance and outreach: a global analysis of leading microbanks.The Economic Journal,117(517), F107-F133.
Crabb, P. R., & Keller, T. (2006). A test of portfolio risk in microfinance institutions.Faith & economics,47(48), 25-39.
De Crombrugghe, A., Tenikue, M., &Sureda, J. (2008). Performance analysis for a sample of microfinance institutions in India.Annals of Public and Cooperative Economics,79(2), 269-299.
Dougherty, C. (2007).Introduction to econometrics. Oxford university press, USA.
Fama, E. F. and French K.R. (1993), Common risk factors in the returns on stocks and bonds, Journal of Financial Economics, 33, 3-56.
Gujarati, D. N. (2003). Basic Econometrics Fourth Edition. McGraw Hill.
Hair, J. F., Black, W. C., Babin, B. J., Anderson, R. E., &Tatham, R. L. (2006).Multivariate data analysis(Vol. 6). Upper Saddle River, NJ: Pearson Prentice Hall.
Kar, A. K. (2010). Sustainability and Mission Drift in Microfinance. (Unpublished doctoral dissertation). Haken School of Economics, Helsinki, Finland.
Kaur, P., & Dey, S. (2013). Andhra Pradesh Microfinance Crisis and its Repercussions on Microfinancing Activities in India.Global Journal of Management and Business Studies,3(7), 695-702.
Kennedy, P. A guide to econometrics. 2008. 6th edn. Malden: Blackwell Publishing.
Microfinance Institution Network. TheMicroscape2012. Retrieved from https://www.microfinancegateway.org/sites/default/files/mfg-en-paper-the-microscape-nov-2012.pdf.
Mosbah, E., Slama, M. M. B., &Mastorakis, N. (2008). Micro Finance Institutions’ behaviour: Determinants of portfolio quality in MENA region.Recent Advances on Finance Science and Management, 68-71. Retrieved from www.wseas.us/e-library/conferences/2015/Seoul/MF/MF-10.pdf.
NABARD. (2012). Status of the Microfinance Report 2011-2012. Retrieved from http://www.microfinancegateway.org/library/status-microfinance-india-2011-2012.
Nyamsogoro, G. D. (2010).Financial sustainability of rural microfinance institutions (MFIs) in Tanzania.(Doctoral dissertation, University of Greenwich).
Pradesh, A. (2010). Global Implications of the Crisis in Indian Microfinance.CGAP. November, 144.
Soltane, B. (2009). Governance and performance of microfinance institutions inmediterranean countries. Journal of Business Economics and Management 1, 31–43.
Shylendra, H. S. (2006). Microfinance institutions in Andhra Pradesh: crisis and diagnosis.Economic and Political Weekly, 1959-1963.Development,39(6), 938-948.
Stiglitz, J. E., & Weiss, A. (1981). Credit rationing in markets with imperfect information.The American economic review, 393-410.
Wooldridge, J. M. (2006) Introductory Econometric: A Modern Approach. International Student Edition, 3e, Canada: Thomson south- Western.
Appendix A
|
Model (P30)
|
Collinearity Statistics
|
|
Tolerance
|
VIF
|
|
1
|
(Constant)
|
|
|
|
yogp
|
.927
|
1.079
|
|
albpbg
|
.628
|
1.593
|
|
glpta
|
.704
|
1.421
|
|
pea
|
.609
|
1.642
|
|
pofb
|
.732
|
1.367
|
|
AGE
|
.437
|
2.288
|
|
ass
|
.515
|
1.941
|
|
|
|
|
|
|
|
|
|
|
Appendix B
Result of panel diagonostic test for P30 model
Joint significance of differing group means:F(9, 60) = 1.49967 with p-value 0.168956
(A low p-value counts against the null hypothesis that the pooled OLS modelis adequate, in favor of the fixed effects alternative.)
Breusch-Pagan test statistic:LM = 0.0829363 with p-value = prob(chi-square(1) > 0.0829363) = 0.773357
(A low p-value counts against the null hypothesis that the pooled OLS modelis adequate, in favor of the random effects alternative.)
Hausman test statistic: H = 15.8668 with p-value = prob(chi-square(6) > 15.8668) = 0.0144873
(A low p-value counts against the null hypothesis that the random effects model is consistent, in favor of the fixed effects model.)

