A Refereed Monthly International Journal of Management
STOCHASTIC DOMINANCE EFFICIENCY DUE TO OPTIONS IN THE PORTFOLIO
Author
|
Peeyush Bangur, presently working as Associate professor, Indore Institute of Management & research, Indore. Email peeyushsmbangur@rediffmail.com
Mob. No 09424582084
Manish Kant Arya, presently working as Associate professor, IMS, DAVV, Indore. Email maneesharya@gmail.com
Mob. No 09229569354
Ruchi Maheshwari, Research Scholar, DAVV, Indore.
Email ruchi.mba22@gmail.com
Mob. No 09479416561
TO SUDY THE STOCHASTIC DOMINANCE EFFICIENCY DUE TO OPTIONS IN THE PORTFOLIO
|
ABSTRACT:
In this paper we investigated the performance of different option strategies with help of mean variance criterion, capital asset pricing model and stochastic dominance models. The strategies we have used were necked strategy (pure stock strategy), writing out of the money covered call and buying in the money protective put. For this purpose we have chosen the 10 companies which were listed on the nifty (index of national stock exchange) during the data period. The data period starts from 1st April 2010 to 31st March 2014. Our results from MV criterion shows that due to presence of leverage effect and excessive gain the mean return was increased after the introduction of ITM protective put and OTM covered call and concluded that these strategies dominate one another by MV criterion. Further we have applied the systematic risk coefficient, Sharpe ratio, and Treynor and Jensen indices for the measurement of results through the CAPM and concluded that, ITM protective put was superior to OTM covered call and necked strategy. While both hedge strategy were superior to pure stock strategy. In the end we analysed the dominancy performance of the strategies over the other and found that ITM protective put and covered call dominates the pure stock strategy in the first stochastic dominance at 1% level of significance. Also our results confirms that by adding options especially in the money protective put improve the wealth of investor, as efficiency can be improved by the adding put to portfolio.
Keys Words: Covered call option, protective put option, , meanvariance approach, Capital asset pricing model, stochastic dominance test.
JEL Code: G11
TO SUDY THE STOCHASTIC DOMINANCE EFFICIENCY DUE TO OPTIONS IN THE PORTFOLIO
INTRODUCTION:
The main aim of portfolio is to maximise the return and minimise the risk. Mean variance criterion is the most attractive method to calculate the risk and return. Genreally stock prices is controlled by the options. The options give the flexibility to the portfolio and reduce the risk of the portfolio. The expected rate of return and risk are associated with the characteristic line. A steep slope indicates the actual rate of return for the fund is relatively sensitive to fluctuations in the general stock market (Treynor, J.L., 1965). Further, Frankfurter and Phillips (1975) compared the stochastic dominance (SD) and Markowitz (EV) efficiency criteria by using several algorithms. The basic framework of options in the portfolio were developed by the Ross, S., (1976), Cox (1976) and Hakanson (1978).
REVIEW OF LITRETURE:
Treynor, J.L., (1965), described a simple graphical method, through which he captured the distinctive features about the performance of a fund, including the effects of fund management. He also introduced fund performance concept and the fundmanagement performance measurement through the grading or rating system.
Frankfurter and Phillips (1975) studied and compared the stochastic dominance (SD) and efficiency relative to Markowitz (EV) efficiency criteria on empirical grounds. For improving computational efficiency they ascertain the several algorithms.
Ross, S., (1976), contended that option writing on an asset can improve the efficiency in the market. This efficiency permits the contingency expansion in the market. Result shows, first, that there is existence of single portfolio in the market on which there is no loss in the efficiency. Second if there is any efficient fund in the market then there is no loss in efficiency and third complex contract can be “built up” as portfolios of simple options.
Vijay S. B., Eric B. L. and Lawrence C. R., (1979), contended that under uncertainty the stochastic dominance (SD) rules are playing prominent role in the choice of theory. The application part of stochastic dominance included the stock selection, capital budgeting etc. The theory of stochastic dominance is important because it is used as decision making rules. These rules are applicable to problem of the two parameters. Also the meanvariance is employed in financial decision making. They contended that implementation of stochastic dominance required the comparisons of probability distributions over their entire ranges.
Trennepohl and Dukes (1981) used both inthemoney (ITM) and outofthemoney (OTM) options especially writing of calls (covered short call) or the buying of puts (put hedge). They also investigated the performance of option by using the writing and buying strategies of the option. They concluded that, these covered option reduces the risk (portfolio standard deviation) and mean return in comparison to the unprotected stock position.
Trennephol, G. and Dukes, W., (1982) gave attention on the behaviour of option risk on the different portfolio having different size and features. Many rational investor view that un hedge long position are too risky. However if we combine long option with the less risky asset then it resulted favourable risk return characteristics.
Levy (1985) applied the stochastic dominance rules along with borrowing and lending at the riskfree interest rate. Author derived the upper and lower values for an option price for all unconstrained utility functions and alternatively for the concave utility functions. The derivation of these bounds is quite general and fits any kind of stock price distribution as long as it is characterized by a "nonnegative beta." Author contended that transaction costs and taxes can be easily incorporated in the model and investors are not required to revise their portfolios continuously.
Jean and Helms (1986) discussed that, the stochastic dominance is a model through which one can take the investment decision. They developed the method of sufficient conditions for all degree of stochastic dominance. They illustrated the computational problem associated with implementing the stochastic dominance through the example.
Pardalos, P. M., Sandstrom , M., and Zopounidis, C., (1994), contended that how to allocate the money among different alternatives is the main aim of portfolio. They emphasized on the optimization problem related to the portfolio model. Researches applied the dual algorithm for the optimization problem. In their result they presented the computational results for classical Markowitz meanvariance.
Anderson, Gordon, (1996), tested the stochastic dominance which was based on the goodness of fit extension. They compared the income distribution on the basis of non parametric test. Researcher compared and implemented it with the indirect test of the second order stochastic dominance.
Isakov and Morard (2001) concluded that when option introduced in any portfolio, return increases and simultaneously volatility decreases. Also they showed that the covered portfolio is better than uncovered portfolio. They found no stochastic dominance relationships among option strategies. They also defined the hedged returns of both protectiveput and coveredcall strategies to take into consideration the are not exercised when the options are out of the money.
Kais and Georges (2001) analyzed the effect of generalized first and second order stochastic dominance changes in a returns distribution on optimal financial portfolios. They showed the risk aversion plays an important role in composition of portfolio. They concluded the results on the separate basis of fund.
Post, T., and Vliet, P. V., (2004), contended that there is no need to be growth portfolio to be efficient for the efficiency of market portfolio. They contended that stochastic dominance results are very much market sensitive and prone to sampling error.
Linton, Maasoumi, and Whang (2005), extended the KolmogorovSmirnov tests of Stochastic Dominance. They explain the procedure for estimating the critical values which are used in arbitrary order of stochastic dominance. This arbitrary order remains for the Kth term. By allowing the serially dependent observation they accommodate the general and prospects dependency and it was ranked. Also they contended that prospects may be residual. This residual may be of certain conditional models, so that conditional ranking can be proposed. They offered the test of Prospect Stochastic Dominance. They result was very consistent and powerful against some alternatives. They proposed some heuristic method. This method was used for the selection of the sub sample size. Also they demonstrate reasonable performance in the simulation. Also they described the other method for obtaining critical values. They compared these two methods in theory and in practice.
Best, Hodges and Yoder (2006) applied the stochastic dominance tests to check, whether value portfolio performance increases from unknown risk factor or from errors arise in forecasted earnings growth rates. They concluded that Value portfolios outperformed due to systematic errors in forecasting earnings growth rates.
Post, T., and Versijp. P., (2007), applied their test on CRSP allshare index of U.S. market. Researchers developed the tests of stochastic dominance. This efficiency test of stochastic dominance is for all the possible portfolios for given set of the entire asset. Multivariate statistics was used in their test. They compared the superior statistical power properties against the existing stochastic dominance efficiency tests and contended that it is helpful in increase the comparability with existing meanvariance efficiency tests. Through this test researchers demonstrate the meanvariance inefficiency of beta portfolios present in the sample. They reported the superior statistical power properties in the result. In the end they concluded that tail risk not captured by variance.
Kopa and Post (2009), contended that the efficiency testing of the portfolio through the existing approach gives the leniency for making the assumption about investor preferences and return distributions. Stochastic dominance is completely based on the parametric alternative procedures and assures to give the alternative of nonparametric test. But binary choices were not considered in these procedures. Researchers considered the all portfolio which was diversified so that new concept of firstorder stochastic dominance (FSD) was introduced. Though FSD they have found the optimality of all possible portfolios. Their result shows that if we applied FSD then US markets are non optimal relative to other benchmark portfolios. The whole analysis was made on the book to equity and the market capitalization. They concluded that no non satisfied investor can hold the market portfolio for the requirement of the attractive premium of small caps and value stocks.
Scaillet and Topaloglou (2010), considered the consistency test for the confirmation of stochastic dominance of the given portfolio with respect to all possible portfolios. This stochastic dominance efficiency tests was applied on the all order of the given portfolio. They discussed and justified the approaches which are based on the simulation also they blocked the bootstrap to get the valid interference. Linear and mixed integer programming methods was used to compute the estimators. Their results shows market is mean variance inefficient but Fama and French market portfolio is FSD and the SSD efficient.
Schweizer, M., (2010), discussed the problem of mean variance hedging with minimal mean squared error, and this hedging strategy is self financed trading strategy. Researcher discussed the findings of mean variance criteria that the returns should be maximised and variance should be minimised. In both the cases it leads to the projecting a random variable. In the end author ended with the open question related to the open questions of wide range of application.
Zagst and Kraus (2011) analysed the two portfolio insurance method. These methods were Optionbased Portfolio Insurance (OBPI) and Constant Proportion Portfolio Insurance (CPPI). Also they compared the above methods with each other by using the stochastic dominance of criteria third. Also they verify the spread of empirical and implied volatility. For the verification they used the second order and third order stochastic dominance for the Constant Proportion Portfolio Insurance theory. Researchers concluded that the Constant Proportion Portfolio Insurance strategy is more likely to stochastically dominate in comparison to Optionbased Portfolio Insurance strategy especially in the thirdorder and found the higher implied volatility.
Hodder, Jackwerth and Kolokolova (2014) examined the performance of secondorder stochastic dominance in both ways. Through this they also construct the portfolio. By using the 21 years of daily data of pension fund benchmark, they applied the secondorder stochastic dominance over a period. They suggested that portfolio choice technique significantly outperforms the benchmark portfolio outofsample.
DATA: SELECTION OF SAMPLE SIZE:
We have chosen the 10 companies of the nifty (index of national stock exchange). The data period starts from 1st April 2010 to 31st March 2014. The data used in this category is based on Secondary data, collected from official website of national stock exchange. We choose 20 options (call and put) and their underlying stocks for the abovementioned period. Options are selected according to its types and its Moneyness degrees and are only restricted to OTM call option and ITM put options due to the superiority of these types of options in performance enhancing. The Daily return for the unhedge individual stock has been calculated as follows by taking the natural logarithm of the daily closing price relatives.
r = ln (Pt/Pt1)
RESEARCH METHODOLOGY
We investigate the performance by examining the risk and return of three different strategies for the selected period. These strategies are pure stock strategy (Naked stock strategy), Covered call (hedge strategy) and protective put (hedge strategy). In covered call strategy we have determine the risk and return by incorporating the “out of the money call” of concerning stock, along with the stock. In protective put strategy we have determine the risk and return by incorporating the “In the money put” of corresponding stock, along with the naked stock.
Objectives of the study
- To study the performance of pure stock strategy covered call and protective put by examining their risk and return.
- To study the dominance of hedge strategies over the naked stock strategy.
- To study the dominance of one hedge strategy over the other.
Hypothesis
After complete study of the hypothesis of previous research and scope of the research, hypotheses were set as follows.
S0: The returns of the Covered call strategy do not outperform the returns of the unhedged purestock strategy.
B0: The returns of the Protective put strategy do not outperform the returns of the unhedged purestock strategy.
SB0: There is no difference in the returns between the performance of Covered call strategy and protective put strategy.
S1: the returns of the Covered call strategy outperformed the returns of the unhedged purestock strategy.
B1: The returns of the Protective put strategy outperform the returns of the unhedged purestock strategy.
SB1: There is the difference in the returns between the performance of Covered call strategy and protective put strategy.
As per the MV rule a portfolio is preferred rule: the portfolio X is preferred over Y only when
ER1 > ER2 and SD1 < SD2
To apply the MV criterion, we have computed the descriptive statistics including mean (μ) and standard deviation (σ). For the testing of hypothesis, S0, S1, B0, B1, SB0 and SB1 we have computed the coefficient of variance (σ/μ), the skewness and kurtosis coefficients and the JarqueBera (JB) statistic for the returns of all unhedged and hedged positions.
We have also employed the CAPM model for the construction of portfolio and evaluation of performance of above mentioned portfolios. In the CAPM analysis we have used the β effect, Sharpe’s ratio trenor’s ratio and Jensen’s analysis to measure the degree of performance of each strategy. After the estimation of all the linear regression for CAPM equation, we have used the following equation for both the hedge as well as unhedge portfolio of the particular stock.
RiRf = αi + βi (Rm,t – Rf,i) + εi,t
Where,
α = Intercept
β = Slop of ith stock and systematic risk
Rm = Return of market index
Rf =Risk free rate of return
ε = Residual of individual and identical distributed residuals
Beta is the slop of characteristic regression line. Beta describes the relationship between stock return and market return. Beta also measures the sensitivity of stock return to the measurement of market portfolio return. After that we have computed the Sharpe’s ratio trenor’s ratio and Jensen’s ratio.
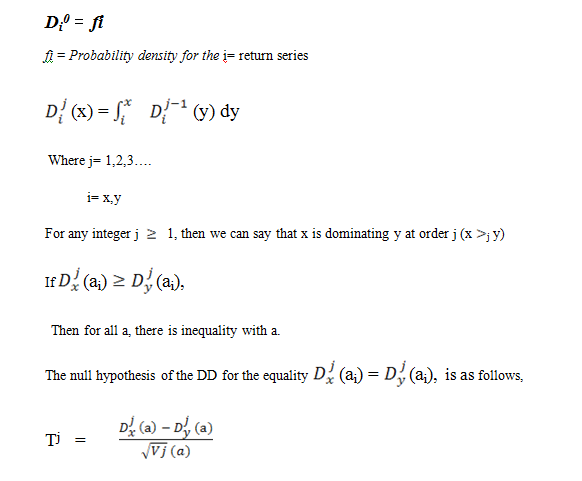
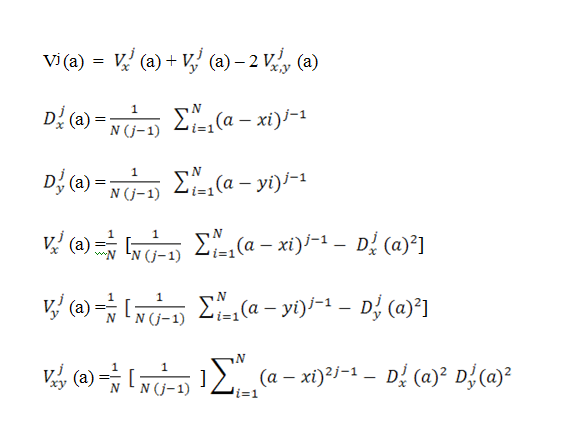
We have applied the Davidson and Duclos (DD, 2000) nonparametric SD DD test. This test is based on the empirical distribution of the data. DD is used to test any dominance from any of the two random samples of the returns series, with the number of observations. DD also check the corresponding cumulative distribution functions (CDFs), and the corresponding probability density functions (PDFs).
DATA ANALYSIS:
Descriptive statistics for the returns of both unhedged and hedged positions are as Follows:
Table I (i) : Descriptive statistics of returns on unhedged and hedged stock
|
Unhedged Position pure stock strategy
|
|
Company
|
Mean (µ)
|
Std Dev (σ)
|
σ/µ
|
Skewness
|
Kurtosis
|
JB
|
|
AXISBANK
|
0.00047822
|
0.022846893
|
47.7748986
|
0.333148736
|
2.778594237
|
156.1583251
|
|
BPCL
|
0.000311325
|
0.026351511
|
84.64309833
|
6.902000641
|
138.1714378
|
5964.401408
|
|
HDFC
|
0.000212916
|
0.030445451
|
142.9925782
|
17.64033824
|
45.98415328
|
345.2882706
|
|
M&M
|
0.000777418
|
0.018500294
|
23.79708803
|
0.023119906
|
0.778667094
|
183.1883664
|
|
REC
|
0.000219047
|
0.025829645
|
117.9180436
|
0.101997977
|
0.431269679
|
174.4272882
|
|
RELINFRA
|
0.000464136
|
0.027636629
|
59.54419695
|
0.182459839
|
3.71621803
|
212.0651513
|
|
TATASTEEL
|
0.000258393
|
0.022158064
|
85.75328717
|
0.319204413
|
0.977209161
|
156.9474367
|
|
TECHM
|
0.000938297
|
0.020214761
|
21.54409071
|
0.522159296
|
2.441610372
|
149.4261148
|
|
TITAN
|
0.002724842
|
0.048107332
|
17.65508924
|
15.19458803
|
29.89627441
|
259.2726448
|
|
WIPRO
|
0.000267228
|
0.021265411
|
79.57777425
|
6.615245284
|
118.7303055
|
552.8309
|
Table I (ii) :
|
Hedged Position: writing OTM covered call strategy
|
|
|
Mean (µ)
|
Std Dev (σ)
|
σ/µ
|
Skewness
|
Kurtosis
|
JB
|
|
AXISBANK
|
0.155646171
|
1.679036895
|
10.78752458
|
15.69243
|
285.6964005
|
23686.2158
|
|
BPCL
|
0.018757153
|
3.518205582
|
187.5660745
|
2.299327974
|
5.604025281
|
519.6622769
|
|
HDFC
|
0.000140422
|
0.006963969
|
49.59303631
|
0.917154297
|
9.17154297
|
159.1939743
|
|
M&M
|
0.024313407
|
0.278817584
|
11.46764771
|
0.9804627216
|
12.88059793
|
89.03733426
|
|
REC
|
0.046163
|
0.816651
|
17.69075
|
2.578312
|
7.426327
|
656.8173
|
|
RELINFRA
|
0.0451684
|
1.308643
|
28.9725
|
31.54501
|
997.275
|
99100.16
|
|
TATASTEEL
|
0.083462
|
1.231324
|
14.75319
|
17.75661
|
34.44881
|
305.649
|
|
TECHM
|
0.042902
|
0.487255
|
11.35751
|
13.56862
|
22.27671
|
175.2793
|
|
TITAN
|
0.003395
|
0.026708
|
7.867708
|
0.837975
|
4.897556
|
154.652
|
|
WIPRO
|
0.032114
|
0.496656
|
15.46517
|
21.91513
|
57.656
|
470.9671
|
Table I (iii):
|
Hedged Position: buying ITM protective put strategy
|
|
|
Mean (µ)
|
Std Dev (σ)
|
σ/µ
|
Skewness
|
Kurtosis
|
JB
|
|
AXISBANK
|
0.691782
|
0.877301
|
1.268176
|
1.753898
|
36.53801
|
297.9813
|
|
BPCL
|
0.111446957
|
3.230134998
|
28.98360882
|
0.3137668424
|
9.899403783
|
980.2657694
|
|
HDFC
|
0.002156542
|
0.091334288
|
42.35219938
|
4.478323962
|
79.444702
|
1703.077665
|
|
M&M
|
0.51077747
|
13.76976654
|
26.95844543
|
3.101855252
|
9.732776326
|
957.619282
|
|
REC
|
0.132067
|
1.400511
|
10.60458
|
|
2.196539
|
184.7699
|
|
RELINFRA
|
0.101542
|
1.879348
|
18.50815
|
2.452913
|
6.434837
|
59.31783
|
|
TATASTEEL
|
0.540017
|
0.653327
|
1.209826
|
14.68786
|
25.89581
|
206.5713
|
|
TECHM
|
0.185431
|
0.290268
|
1.565366
|
10.11195
|
13.45902
|
94.98118
|
|
TITAN
|
0.000667
|
0.003454
|
5.175281
|
0.654155
|
7.415102
|
149.1031
|
|
WIPRO
|
0.144559
|
1.852881
|
12.81749
|
18.69232
|
409.0377
|
33973.12
|
Interpretation of Mean Variance analysis:
Presence of leverage effect and excessive gain was found in all companies and this leverage effect and excessive gain results that mean return was increased after the introduction of ITM protective put and OTM covered call. On comparison of all three strategies, it was found that ITM protective put has highest mean return and standard deviation followed by the OTM covered call, while the necked strategy has least mean return and standard deviation. Hence it can be concluded that these strategies dominate one another by MV criterion.
On comparison of coefficient of variance, it was found that mean return has been increased and variance was decreased in hedge positions which indicates that volatility or movement has been decreased after the introduction of option strategies.
The result also suggested that after the introduction of option strategies the distribution remains away from normality. Further skewness coefficient that the time series for unhedge stock was normally distributed and hedge strategies was nonnormally distributed.
Returns shows the evidence of fat tail in the time series since kurtosis exceed three, which was the normal value. Jarque bera test also following the nonnormality distribution in all strategies.
Table II: Summary of index performance measure of individual stock/index position
Table II (i):
|
Unhedged Position pure stock strategy
|
|
|
Beta
|
Sharpe
|
Treynor
|
Jensen
|
T*(β)
|
|
AXISBANK
|
0.884636009
|
3.042942388
|
0.078588006
|
0.061446301
|
0.000199235
|
|
BPCL
|
0.396790315
|
2.644579813
|
0.175630988
|
0.027463997
|
0.00018619
|
|
HDFC
|
0.660290863
|
2.306187451
|
0.106336344
|
0.046433277
|
0.00042115
|
|
M&M
|
0.516091033
|
3.741701741
|
0.134128627
|
0.035348954
|
0.00061466
|
|
REC
|
0.796279565
|
2.701583878
|
0.087633735
|
0.058695725
|
0.00003207275
|
|
RELINFRA
|
0.858702348
|
2.549664634
|
0.082058861
|
0.060573301
|
0.000734943
|
|
TATASTEEL
|
0.730556762
|
3.170782065
|
0.096171026
|
0.051397366
|
0.000488787
|
|
TECHM
|
0.468240482
|
3.416399706
|
0.147491952
|
0.031838537
|
0.00079063
|
|
TITAN
|
0.579383091
|
1.84930653
|
0.120326748
|
0.040272099
|
0.000101999
|
|
WIPRO
|
0.271643351
|
3.304296655
|
0.258674574
|
0.019282263
|
0.000352895
|
Table II (ii):
|
Headged Position: writing OTM covered call strategy
|
|
|
Beta
|
Sharpe
|
Treynor
|
Jensen
|
T*(β)
|
|
AXISBANK
|
0.61345082
|
0.1829425
|
0.0829846
|
0.265384
|
0.0000022
|
|
BPCL
|
0.814315
|
0.729236
|
0.0883762
|
0.318294
|
0.0000012
|
|
HDFC
|
0.38912401
|
0.268583
|
0.0920830
|
0.536295
|
0.00000496
|
|
M&M
|
0.4378817
|
0.6834295
|
0.04936829
|
0.439458
|
0.00000126
|
|
REC
|
0.5134748
|
0.2863108
|
0.0934158
|
0.0534532
|
0.00000677
|
|
RELINFRA
|
0.8164318
|
0.8289573
|
0.0831844
|
0.0346310
|
0.00000941
|
|
TATASTEEL
|
0.6816758
|
0.4893406
|
0.0126534
|
0.6240136
|
0.0000089
|
|
TECHM
|
0.3489264
|
0.6352083
|
0.0456212
|
0.056243
|
0.00000084
|
|
TITAN
|
0.5039621
|
0.63903115
|
0.0006429
|
0.285885
|
0.00000527
|
|
WIPRO
|
0.1256453
|
0.9537424
|
0.0842534
|
0.1926313
|
0.00000281
|
Table II (iii):
|
Hedged Position: buying ITM protective put strategy
|
|
|
Beta
|
Sharpe
|
Treynor
|
Jensen
|
T*(β)
|
|
AXISBANK
|
0.1652189
|
0.2650001
|
0.0846213
|
0.4215934
|
0.000000413
|
|
BPCL
|
0.9635487
|
0.7593678
|
0.0901329
|
0.3639621
|
0.000000128
|
|
HDFC
|
0.28538137
|
0.278593
|
0.09451402
|
0.643456
|
0.000000462
|
|
M&M
|
0.3659322
|
0.7289634
|
0.0524563
|
0.626452
|
0.000000186
|
|
REC
|
0.4386531
|
0.297893
|
0.0982984
|
0.232567
|
0.000000511
|
|
RELINFRA
|
0.713458
|
0.886257
|
0.0865984
|
0.0842167
|
0.000000871
|
|
TATASTEEL
|
0.5321641
|
0.644332
|
0.0463892
|
0.700488
|
0.000000126
|
|
TECHM
|
0.2145298
|
0.8050137
|
0.0678958
|
0.20568205
|
0.000000237
|
|
TITAN
|
0.4890528
|
0.7146706
|
0.0026293
|
0.464298
|
0.000000416
|
|
WIPRO
|
0.138216
|
0.9725345
|
0.0984539
|
0.247645
|
0.000000005
|
Interpretation:
Systematic Risk (Beta) effect:
Systematic risk was decreased in the strategies having call and put. Beta coefficient was found highest in necked strategy among all strategies.
Sharpes and Trenor Ratio:
ITM protective put having the largest sharpes and trenor ratio which suggests that larger change in mean return then the systematic risk by incorporating put in the necked strategy.
Jensens Ratio:
Jensens ratio was found highest in the option strategies. This suggest that on incorporating call put in the pure stock strategy, beats the market return. The overall result concludes that ITM protective put was superior to OTM covered call and necked strategy. While both hedge strategy were superior to pure stock strategy.
Table III: DD stochastic dominance tests between unhedged and hedged positions for individual stock’s portfolios
- Pure Stock Strategy Vs Writing OTM coveredcall strategy and Buying ITM protectiveput strategy
- Writing OTM coveredcall strategy Vs Pure Stock Strategy
- Buying ITM protectiveput strategy Vs Pure Stock Strategy
|
Pure Stock Strategy
|
Writing OTM coveredcall strategy
|
Buying ITM protectiveput strategy
|
Writing OTM coveredcall strategy
|
Pure Stock Strategy
|
Buying ITM protectiveput strategy
|
Pure Stock Strategy
|
|
AXISBANK
|
ND
|
ND
|
AXISBANK
|
FSD
|
AXISBANK
|
FSD
|
|
BPCL
|
ND
|
ND
|
BPCL
|
FSD
|
BPCL
|
FSD
|
|
HDFC
|
ND
|
ND
|
HDFC
|
FSD
|
HDFC
|
FSD
|
|
M&M
|
ND
|
ND
|
M&M
|
FSD
|
M&M
|
FSD
|
|
REC
|
ND
|
ND
|
REC
|
FSD
|
REC
|
FSD
|
|
RELINFRA
|
ND
|
ND
|
RELINFRA
|
FSD
|
RELINFRA
|
FSD
|
|
TATASTEEL
|
ND
|
ND
|
TATASTEEL
|
FSD
|
TATASTEEL
|
FSD
|
|
TECHM
|
ND
|
ND
|
TECHM
|
ND
|
TECHM
|
ND
|
|
TITAN
|
ND
|
ND
|
TITAN
|
ND
|
TITAN
|
ND
|
|
WIPRO
|
ND
|
ND
|
WIPRO
|
FSD
|
WIPRO
|
FSD
|
Table IVA: DD stochastic dominance tests between unhedged and hedged positions for individual stock/index in the first Subperiod:
April 2010 to March 2012
- Pure Stock Strategy Vs Writing OTM coveredcall strategy and Buying ITM protectiveput strategy
- Writing OTM coveredcall strategy Vs Pure Stock Strategy
- Buying ITM protectiveput strategy Vs Pure Stock Strategy
|
Pure Stock Strategy
|
Writing OTM coveredcall strategy
|
Buying ITM protectiveput strategy
|
Writing OTM coveredcall strategy
|
Pure Stock Strategy
|
Buying ITM protectiveput strategy
|
Pure Stock Strategy
|
|
AXISBANK
|
ND
|
ND
|
AXISBANK
|
FSD
|
AXISBANK
|
FSD
|
|
BPCL
|
ND
|
ND
|
BPCL
|
FSD
|
BPCL
|
FSD
|
|
HDFC
|
ND
|
ND
|
HDFC
|
FSD
|
HDFC
|
FSD
|
|
M&M
|
ND
|
ND
|
M&M
|
FSD
|
M&M
|
FSD
|
|
REC
|
ND
|
ND
|
REC
|
FSD
|
REC
|
FSD
|
|
RELINFRA
|
ND
|
ND
|
RELINFRA
|
FSD
|
RELINFRA
|
FSD
|
|
TATASTEEL
|
ND
|
ND
|
TATASTEEL
|
FSD
|
TATASTEEL
|
FSD
|
|
TECHM
|
ND
|
ND
|
TECHM
|
FSD
|
TECHM
|
FSD
|
|
TITAN
|
ND
|
ND
|
TITAN
|
FSD
|
TITAN
|
FSD
|
|
WIPRO
|
ND
|
ND
|
WIPRO
|
FSD
|
WIPRO
|
FSD
|
Table IVB: DD stochastic dominance tests between unhedged and hedged positions for individual stock/index in the second subperiod: April 2012 to March 2014
- Pure Stock Strategy Vs Writing OTM coveredcall strategy and Buying ITM protectiveput strategy
- Writing OTM coveredcall strategy Vs Pure Stock Strategy
- Buying ITM protectiveput strategy Vs Pure Stock Strategy
|
Pure Stock Strategy
|
Writing OTM coveredcall strategy
|
Buying ITM protectiveput strategy
|
Writing OTM coveredcall strategy
|
Pure Stock Strategy
|
Buying ITM protectiveput strategy
|
Pure Stock Strategy
|
|
AXISBANK
|
ND
|
ND
|
AXISBANK
|
FSD
|
AXISBANK
|
FSD
|
|
BPCL
|
ND
|
ND
|
BPCL
|
FSD
|
BPCL
|
FSD
|
|
HDFC
|
ND
|
ND
|
HDFC
|
FSD
|
HDFC
|
FSD
|
|
M&M
|
ND
|
ND
|
M&M
|
FSD
|
M&M
|
FSD
|
|
REC
|
ND
|
ND
|
REC
|
FSD
|
REC
|
FSD
|
|
RELINFRA
|
ND
|
ND
|
RELINFRA
|
FSD
|
RELINFRA
|
FSD
|
|
TATASTEEL
|
ND
|
ND
|
TATASTEEL
|
FSD
|
TATASTEEL
|
FSD
|
|
TECHM
|
ND
|
ND
|
TECHM
|
FSD
|
TECHM
|
FSD
|
|
TITAN
|
ND
|
ND
|
TITAN
|
SSD
|
TITAN
|
SSD
|
|
WIPRO
|
ND
|
ND
|
WIPRO
|
FSD
|
WIPRO
|
FSD
|
Table V: DD stochastic dominance relationships between hedged positions for individual stock positions for the entire period and the two subperiods.
|
|
Entire Period
|
First Subperiod
|
Second Subperiod
|
|
|
Writing OTM covered call
|
Buying ITM protective put
|
Writing OTM covered call
|
Buying ITM protective put
|
Writing OTM covered call
|
Buying ITM protective put
|
|
AXISBANK Writing OTM covered call
|
|
ND
|
|
ND
|
|
ND
|
|
AXISBANK Buying ITM protective put
|
FSD
|
|
FSD
|
|
FSD
|
|
|
BPCL Writing OTM covered call
|
|
ND
|
|
ND
|
|
ND
|
|
BPCL Buying ITM protective put
|
FSD
|
|
FSD
|
|
FSD
|
|
|
HDFC Writing OTM covered call
|
|
ND
|
|
ND
|
|
ND
|
|
HDFC Buying ITM protective put
|
FSD
|
|
FSD
|
|
FSD
|
|
|
M&M Writing OTM covered call
|
|
ND
|
|
ND
|
|
ND
|
|
M&M Buying ITM protective put
|
FSD
|
|
FSD
|
|
FSD
|
|
|
REC Writing OTM covered call
|
|
ND
|
|
ND
|
|
ND
|
|
REC Buying ITM protective put
|
FSD
|
|
FSD
|
|
FSD
|
|
|
RELINFRA Writing OTM covered call
|
|
ND
|
|
ND
|
|
ND
|
|
RELINFRA Buying ITM protective put
|
FSD
|
|
FSD
|
|
FSD
|
|
|
TATASTEEL Writing OTM covered call
|
|
ND
|
|
ND
|
|
ND
|
|
TATASTEEL Buying ITM protective put
|
FSD
|
|
FSD
|
|
FSD
|
|
|
TECHM Writing OTM covered call
|
|
ND
|
|
ND
|
|
ND
|
|
TECHM Buying ITM protective put
|
FSD
|
|
FSD
|
|
FSD
|
|
|
TITAN Writing OTM covered call
|
|
SSD
|
|
ND
|
|
SSD
|
|
TITAN Buying ITM protective put
|
ND
|
|
FSD
|
|
ND
|
|
|
WIPRO Writing OTM covered call
|
|
ND
|
|
ND
|
|
ND
|
|
WIPRO Buying ITM protective put
|
FSD
|
|
FSD
|
|
FSD
|
|
Interpretation for Dominancy Analysis:
ITM protective put and covered call dominates the pure stock strategy in the first stochastic dominance at 1% level of significance. Hence null hypothesis of S0 and B0 was rejected and concluded that both hedge strategies were superior to pure stock strategy. Further, all company has the arbitrage opportunity in option trading and investor can increase the wealth of investor by switching to pure stock to hedge strategy. Further we analysed the subperiods and found that in the first subperiod the hedge position has dominancy over pure stock strategy.
CONCLUSION & DISCUSSION:
Our result shows that both mean and standard deviation of the daily returns was increased for each stock from the necked strategy to the twohedged positions (writing OTM covered call and buying ITM protective put). The gain in ITM put and OTM covered call compensate the negative change in price of the underlying. On comparing all the three strategy necked strategy, ITM protective put and OTM covered call strategy the statistics shows that ITM protective put have highest return and highest standard deviation which is followed by Covered call strategy and in the necked strategy which is small in comparison to hedge strategy. Along with this we measured the optimal risk and return performance by the coefficient of variation and found that by introducing the option in trading strategy volatility also increased on increasing mean return. To be very specific the results shows that ITM protective put having lowest coefficient of variation which is followed by OTM covered call and necked strategy. After introducing ITM put option to purestock strategy our result shows that no company shows the negative skewness coefficients out of the 10 stocks, this finding is consistent with the findings of Bookstaber and Clarke (1981, 1984) which contend that introducing ITM put option alters stock return in 90% by giving more weight on the righthand side of the distribution. While in the OTM covered call option none company shows the negative skewness while other were remain positive and this indicated that OTM call also shift the return distribution towards the right hand. Kurtosis results support the evidence of nonnormality in all the stock. The result of the JB statistic shows that normality is rejected for time series of stock. Further we have checked the performance of different strategy by using beta coefficient, Sharpe ratio, Treynor and Jensen indices for each strategy on each stock or index. After the introduction of the options it has been found that beta (systematic risk) is reduced in all of the companies. In addition, the Beta coefficients are less than one or even become negative due to systematic risk minimisation. It has been found that both Sharpes and Treynor ratio becomes positive and higher in all hedge strategy than necked strategy. It was also found that ITM protective put strategy was having largest Sharpe and Treynor ratio which is followed by the OTM covered call strategy. These results indicates larger change in mean return then the change in the systematic risk by adopting call or put in trading stock was the reason for largest change in Sharpe and Treynor ratio. Results of Jensen ratio coincide with the sharpes and Treynors ratio.
Further we have applied the stochastic dominance test on all the time series of all the unhedge and hedge position and result shows that in unhedge position all stock of necked strategy do not shows any stochastic dominance. while one stock (Titan) Shows the second stochastic dominance over the unhedge strategy. Remaining nine stock dominating the unhedge position at the level of first stochastic dominance. This protective put and covered call dominance over the pure stock strategy in the first stochastic dominance at 1% level of significance. Hence null hypothesis of S0 and B0 was rejected and concluded that both hedge strategies were superior to pure stock strategy.
REFERENCES:
RESEARCH PAPERS AT GLANCE
- Abid, F., Mroua, M., Wong, & W, K., (2009), The impact of option strategies in financial portfolios performance: mean variance and stochastic dominance approaches, Finance India,23(2), 503526.
- Anderson, Gordon, (2004), Toward an empirical analysis of polarization, Journal of Econometrics, 122, 126.
- Anderson, Gordon, (1996), Nonparametric Tests of Stochastic Dominance in Income Distributions, Econometrica, 64(5), 11831193.
- Barrett, G. and Donald, S. (2003), Consistent tests for stochastic dominance, Econometrica, 71 (1), 71104.
- Vijay S B, Eric B. L. and Lawrence C. R., (1979), an efficient algorithm to determine stochastic dominance admissible sets, Management Science, 25(7), 609622.
- Best, R. J., Best, R. W., and Yoder, J. A., (2000) Value Stocks and Market Efficiency Journal of Economics and Finance 24(1), 2835.
- Best, R. W., Hodges, C. W. and Yoder, J. A., (2006) , Expected Earnings Growth and Portfolio Performance, CFA Digest, Nov2006, 36 (4), 4344.
- Frankfurter, G. M. and Phillips, H,. (1975), efficient algorithms for conducting stochastic dominance tests on large numbers of portfolios: a comment, Journal of Financial & Quantitative Analysis, 10 (1), 177179.
- Hodder, J. E., Jackwerth, J. C. and Kolokolova, O. (2014), Improved Portfolio Choice Using SecondOrder Stochastic Dominance, working paper series (20102014) Retrieved from, University of Konstanz Department of Economics, http://www.wiwi.unikonstanz.de/workingpaperseries.
- Isakov, D. and Morard, B., (2001), Improving portfolio performance with option strategies: Evidence from Switzerland, European Financial Management, 7 (1), 7391.
11. Jean W, H., and Helms, B. P., (1986), Stochastic Dominance as a Decision Model, Quarterly Journal of Business and Economics, 25 (1), 65101.
- Kais, D. And Georges, D., (2001), Stochastic dominance and optimal portfolio, Economics Letters, 71 (3), 347354.
- Kopa, M., and Post, T., (2009), A Portfolio Optimality Test Based on the FirstOrder Stochastic Dominance Criterion, Journal of Financial And Quantitative Analysis, 44 (5), 1103–1124.
- Kopa, M., and Tichy, T., (2013) Efficiency analysis of several EU stock markets: meanrisk efficiency analysis, Pakistan Journal of Statistics, 29, 5 (2013), 697–710.
- Levy, H. (1985), Upper and Lower Bounds of Put and Call Option Value: Stochastic Dominance Approach, the journal of finance, XI (4), 11971217.
- Levy, H., (1989), TwoMoment decision models and expected utility maximization comment, American Economic Review, 79 (3), 597600.
- Levy, M., and Levy, H., (2002), Prospect Theory: Much Ado About Nothing?, Management Science, 48,(10), 13341349.
- Linton, O., Maasoumi, E. and Whang, YJ. (2005). Consistent testing for stochastic dominance under general sampling schemes. Review of Economic Studies, 72, 735765.
- Kopa M. & Post C. (2008), A secondorder stochastic dominance portfolio efficiency measure, Kybernetika, 44, (2), 243 – 258.
- Pardalos, P. M., Sandstrom , M., and Zopounidis, C., (1994), On the Use of Optimization Models for Portfolio Selection: A Review and Some Computational Results, Computational Economics 7, 227244.
- Post, T., and Vliet, P. V., (2004), market portfolio efficiency and value stocks, journal of economics, AND FINANCE, 28 (3), 300306.
- Post, T. and Levy, H., (2005). Does Risk Seeking Drive Asset Prices? Review of Financial Studies, 18(3), 925953.
- Post, T., and Versijp. P., (2007), Multivariate Tests for Stochastic Dominance Efficiency of a Given Portfolio, Journal Of Financial And Quantitative Analysis, 42(2) , 489516.
- Ross, S., (1976), Options and efficiency, Quarterly Journal of Economics, 90, 7589.
- Scaillet, O, and Topaloglou, N., (2010), Testing For Stochastic Dominance Efficiency, Journal of Business & Economic Statistics, 28 (1), 169180.
- Schweizer, M., (2010), Meanvariance hedging and meanvariance portfolio selection, “Encyclopedia of Quantitative Finance”, Wiley (2010), 1177–1181.
- Trennepohl, G. and Dukes, W., (1981), An empirical test of option writing and buying strategies utilizing inthemoney and outofthemoney contracts, Journal of Business Finance & Accounting, 8 (2), 185202.
- Trennephol, G. and Dukes, W., (1982), measuring portfolio risk in option, Journal of Financial and Quantitative Analysis, 3, 391409.
- Treynor, J.L., (1965), how to rate management of investment funds, Harvard Business Review, 43, 6375.
- Zagst, R. and Kraus, J., (2011), Stochastic Dominance of Portfolio Insurance Strategies, Annals of Operation Research, 185 (1), 75103.
BOOKS AT GLANCE
- Gujarati, D. N. (2003). Basic Econometrics. Fourth Edition. New York. McGrawHill Higher Education.
- Varshney, P. N., & Mittal, D. K. (2008). Indian Financial System. Eighth Revised Edition. New Delhi, Sultan Chand & Sons.
- Greene, W. H. (1992). Econometric Analysis. Fifth Edition. Prentice Hall. New York, USA.
- Wooldridge, J. M. (1999). Introductory Econometrics: A Modern Approach. Thomson SouthWestern, Ohio, USA
- Pandian, P (2012), Security Analysis and Portfolio Management. Second Edition. Vikas Publication, New Delhi.
- Gupta, S. K. & Joshi, R. (2014), Security analysis and portfolio management, Fifth revised edition, Kalyani Publishers, New Delhi.
- Rustagi R, P. (2010),Investment analysis and portfolio management, third revised edition, Sultan Chand & Sons, New Delhi.
MODULES AT GLANCE:
- NCFM Module. Capital Market (Dealers) Module, National Stock Exchange.
- NCFM Module. Derivative Market (Dealers) Module, National Stock Exchange.
- NCFM Module. Option Trading (Advanced) Module, National Stock Exchange.
- Financial Markets (Advanced) Module, National Stock Exchange.
- Equity Derivatives: A Beginner's Module, National Stock Exchange.
- Module of Chartered Accountant, Final Stage, Strategic Financial Management.
- Module of Company Secretary, Final Stage, Securities Laws and Compliances.
WEBSITES AT A GLANCE:
- nseindia.com
- moneycontrol.com
- bloomberg.com

