A Refereed Monthly International Journal of Management
INTEREST RATES AND STOCK MARKET IN INDIAN CONTEXT: AN ANALYSIS
Author
|
S.P.AGGARWAL,
Principal, Ramanujan College,
University of Delhi.
|
Ms. ANSHIKA AGARWAL
Assistant Professor,Ramanujan College ,Research Scholar
Department of Commerce,Delhi School of Economics
University of Delhi,India ,+919871373360
agarwalanshika24@gmail.com |
ABSTRACT
In this paper, it is checked whether interest rates matter for stock markets or not by studying the nature of relationship and the causality between interest rates and stock market for the period ranging from January 2008 to December 2013 for Indian market. Augmented Dickey-Fuller Unit Root test is applied and it is found BSE 100 series and Call money rates series are non-stationary at level and at first difference these series are stationary. And then by applying Granger-Causality test, it is found that there is no causal relationship between interest rates and stock market in Indian context. They do not lead or lag each other. But, by applying Johansen co-integration test it is seen that interest rates and stock market move together in the long run and there is co-integration between them. The findings of this paper might help policy makers to change interest rates as part of monetary policy by considering its effects on stock prices.
Keywords: Interest Rate, Stock Market, Granger Causality, Johansen Co-integration.
JEL Classification: E43, E44, G10
1. INTRODUCTION
Stock market is one of the important barometers to assess the health of an economy. Any country’s industry and commerce growth are analysed through its stock returns. Both investor’s and companies needs stock market as investor’s need it for their portfolio returns and companies need it to raise funds. Stock market is mainly the place where companies get listed to issue the shares and raise the fund and investors get marketability as well as liquidity.
The stock market works with the sentiments of participants, which depend on macroeconomic and other factors, which makes it a very sensitive segment of the economy. New Economic reforms in 1991 have added to the sensitivity by increasing determinants of the stock market movement manifold. Among the various important determinants, one whose relationship with the stock market is of great concern is interest rate as it is directly related to economic growth.
According to discounting model, there is an inverse relationship between interest rates and stock prices as present values of stocks are calculated by discounting the future cash flows at discount rate, and this discount rate is risk adjusted rate of return and it is equal to the interest rate levels. So, as the interest rate increases present values of stock prices decreases and vice-versa. The relationship between stock prices and interest rate is also negative due to presence of bonds market, as interest rate of bonds increases, investors substitute bonds for shares, which leads to decrease in the value of share prices. But many researchers have also said that the relationship between interest rates and stock prices need not necessarily be negative and they have found the positive relationship between the two like stock prices rising along with interest rates when economy is growing rapidly and positive relationship between these two variables can also exist due to increased risk which leads to lower interest rates.
The relationship between stock returns and interest rates has been an area of interest for many researchers, academicians, economists, policy makers, etc., since decades. Many of researchers have shown interest rates fluctuations impact stock returns.In this paper, we examine the Indian Economy and check thecausal relationship between stock returns and interest rates in short run. We also examine whether there is any co-integration between stock returns and interest rates in long run or not.
This paper is organised as follows: In section 2 review of literature is being discussed and section 3 deals with the data collection and various methodologies used. After this, empirical results have been presented in section 4 and lastly this paper is concluded in section 5.
2. REVIEW OF LITERATURE
Various studies have been studied and few prominent studies are discussed below:
Flannery & James (1984), analysed “the relationship between interest rate sensitivity of common stock returns and the maturity composition of the firm's nominal contracts and found stock returns are correlated with interest rate changes and the effect of nominal interest rate changes on common stock prices is related to the maturity composition of a firm's net nominal asset holding.”
Lee (1992), analysed “causal relations and dynamic interactions between asset returns, real activity, and inflation in the United States for the period 1947- 1987 using multivariate vector-autoregressive model (VAR). It was found stock returns are Granger-causal prior and help explain real activity and interest rates in the VAR, stock returns explain little variation in inflation.”
Panda (2008), examined “the relationship between interest rates and stock markets in the Indian context for the period April 1996-June 2006. It was found that there is a long-run relationship between interest rates and stock prices and SENSEX was more responsive to changes in interest rates than NIFTY.”
Alam&Uddin(2009), said “Interest rate and stock market are important factors for economic growth of a country and they analysed the impact of interest rate on stock exchange as well as impact of stock exchange on interest rates by taking an assumption of market efficiency by taking data since January 1988 to March 2003 for 15 countries namely, Australia, Bangladesh, Canada, Chile, Colombia, Germany, Italy, Jamaica, Japan, Malaysia, Mexico, Philippine, S. Africa, Spain, and Venezuela. They tested stationarity of market return and found none of these stock marketsare efficient. They also found negative relationship between interest rate and share price.”
Shiller &Beltrtti (1992), examined “whether real stock prices show any relationship to long-term interest rates. For this, they used annual data in the United States, 1871-1989, and the United Kingdom, 1918-1989 and found real stock prices have an inverse relationship with long-term interest ratesand have shown little correlation with changes in inflation rates.”
Apergis&Eleftheriou (2001),found “that stock prices in Athene’s stock exchange follow inflation rather than nominal interest rate movements. Their results showed that the continuous reduction of inflation rates in Greece is expected to contribute towards substantial increase in stock prices which will lead to a higher economic growth.”
Wong, Khan, &Du (2005),“used advanced time series techniques to analyse the long term and short term equilibrium relationships between stock indices and money supply and interest rate for the period from January 1982 to December 2002. They found that the level of the stock markets might be used by central bank as an indicator to adjust monetary policy and in the long run Singapore and U.S. Stock markets possess equilibrium relationships with money supply and interest rates.”
Various studies discussed above shows that the relationship between interest rates and stock market is not very clear. And mostly studies have been conducted for developed nations except Panda (2008), who found the long term co-integration between interest rates and stock market. In this, paper we analyse the relationship between interest rates and stock market in India, their causality in short run and also tries to analyse long-term Cointegration.
3. DATA & METHODOLOGY
3.1 DATA: The period of this paper is taken for five years ranging from January 2008 to December 2013. This period is chosen to analyse the relationship between stock market and interest rates after post crisis in the year 2007. BSE 100 is used as a proxy for stock price index in India because it is a broad-based index and it has also been accepted widely as market proxy among investment researcher as well as practitioners in the country. This index is based on 100 actively traded equity shares. Call money rates are used as a proxy for interest rates as interest rates varies across banks so to have uniform measurement, call money rates have been used for the same. Bi-monthly data is used and this is likely to lead to more robust estimates than using daily figures. The total number of observations, which is equal to 123, is believed to constitute a large data set for time series analysis. The call money rates are obtained from various issues of Handbook of Statistics on the Indian Economy and RBI Bulletin published by the Reserve Bank of India. BSE 100 data is obtained from the www.bseindia.com.
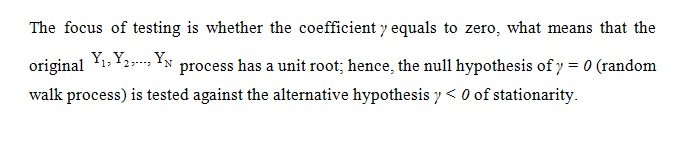
3.2METHODOLOGY: To check the Stationarity for Time Series data, Augmented Dickey-Fuller (ADF) Unit Root Test has been used and to check short run causal relationship between the 2 variables, Granger-Causality test has been applied. Further, to test for long run co-integration, Johansen test has been used. Lastly, E-views software is used to analyse these test. A brief description of all these tests has been provided below.
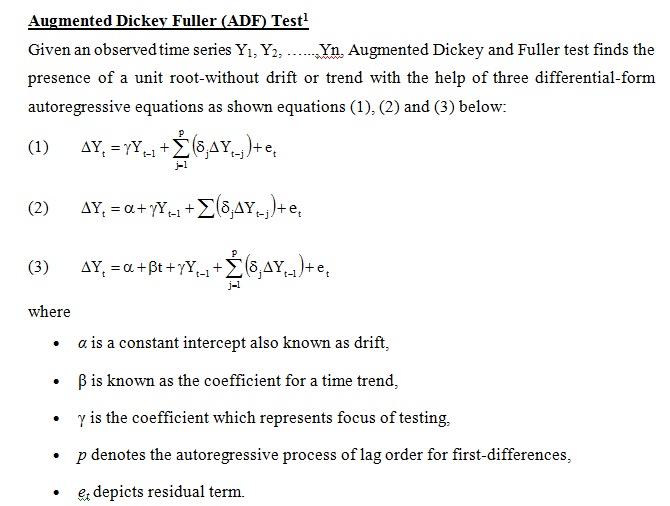
To accept or reject the null hypothesis, Dickey-Fuller statistic is calculated and compared with the relevant critical values and if test statistic is more than critical value then the null hypothesis is accepted. This test critical value depends on the size of sample.
Granger CausalityTest
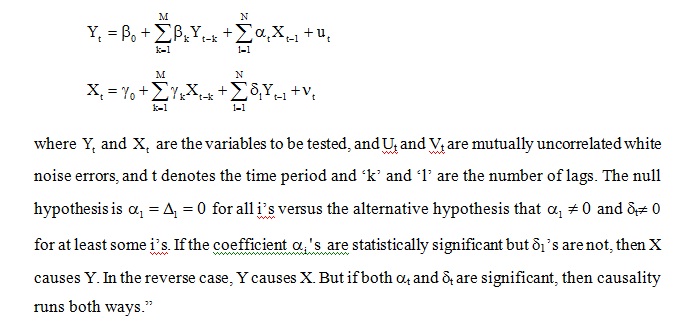
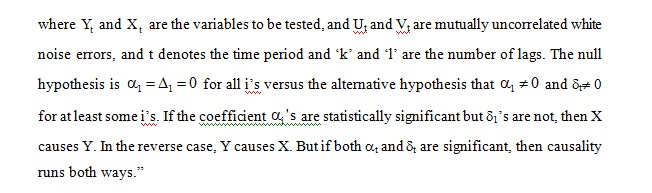
To test the causal relationship between Indian stock market and interest rates, Granger-Causality test is being used. This test uses time series data to check the statistical hypothesis. Clive Granger argued “that causality in economics could be reflected by measuring the ability of predicting the future values of a time series using past values of another time series. A time series X is said to Granger-cause Y if it can be shown, usually through a series of t-tests and F-tests on lagged values of X (and with lagged values of Y also included), that those X values provide statistically significant information about future values of Y.
The test is based on the following regressions:
Johansen Co-integration Test
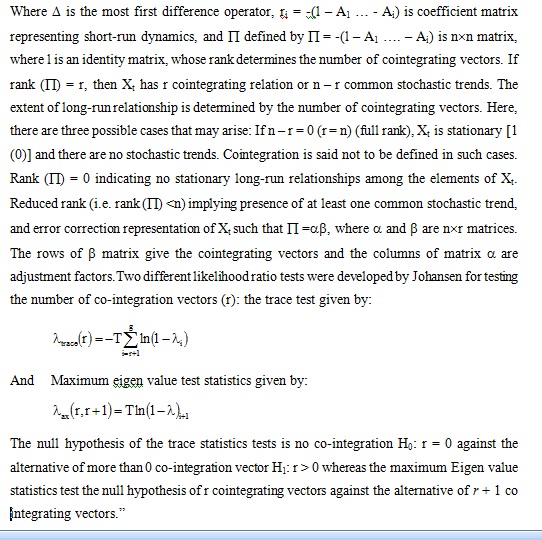
To analyse the relationship between Indian Stock market and interest rates in long run Johansen Co-integration test is used by using time series data. Johansen test named after Søren Johansen,“It is a procedure for testing co-integration of several time series. This test permits more than one cointegrating relationship so is more generally applicable than the Engle–Granger test.The Johansen multivariate co-integration approach is based on error correction representation of the p order Vector Autoregressive model with Gaussian error:

4. EMPIRICAL ANALYSIS
First of all, the data was arranged in a systematic way starting from January 2008 to December 2013. After this, stationarity of both BSE 100 series and Call money rates series (CMR) have been checked by using Augmented Dickey-Fuller test statistic of Unit Root test. At Level, BSE 100 series P-value is 0.05 which is equal to significance level 0.05, which means null hypothesis, is accepted and series is non-stationary as shown in Table 1. Similarly CMR series P-value is 0.638 which is greater than significance level 0.05, so null hypothesis is accepted and series is non-stationary at level as shown in Table 2.
|
Table 1: BSE 100 Series ADF Test at Level
|
|
|
t-Statistic
|
P-value
|
|
Augmented Dickey-Fuller test statistic
|
-2.887
|
0.05
|
|
Test critical values:
|
1% level
|
-3.485
|
|
|
5% level
|
-2.885
|
|
|
10% level
|
-2.579
|
|
|
Table 2: CMR Series ADF Test at Level
|
|
|
t-Statistic
|
P-value
|
|
Augmented Dickey-Fuller test statistic
|
-1.277846
|
0.6383
|
|
Test critical values:
|
1% level
|
-3.485115
|
|
|
|
5% level
|
-2.885450
|
|
|
|
10% level
|
-2.579598
|
|
After this, ADF unit root test has been applied at 1st difference. BSE 100 series is stationary at 1st difference as P-value is 0.0000 which is lower than significance level of 0.05 as shown in Table 3. Similarly, CMR series is stationary at 1st difference as P-value is 0.0000 which is lower than significance level of 0.05 as shown in Table 4.
|
Table 3: BSE 100 Series ADF test at First Difference
|
|
|
t-statistic
|
P-value
|
|
Augmented Dickey-Fuller test statistic
|
-10.76016
|
0.0000
|
|
Test critical values:
|
1% level
|
-3.485586
|
|
|
|
5% level
|
-2.885654
|
|
|
|
10% level
|
-2.579708
|
|
|
Table 4: CMR Series ADF test at First Difference
|
|
|
t-statistic
|
P-value
|
|
Augmented Dickey-Fuller test statistic
|
-9.471817
|
0.0000
|
|
Test critical values:
|
1% level
|
-3.486064
|
|
|
|
5% level
|
-2.885863
|
|
|
|
10% level
|
-2.579818
|
|
To apply the Granger Causality statistics, lag length need to be checked and for this Vector Auto Regression technique is used. Although the optimal lag came to be 0 using AIC Criteria but to use granger-causality test minimum lag need to be 1, so lag length is taken as 1. This is depicted in Table 5.
|
Table 5: VAR Lag Order Selection CRITERIA
|
|
Lag
|
LogL
|
LR
|
FPE
|
AIC
|
SC
|
HQ
|
|
0
|
-854.4763
|
NA
|
13136.10*
|
15.15887*
|
15.20715*
|
15.17846*
|
|
1
|
-853.7340
|
1.445264
|
13916.09
|
15.21653
|
15.36135
|
15.27530
|
|
2
|
-847.4289
|
12.05220*
|
13360.98
|
15.17573
|
15.41709
|
15.27367
|
|
3
|
-846.5729
|
1.605895
|
14128.40
|
15.23138
|
15.56929
|
15.36850
|
|
4
|
-845.6672
|
1.667118
|
14929.10
|
15.28615
|
15.72060
|
15.46244
|
|
5
|
-843.9748
|
3.055317
|
15560.18
|
15.32699
|
15.85798
|
15.54246
|
|
6
|
-843.3232
|
1.153218
|
16523.59
|
15.38625
|
16.01379
|
15.64090
|
|
7
|
-840.6557
|
4.626846
|
16936.63
|
15.40984
|
16.13392
|
15.70366
|
|
8
|
-838.2745
|
4.046040
|
17454.18
|
15.43849
|
16.25912
|
15.77149
|
|
* indicates lag order selected by the criterion
LR denotes sequential modified LR test statistic (each test at 5% level)
FPE denotes Final prediction error
AIC denotes Akaike information criterion
SC denotes Schwarz information criterion
HQ denotes Hannan-Quinn information criterion
|
After this, Granger- causality test have been checked, and it is found that there is no causality between call money rates and stock market. Neither CMR causes stock market returns nor Stock market causes CMR as P-values are 0.576 and 0.324 respectively which are greater than significance level 0.05, hence null hypothesis is rejected and it depicts there is no granger-causality between these 2 variables as shown in Table 6.
|
Table 6: Granger-Causality Test
|
|
Null Hypothesis:
|
Obs
|
F-Statistic
|
P-value
|
|
D(CMR) does not Granger Cause D(BSE)
|
120
|
0.31462
|
0.5759
|
|
D(BSE) does not Granger Cause D(CMR)
|
0.97959
|
0.3243
|
Lastly, long-run co-integration is being tested between these 2 variables using the Johansen Co-integration test, and there exists long-term co-integration between these 2 variables as P-value came out to be 0.0166 which is less than significance level 0.05 and hence null hypothesis is rejected as shown in Table 7.
|
Table 7: Johansen Co-integration Test
|
|
Hypothesized
|
|
Trace
|
0.05
|
|
|
No. of CE(s)
|
Eigenvalue
|
Statistic
|
Critical Value
|
P-value
|
|
None *
|
0.112238
|
18.58302
|
15.49471
|
0.0166
|
|
At most 1 *
|
0.038997
|
4.654032
|
3.841466
|
0.0310
|
5. CONCLUSION
In this paper, it is checked whether interest rates matter for stock markets or not by studying the nature of relationship and the causality between interest rates and stock market for the period ranging from January 2008 to December 2013 for Indian market. This period is considered to check the relationship between these two variables after post-crisis period.BSE 100 index is used as a proxy for stock market and call money rates are used as a proxy for interest rates. The bi-monthly data has been collected from www.bseindia.com and handbook maintained by Reserve Bank of India. Granger causality is used to check the short term causal relationship and Johansen co-integration tests is used to check the long run co-integration, and to check the stationarity. Augmented Dickey-Fuller Unit Root test is applied.
It is found BSE 100 series and Call money rates series are non-stationary at level and at first difference these series are stationary. And then by applying Granger-Causality test, it is found that there is no causal relationship between interest rates and stock market in Indian context. They do not lead or lag each other. But, by applying Johansen co-integration test it is seen that interest rates and stock market move together in the long run and there is co-integration between them.
The findings in this paper are particular to a study period, methodology and variables. The findings may differ if any of this change.But, the findings of this paper might help policy makers to change interest rates as part of monetary policy by considering its effects on stock prices. Further study can be done covering wider period of study and also considering more variables.
REFERENCES
Alam , Md. M. & Uddin, Md. G. S. (2009): “Relationship between Interest Rate and Stock Price: Empirical Evidence from Developed and Developing Countries”. International Journal of Business and Management, 4(3), pp. 43-51. Available at: www.ccsenet.org/journal.html.
Apergis, N. &Eleftheriou, S. (2002): “Interest rates, inflation, and stock prices: the case of the Athens Stock Exchange”.Journal of Policy Modeling, 24, pp. 231-236.
“Eviews 8 User’s Guide I” (2013) IHS Global Inc..
“Eviews 8 User’s Guide II” (2013) HIS Global INc..
Flannery, M. J. & James, C. M. (1984): “The Effect of Interest Rate Changes on the Common Stock Returns of Financial Institutions”. The Journal of Finance, 39(4), pp. 1141- 1153. Available from: http://www.jstor.org/stable/2327618?origin=JSTOR-pdf.
Gujarati, D.N., Porter, D. C. and Gunasekar, S. (2012): “Basic Econometrics”. 5th Ed. New Delhi: McGraw Hill Education (India) Private Limited.
James, C., Koreisha, S. &Partch, M. (1985): “A VARMA Analysis of the Causal Relations Among Stock Returns, Real Output, and Nominal Interest Rates”. The Journal of Finance, 40(5), pp. 1375-1384. Available from: http://www.jstor.org/stable/2328955?origin=JSTOR-pdf.
Lee, B. (1992): “Causal Relations among Stock Returns, Interest Rates, Real Activity, and Inflation”. The Journal of Finance, 47(4), pp. 1591-1603. Available from: http://www.jstor.org/stable/2328955?origin=JSTOR-pdf.
Panda, C. (2008): “Do Interest Rates Matter for Stock Markets?”.Economic & Political Weekly, 43(17), pp. 107-115. Available from: www.jstor.org/stable/40277397.
Shiller, R. J. &Beltratti, A. E. (1992): “Stock prices and bond yields”. Journal of Monetary Economics, 30, pp. 25-46.
Wong, W., Khan, H. & Du, J. (2005): “Money, Interest Rate, and Stock Prices: New Evidence From Singapore and the United States”, working paper, National University of Singapore, Department of Commerce. Available from: http://www.jstor.org/stable/2328955?origin=JSTOR-pdf.
Websites:
Reserve Bank of India website: www.rbi.org.in
Bombay Stock Exchange website: www.bseindia.com

