A Refereed Monthly International Journal of Management
Constant Market Share Analysis of Export Competitiveness of Cotton: A Comparative Study of India and China
Author
|
Dr. Mamta Pankaj Jain
Assistant Professor – Amity Business School
Amity University Rajasthan
E-mail: mamta9sep@gmail.com
Mobile: 8769073412
|
Abstract
The Textile & Clothing (T&C) sector has played a crucial role in the global economic growth and development from the era of industrial development. On January 1st, 1974, Multi Fiber Agreement came into existence. It replaced all previous agreements that were regulating global trade in T&C since 1961. Under this agreement, quotas were enforced on developing countries for the export of yarn, textile and apparel products. Agreement on Textiles and Clothing (ATC) during Uruguay Round Agreement (1994) called for progressive phasing out of MFA over a ten-year period starting from 1995 and reached by the end of 2004 so as to integrate the international trade in T&C into the General Agreement on Tariffs and Trade (GATT) rules. This paper is an attempt to investigate the impact of abolishing MFA on India’s export competitiveness in world trade of cotton vis-a vis to China. The study adopts Constant Market share analysis approach. The study finds that both India and China have increased the export competitiveness post MFA, however China increased it export competitiveness more than that of India.
Keywords: India, China, Cotton, Export Competitiveness, Constant Market Share
Constant Market Share Analysis of Export Competitiveness of Cotton: A Comparative Study of India and China
1. Introduction
The Textile & Clothing (T&C) sector has played a crucial role in the global economic growth and development from the era of industrial development. The textile sector includes industries related with fabrics, yarns, bedding, carpets etc while clothing sector is composed of industries related with garments and other sewn products (for ex. accessories) for the consumption of end users. T&C sector accounts for significant share in total volume of merchandise trade across countries (Dickerson, 1999).
|
Table 1: Top Five T&C Exporters during 2010 (USD billion)
|
|
Rank
|
Country
|
1990
|
2000
|
2008
|
2009
|
2010
|
% Ch in 2010/09
|
% share in 2010
|
|
1
|
China
|
16.89
|
52.21
|
185.77
|
167.1
|
206.74
|
23.7
|
34.3
|
|
2
|
European Union (27)
|
---
|
112.9
|
195.9
|
161
|
166.04
|
3.1
|
27.6
|
|
Extra-EU (27) exports
|
---
|
28.52
|
51.89
|
40.66
|
43.05
|
5.9
|
7.2
|
|
3
|
India
|
4.71
|
11.56
|
21.34
|
21.12
|
24.12
|
14.2
|
4
|
|
4
|
Turkey
|
4.77
|
10.21
|
22.99
|
19.28
|
21.72
|
12.7
|
3.6
|
|
5
|
Bangladesh
|
0.99
|
5.46
|
12.01
|
13.41
|
16.92
|
26.2
|
2.8
|
|
|
World
|
212.5
|
352.2
|
612
|
525.3
|
602.12
|
14.6
|
100
|
|
Source: WTO Report 2011
|
|
|
|
|
|
|
|
World trade in T&C accounted for USD 602 billion in the year 2010, growing by 14.6% from USD 525 billion in the previous year 2009. The exports were primarily dominated by developing economies that together accounted for close to 2/3 of total world exports in T&C sector. In the last decade (2000 – 2010), T&C exports of India and China both grew with a CAGR of 7.6% and 14.8% respectively which were considerably higher than the world’s CAGR of 5.5%. The market share of India and China in the total world exports of T&C also increased. However, the market share growth of China (131.62%) was much higher than that of India (22%), while India’s share grew from 3.3% to 4% China’s share grew from 14.8% to 34.3% during this period (2000 – 2010).
On January 1st, 1974, Multi Fiber Agreement came into existence. It replaced all previous agreements that were regulating global trade in T&C since 1961. Under this agreement, quotas were enforced on developing countries for the export of yarn, textile and apparel products. The first MFA was expected to stay for a short term so as to ensure a free global trade for T&C sector. However, there were successive agreements increasing its scope to include all types of fiber and it was extended till 1994. The fourth agreement on MFA was signed by eight developed countries (importers) and 37 developing countries (exporters) in 1986 which was first extended till 1991 and later up to 1994. One of the key achievements of the Uruguay Round Agreement (1994) was the Agreement on Textiles and Clothing (ATC), which called for progressive phasing out of MFA over a ten-year period starting from 1995 and reached by the end of 2004 so as to integrate the international trade in T&C into the General Agreement on Tariffs and Trade (GATT) rules. Contrary to MFA, ATC was applicable to all members of WTO.
It has been ten years since MFA has phased out. Some questions arise here such as did India gain or lose export competitiveness since MFA has completely phased out? Though Indian T&C sector has witnessed significant growth in the previous decade, yet it is still far behind from its main competitor China in terms of share in global exports and growth rate. In this context, the present study has been undertaken with the objective of investigating India’s export competitiveness in the world trade of Cotton exports, particularly in comparison to China.
The purpose of this study is to investigate India’s export competitiveness in the world trade cotton products, particularly in comparison to China. The study analyzes the exports of Cotton (HS Code- 52) for both countries. In this regard, the specific objectives of this study are:
- To assess export competitiveness of India & China for Cotton (52)
- To examine the changes in export competitiveness of Indian Cotton Exports after complete abolition of MFA
The time period for this study was taken from 2001 to 2010. A longer study period, 10 years, is important for analyzing shifts in export competitiveness. Considering that MFA was completely abolished in 2005, a five year period before and after would provide a reasonable time period for accomplishing the objectives of this study. The internationally accepted nomenclature i.e. Harmonized System (HS) classification of products published by the World Customs Organization has been used. CMS have been calculated at the two digit level of HS classification for all India and China’s cotton exports. All values of exports and imports for above mentioned selected textile products for India and China are sourced from the International Trade Centre (ITC) online database and run from 2001-2010.
1. Literature Review
In the literature, there are multiple definitions and measurements of competitiveness and no definition or measurement was found generally accepted. Literature review on competitiveness shows that though it is a major issue in international business (Dunning, 1995; Porter, 1990), yet it has not been defined well (Martin et. al., 1991; Connor, 2003). Researchers have described competitiveness as a relative concept which has many dimensions (Spence & Heather, 1988) because different aspects of competitiveness vary with time and context (Ambastha and Momaya, 2004). Competitiveness can also be seen from the perspective of geographical market or product (Cook & Bredahl, 1991). Thus no unique and generally accepted definition or measurement exist because of the debate at what level competitiveness should be measured as it can be measured either on national level, industry level or firm level. Krugman (1994) argues that firms compete with each other for exports so competitiveness should be measured on firm level. On the contrary, many researchers advocates to measure competitiveness on national level (Lall, 2001; Garelli, 2002) as they argue that nations not firms have abilities to design and develop macroeconomic systems critical for competitiveness.
The Constant Market Share (CMS) approach is a simple approach to decompose the export growth of a country into structural and competitive components. Tyszynski (1951) apply this approach as a methodological tool for analyzing the export growth of leading manufacturing nations of that time. Tyszynski (1951) uses a country’s market share in world export to express the total value of exports of that country. Leamer and Stern (1970) develop the approach further by decomposing structural effects into commodity distribution and market effect. This approach was widely adopted by many researchers for measuring export performance and competitiveness (e.g. Rigaux, 1971; Richardson, 1972; Bidun, 1980; Bowen and Pelzman, 1984; Chen and Duan, 2000; Villmann, 2003).
Rigaux (1971) apply the framework having distribution effect to analyze the wheat exports of Canada from the year 1963 to 1968. Results of the study indicate towards a significant decline from 554 million bushels to 327 million bushels. Biodun (1980) uses the CMS method in the market analysis of groundnut exports from Nigeria in 1963-1973. Bowen and Pelzman (1984) analyze the export growth of United States from 1960s to early 1970s using CMS approach. The study points out towards the negative growth of US export due to decline of competitiveness during the period of the study. Love (1984) decomposes CMS approach by using regression analysis. The author illustrates that part of the performance of a country’s export which is not explained by growth of world demand but is assigned to the competitiveness factor and attributable to commodity diversification. Chen and Duan (2000) also applied the CMS approach to assess the export competitiveness of Canadian Agri-Food exporters against Asian counterparts. The results of the study indicate towards the competitiveness of Canada in Asian market and rank it second only after China.
Tiwari (1986) uses CMS model to examine the competitiveness of Indian exports of traditional and non-traditional commodities between years 1970-1977. The results of analysis suggest that export of traditional sector as uncompetitive, whereas the export of non-traditional sector is found competitive. The study implies that India failed to maintain her market share with respect of traditional commodities, as compared to the rest of the world. Kapur S. N. (1991) empirically examine whether and to what extent the decline in Indian export performance reflected a decline in its international competitiveness and also provide an idea about the import of specific characteristics of composition of Indian exports on its total exports. This is achieved by applying the CMS model, which decomposes export growth into two broad components, the structural effect and the competitive effects. Marjit and Raychaudhuri (1997) carry out a commodity-wise prospective analysis of Indian international competitiveness in relation to relevant competitors from the developing world. The study assesses Indian position through a constant market share analysis of Indian exports in relation to the country’s major competitors. The study also analyzes the relationship between the value of exports and imports with real exchange rate movement. This study considers the macro-foundations of Indian trade problems and analyzes the tariff policy, export promotion, the quality of exports, issues of firm size and the comparative advantages of firms, and the role of foreign investment.
Although the CMS approach is found useful and widely applied in decomposing the export growth of any country so as to facilitate the study of competitiveness, this method has its own share of criticism. Richardson (1971b) and Bowen and Pelzman (1984) indicate various limitations of CMS approach. First, the empirical findings of the CMS analysis are sensitive for product classification level. Put simply if exports are analyzed at HS 2-digit level or 4-digit level or 6-digit level, results of CMS approach will not be consistent. Second, results of CMS analysis are also sensitive to the extent of market consolidation i.e. if countries are studied separately or they form a country groups such as EU. Third, the choice of the destination market(s)/ benchmark region which generally is world also affects the results. Ideally, the selected region should include only true competitors and making such choices of true competitors is hardly objective. Fourth, study takes different points of time into account for assessing the competitiveness. It thus runs the risks of masking the nature of export competitiveness
for a whole span of time (e.g. Love, 1973; Margarida and Rayment, 1984 and Richardson, 1971) cited in Fatimah and Alias (1997). Despite these limitations, the CMS approach is still a valuable and popular tool as an exploratory analysis of the export competitiveness. It offers a broad consistent framework in which the export competitiveness of a product or nation to a given market can be examined over time.
1. Research Methodology
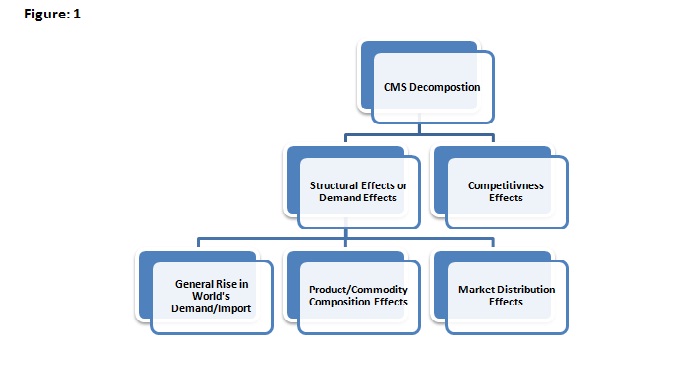
Constant Market Share method decomposes the export growth to provide a better understanding of whether this growth is coming from increased competitiveness or resulting from various other structural factors. Constant Market Share (CMS) technique facilitates to comprehend about export performance of a selected country or group of countries vis-à-vis to their competitors in choosing fast growing markets (product or destination or sectors). The basic assumption of this method is that there are three reasons because of which a country’s export growth rate may be lesser than, equal to or greater than related world export growth. These reasons are as follows
- The major share of country’s export is concentrated in products/commodities where there is relatively fast or slow growth in demand
- The major share of country’s export is directed to those destinations/regions where there is relatively fast or slow growth in demand
- The concerned country is more or less competitive to other competing countries
According to the CMS model the export growth of concern country can attribute to structural or competitive factors as depicted in the given chart
3.1 CMS Model Specification
The four key components of CMS model which play a vital role in country’s export performance are World Trade Effect (WTE); Commodity Composition Effects (CCE); Market Distribution Effects (MDE) and Competitiveness Effects (CE). Brief descriptions of these effects are given below.
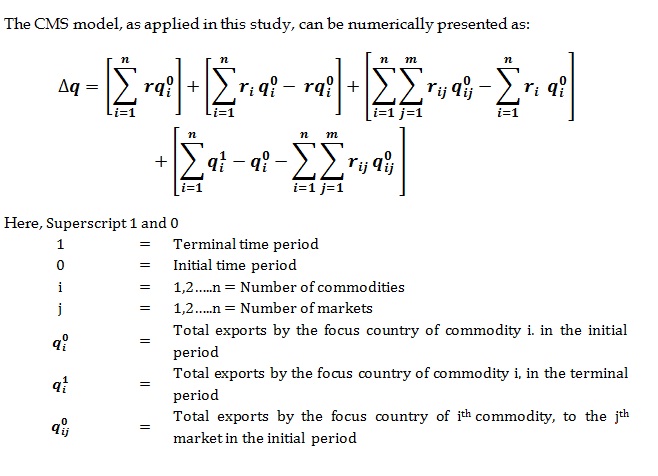
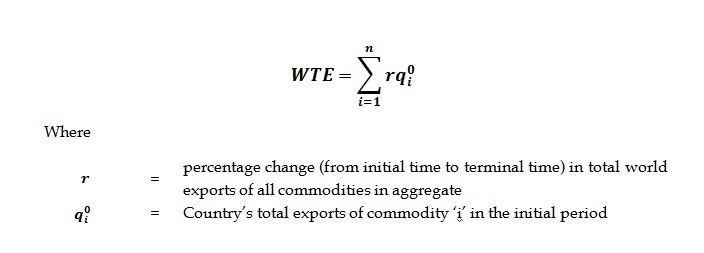
3.1.1 World Trade Effect
World Trade Effect is presented by the first part of the equation. It measures the quantum of growth in country’s export if exports of the concerned country are expected to grow at par with the world average. This means that if there is some growth/decline in country’s export, some part of this growth is attributed to the general growth/decline in world exports. Therefore rq0i may be considered as the growth/decline in the exports of country because of change in world trade assuming that country would be able to retain its initial market share. So, the rise in the focus country’s export may be because of general increase in the total demand world over, given the constant market share maintained by focus country. Numerically this can be presented as:
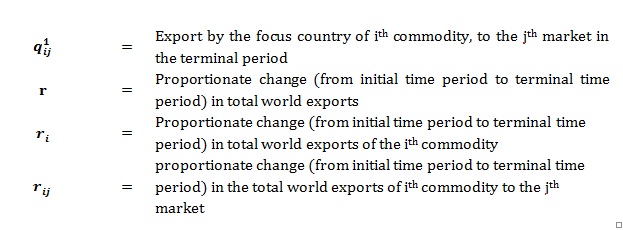
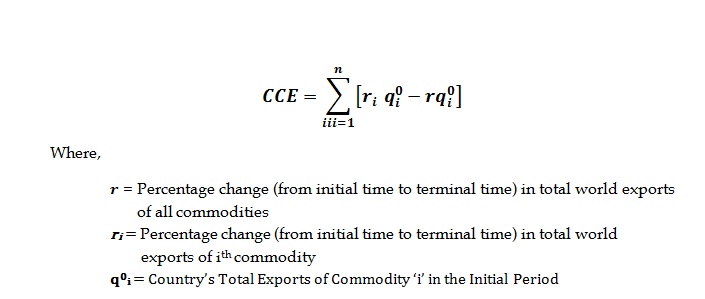
3.1.2 Commodity Composition Effect
The next part of the equation is known as the Commodity Composition Effect (CCE). This effect measures the magnitude of concentrations of country’s export composition in products/commodities where import demands are high. It is the weighted sum of export values of selected commodities. The weights are calculated by subtracting the individual commodity’s growth rate from the world’s total export growth rate in aggregate (represented by ‘r’ in previous formula). For example, as there are four commodities selected for this study, the weight of each commodity would be calculated by subtracting the growth rate of individual commodities from the aggregate growth rate of combined exports of these four commodities. The CCE takes place because of country’s natural ability to produce or manufacture that commodity coupled up with price and income elastic of these commodities. The CCE would be positive if the country’s exports are concentrated on commodities where the demand is growing with a higher rate as compared to aggregate growth rate (r) of world exports and CCE would be on negative side if exports are concentrated in those commodities where the demand is growing with relatively lesser rate. Numerically, the CCE is presented as follows
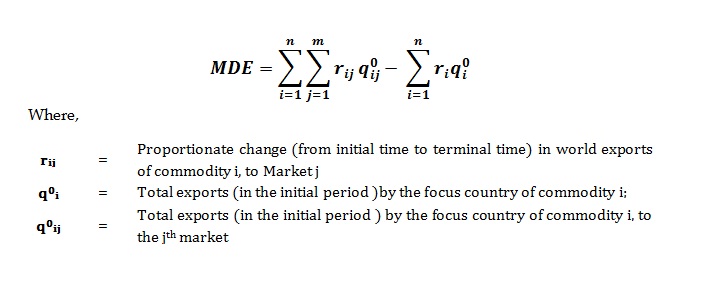
3.1.3 Market Distribution Effect
The market distribution effect (MDE) is a measure of the magnitude of country’s export concentrations to those markets (importing countries) where the demand is growing relatively higher or slower rate as compared to total growth of world exports of particular commodity in those markets (presented by ri in previous formula). It is the weighted sum of export values for individual commodities directed to particular importing country. The weight is calculated by subtracting the export growth rate of individual commodity in particular market from the aggregate growth rate of world exports in that individual commodity (ri). The MDE takes place because of trade policies of trading countries and general income growth of importing countries. The differences in exports’ growth to different countries may happen when (a) there are variations in the income elasticity of demand for various commodities, (b) For a given commodity, there are variations in the income elasticity of demand in various markets (importing countries) and (c) There are variations in real income growth rate across all markets.
Put simply; consider two markets where demand is growing with different rates. If a country sustains its constant share of exports in these two markets, it does not mean that company’s overall market share will remain same. It is because magnitudes of the markets are different and their contribution to overall market share will change as these markets are growing with different growth rate. So the overall market share will also change despite maintaining the market share in each market. Distribution effect reveals the degree to which exports of a country are focused in markets where demand is relatively faster or slower to the total demand of the world. The positive market distribution indicates towards the concentration of the exports of the concerned country in relatively faster growing markets and vice versa. The market distribution effect can be expressed as:
3.1.4 Competitiveness Effect
The last effect, the measurement of country’s competitiveness, assesses the difference between actual change in focus country’s exports and changes that would have taken place if the constant market share has been sustained in those markets by the focus country. This is a residual term as from the actual change in the exports of the focused country, three effects i.e. world trade effect, commodity composition effect and market distribution effects have been deducted. If this residual term is positive, it means there is improvement in the focus country’s competitiveness and vice versa.
However, as a measure of export competitiveness, this residual term is not free from biases because of dynamic interaction of other three effects. In relatively rapidly growing markets, the focus country may experience difficulties in matching the growth rate of those markets and this may result in declining share in world market, particularly if the magnitudes of these markets are also high. The net effect would be reflected through the –ve sign of competitive effect due to favorable market and commodity growth. However, this interdependence among the three effects of market distribution, commodity composition and the residual become small in most cases, given the ratio of exports to total production is less. The competitiveness effect may be expressed as
1. CMS Analysis for India & China for Cotton (52)
Table 2 expresses the total world export, total export of India & China and its share in world cotton export for two periods; period I (2001-05) and period II (2006-10). India’s export of Cotton (52) in value terms increased by 95.43% from USD 2307943 million to USD 4510360 million as compared to China’s export of Cotton (52) in value terms increased by 79.16% from USD 5759491 million to USD 10318943.4 million during the period I to period II where the world export increased only by 20.84% from USD 42408541 million to USD 51244778 million during the same periods. Similarly, India’s percentage share of Cotton (52) also increased from 5.44% to 8.80% from the period I to period II. However the percentage share of China in total world export is more than India as India increased its share by 3.36% where China has increased by 6.56% from 13.58% to 20.14% in the same duration.
|
Table 2: Change in Cotton Exports and Market Share of India and China in World Cotton Exports from Period I (2001 – 2005) to Period II (2006 – 2010)
|
|
|
India
|
China
|
World
|
|
Average Export (2001 - 2005)
|
2307943
|
5759491
|
42,408,541
|
|
Market Share (2001 - 2005)
|
5.44%
|
13.58%
|
100%
|
|
Average Export (2006 - 2010)
|
4510360
|
10318943
|
51244778
|
|
Market Share (2006 - 2010)
|
8.80%
|
20.14%
|
100%
|
|
Change in Exports from Period I to Period II
|
2202417
|
4559452
|
8,836,237
|
|
Change in Market Share from Period I to Period II
|
3.36%
|
6.56%
|
|
Source: Based on Authors Calculation
Table 3 indicates the relative contribution of each of the components of CMS model on the expansion of export of Cotton (52) for both the countries in the given period. Total export change of India for Cotton (52) in value term USD 2202.4166 million for the period I to II. The world trade effect and market distribution effects have positively contributed to the change in the total export of India during the period I (2001-05) to period II (2006-10) with the contribution of 48.77% and 15.08%. The results for World trade effects in the table indicates the increases in the Cotton (52) export of India with expansion in the size of world market during the period I to period II. Similarly, the results of market distribution effects exhibit that Indian export of Cotton (52) is concerted in the markets where demand is rising faster than world demand. The negative value (-26.93%) of commodity composition effects suggests that India concentrates on slowly grew markets for Cotton (52).
|
Table 3 : Results of CMS decomposition of the change in export value for COTTON (HS-52)
|
|
Decomposition
|
INDIA
|
CHINA
|
|
2001-2005 compared to 2006-2010
|
2001-2005 compared to 2006-2010
|
|
|
Value
|
%
|
Value
|
%
|
|
Change in Exports
|
2202.4166
|
100%
|
4559.4524
|
100%
|
|
World Trade Effect
|
1074.04
|
48.77%
|
2680.27
|
58.78%
|
|
Commodity Composition Effect
|
-593.156378
|
-26.93%
|
-1480.22643
|
-32.47%
|
|
Market Distribution Effect
|
332.20
|
15.08%
|
-306.65
|
-6.73%
|
|
Competitiveness Effect
|
1389.34
|
63.08%
|
3666.05
|
80.41%
|
Source: Based on Authors Calculation
During the same period, India gains market share of her export of Cotton (52) in the various markets due to its competitiveness in the export of the same product. On the other hand, total export of China has increased of USD 4559.4524 million in the export of Cotton (52) for the same period. This increase in export is mainly due to the expansion of the world market (58.78%) and its increase in competitiveness (80.41%). The negative values of Market Distribution signify that China is concerted in the markets where demand is growing relatively slower than world demand. The negative value of commodity composition effects exhibits that China focus on slowly grew markets for Cotton (52).
2. Conclusion & Recommendations
The future growth of Indian Cotton exports depends on its abilities to maintain its export competitiveness and market share. However, a cautious approach and proper planning is required for leveraging the future opportunities and dealing with challenges. Once the Indian policy makers acknowledge the important gaps between growth of Indian cotton exports and that of China, they will be able to formulate necessary policies and plans for fostering the next stage of growth and development in this sector. In order to improve cotton’s productivity, India will need to ensure appropriate irrigation facilities as approx 65% of cotton crops are still depending on rains. Further, through technology transfer and importing high quality seeds from other countries which are having better productivity such as China, Israel and Brazil, the productivity can be improved. It is also recommended that high density plantation (HDPS) in cotton and adoption of mechanized planters for HDPS seeds should be encouraged and promoted. India is the 2nd largest producer of cotton in the world but still cotton industry doesn’t keep a cotton buffer. On the contrary, China ensures that it has at least one year buffer stock of cotton for consumption. It is recommended that India need to develop such faculties and mechanism to maintain one year buffer so as it helps not only in regulating cotton prices but also in regulating supply to the domestic industry at competitive rates. China levies very high import duties on cotton items. India should pursue China to offer the similar arrangement that China offers to Pakistan i.e. zero duty import facility. This will provide a huge opportunity to boost cotton exports to China. After complete abolition of MFA, India and China both have been able to strengthen the export competitiveness they enjoy in world trade of cotton. Post MFA, the conditions are ripe for India to make the most of the opportunities, presented by abolition of MFA, by exploiting the factors advantages it enjoys like cheap and skilled labor, natural resources, demographic dividend etc.
References
Ambastha, A., & Momaya, K. (2004). Competitiveness of firms: Review of Theory, Framework, Models. Singapore Management Review , 26 (1), 45 - 61.
Biodun, F. (1980). A Market Share Analysis of Groundnut Ecports from Nigeria, 1963 - 73. Eastern African Journal of Rural Development , 13 (1&2), 113 - 143.
Bowen, H. P., & Pelzman, J. (1980). A Constant Market Share Analysis of U.S. Export Growth. Economic Discussion Paper No. 10 . U.S.: Department of Labour.
Chen, K. Z., & Duan, Y. (2000). Competitiveness of Canadian Agri-Food Exports Against Competitors in Asia (1980 - 97). Journal of International Food & Agribusiness Marketing , 11 (4), 1 -19.
Dickerson, K. G. (1999). Textile and Apparel in the Global Economy (3rd ed.). New Jersey: Prentice Hall, Inc.
Cook, M. L., & Breadhl, M. E. (1991). Agribusiness Competitiveness in the 1990s: Discussion. American Journal of Agricultural Economics , 73 (5), 1472 - 1473.
Connor, T. (2003). Managing for Competitiveness: A proposed Model for Managerial Focus. Strategic Change , 12 (4), 195 - 207.
Dunning, J. H. (1995). Think Again Professor Krugman: Competitiveness does matter. The International Executive , 39 (1), 55 - 66.
Fatima, M. A., & Alias, R. (1997). Export Performance of Selected Electrical and Electronics Products. 2nd Management Conference on "Towards Management Excellence in 21st Century Asia" (pp. 416 - 428). Penang: Asian Academy of Management and School of Management, University Sains Malaysia.
Gareli, S. (2002). Competitiveness of nations: The Fundamentals. IMD World Competitiveness Yearbook . Lausanne, Switzerland: IMD Business School, Switzerland.
Kapur, S. N. (1991). The Structure and Competitiveness of India's Exports. Indian Economic Review , 26 (2), 221-237.
Krugman, P. (1994). Competitiveness: A Dangerous Obsession. Foreign Affairs , 73 (2), 28 - 44.
Lall, S. (2001). Competitiveness, Technology and Skills. Cheltenham: UK: Edward Elgar Publishing.
Leamer, E. E., & Stern, R. M. (1970). Quantitative International Economics. Boston: Allen & Bacon.
Love, J. (1984). External Market Conditions, Competitiveness, Diversification and LDC's Export. Journal of Development Economics , 16, 279 - 291.
Margarida, P. F., & Rayment, P. (1984). Export of Manufactures from South European Countries: Deman and Competitiveness Factors. Journal of World Trade Law , 8, 235 - 251.
Marjit, S., & Raychaudhuri, A. (1997). India's Exports: An Analytical Study. New Delhi: Oxford University Press.
Martin, L., Westgren, R., & Duren, E. V. (1991). Agribusiness Competitiveness across National Boundaries. Agribusiness Competitiveness , 73 (5), 1456 - 1464.
Porter, M. E. (1990). The Competitive Advantage of Nations. New York: The Free Press.
Richardson, J. D. (1971a). Constant Market Share Analysis of Export Growth. Journal of International Economic , 1, 227 - 238.
Richardson, J. D. (1971b). Some Sensitivity Tests for a Constant Market Share Analysis of Export Growth. The Review of Economics and Statistics , 53, 300 - 304.
Rigaux, L. R. (1971). Market Share Analysis Applied to Canadian Wheat Export. Canadian Journal of Agricultural Economics , 19, 22 -34.
Spence, A., Michael, & Heather, A. (1988). International Competitiveness. Ballinger: Cambridge.
Tiwari, T. S. (1986). Constant Market Share Analysis of Export GrowthL The Indian Case. The Indian Economic Journal , 33 (3), 70 - 80.
Tyszynski, H. (1951). World Trade in Manufactured Commodities (1899 - 1950). The Manchester School of Economics and Social Studies , 33 (3), 272 - 304.
Viilmann, N. (2003). Estonia's Export of Goods in 2002 and External Competitiveness. Tallinn: Kroon & Economy.
World Trade Organisation. (2011). Retrieved May 12, 2012, from www.denimassociation.com: www.denimassociation.com/assets/Data%20analysis.pdf

