A Refereed Monthly International Journal of Management
Hybrid Mutual Fund Schemes: A Study of the Performance of Select Equity Linked Savings Scheme
Author
|
Dr. Sanjay Kumar Patel
Assistant Professor
Department of Commerce
Central University of Rajasthan
Bandersindri, Kishangarh, Ajmer-305817
E-mail: sanjaypatel@curaj.ac.in
Mob. No. 9455342135
|
Pramod Kumar Verma
Research-scholar
Faculty of Commerce
Banaras Hindu University
Varanasi – 221 005
E-mail: pramod143vns@gmail.com
Mob. No. 9453266480
|
Abstract
An Equity Linked Savings Scheme (ELSS) is an open-ended Equity Mutual Fund that not only helps to investors for saving the tax, but also gives an opportunity to grow the money and tax exemptions. The study measures the performance and growth pattern of ELSS of selected banks with the help of selected parameters such as Return, Beta (β) value, R-Square, Standard Deviation, Sharpe’s Ratio, Risk Adjusted CAGR, Expense Ratio, etc. The study concluded that the ELSS mutual funds are becoming the preferred choice of investment as it capable to provide better returns than the other tax saving options.
Key words: - ELSS, NAV, AUM, Sharpe Ratio, Risk Adjusted CAGR, Beta Value, Expense Ratio
Hybrid Mutual Fund Schemes: A Study of the Performance of Select Equity Linked Savings Scheme
An Equity Linked Savings Scheme (ELSS)[1] is an open-ended Equity Mutual Fund that not only helps to investors for saving the tax, but also gives an opportunity to grow the money. It qualifies for tax exemptions under section (u/s) 80C of the Indian Income Tax Act, 1961. Equity-linked securities can be in the form of a single stock, a group of stocks or an equity-based index, such as the S&P 500.
An ELSS is one type of hybrid mutual fund and its portfolio is a combination of range of asset categories including equity, debt, gold and real estate. The maximum is the input of equities, cumulative convertible preference shares and fully convertible debentures and a bit of bonds of companies. Money market instruments contribute the minimum portion of the total amount invested in any ELSS. The asset allocation is almost preset and is in harmony with SEBI guidelines and also depending upon the tax incentives and liquidity.
Among all investment avenues available under Income Tax Act 1961, ELSS has the scope for highest returns. National Savings Certificates and Institutional Bonds give returns at a flat percentage and nothing more than that. In contrast, ELSS being an equity based product can heighten returns way above any other fixed income instrument. These returns could be in any form like dividend or appreciation in the NAV depending upon the option chosen by the investor between dividend and growth.
There are various ELS schemes provided by the banks and financial institution to the investors due to the growing popularity of hybrid mutual fund schemes. But in case of date of inception, SBI Magnum Tax Gain Fund, Canara Robeco Equity Tax Saver Fund and Baroda Pioneer ELSS 96 Fund are the oldest schemes among ELS schemes. The study generalized the results on the basis of the performance of these ELSS. A Brief characteristic of the selected ELS schemes for the study have been given in Table 1.
[1] http://www.investopedia.com/terms/e/equity-linked-security.asp#ixzz4D2NHeODT
Table-1: Key Features of the Selected Equity Linked Saving Schemes
|
Scheme Name
|
Date of Inception
|
Minimum Investment
|
NAV as on 1st April 2005
|
NAV as on 31st March 2015
|
|
D
|
G
|
D
|
G
|
|
SBI Magnum Tax Gain Scheme
|
March 1993
|
5000
|
12.35
|
8.34
|
45.61
|
114.32
|
|
Baroda Pioneer ELSS 96 Fund
|
March 1996
|
5000
|
12.31
|
12.31
|
31.95
|
31.95
|
|
Canara Robeco Equity Tax Saver Fund
|
March 1993
|
5000
|
6.81
|
6.81
|
25.94
|
47.52
|
Source: www.moneycontrol.com Note: G = growth option D= dividend option
Review of literature
Sarkar & Majumadar (1995) evaluated financial performance of five close-ended growth funds for the period February 1991 to August 1993, concluded that the performance was below average in terms of alpha values (all negative & statistically not significant) & fund possessed high risk. No reference was provided about the timing parameters in their study. Malhotra and McLeod (1997) concluded that expense-conscious investors should look at the fund size, age, turnover ratio and cash ratio as key determinants of expenses. Their analysis of bond funds suggests that the key factors are the fund’s sales charge, weighted average maturity and size.
Jaydev. M., (1996) in his work on ‘Mutual Fund Performance: An Analysis of Monthly Returns' examined performance of two schemes during the period, June 1992 to March 1994 in terms of returns/ benchmark comparison, diversification, selectivity & market timing skills. He concluded that the schemes failed to perform better than the market portfolio (ET’s ordinary share price index). Diversification was unsatisfactory. The performance did not show any signs of selectivity & timing skills of the fund managers. Gupta, O.P. & Gupta, A. (2004) examine the investment performance of selected Indian mutual fund schemes from period of 1st April 1999 to 31st March 2003 and found that the sample funds have not earned even equivalent to risk free rate of return as well as sample funds are not adequately diversification a substantial part of the variation in fund return was not explained by market.
Muthappan, P.K. & Damodharan, E. (2006) examined the risk & return performance of Indian Mutual fund schemes. The result concluded that risk & return of mutual fund schemes are not in conformity with their stated objectives as well as sample schemes are not found to be adequately diversified. Debasish (2009) during the period from April 1996 to March 2005, he evaluated the performance of selected schemes of mutual funds on the basis of risk and return measures. The study revealed that Franklin Templeton and UTI were the best performers and Birla Sun Life, HDFC and LIC mutual funds showed poor performance.
On the basis of sample of 36 equity funds Sondhi and Jain (2010) examined the market risk and investment performance of equity mutual funds in India. The study examined that the beta of funds, open-ended or close-ended categories, size of fund and the ownership pattern significantly affect risk-adjusted investment performance of equity fund. The study revealed that, the category, size and ownership have been significant determinants of the performance of mutual fund schemes. In the study of “Mutual Fund Industry in India: An Overview” Goel & Gupta (2014) discusses the growth, challenges and opportunities of Mutual Fund Industry. They suggested that AMC has to make additional provisions for investment in technology to cope with market changing scenario.
The initials studies indicate that the income from investment in mutual fund is significant factor in determination of investment orientation of investors. But the income effect on investment decision is become limited due to the risk return captivating of investors and growth option of mutual fund became popular schemes. The recent studies found that the investor loured with the schemes which provide multiple benefits. From the time being, now banks and financial institution is providing integrated mutual fund as equity linked saving schemes. The present study analyse the ELS schemes for investment decision in mutual fund.
Objectives of the Study
The main objective of the study is to evaluate and measure the efficiency of selected ELS mutual funds schemes in the development of mutual fund industry with reference to ELS schemes provided by SBI, Canara and BOB and try to find out which scheme is highly responsible in development of mutual fund industry. For achieving main objective, following sub-objectives has been formulated:
- To review the Equity Linked Saving (ELS) Mutual Fund Schemes in India.
- To evaluate the performance of selected ELS schemes of Public sector Bank Sponsored Mutual Funds.
- To measure the efficiency of SBI, Canara and BOB sponsored ELS Mutual Fund schemes in terms of Risk and Returns.
Hypotheses
The study mainly measures the performance of ELSS in mutual fund industry on the basis of risk and return whether ELSS performs efficiently or not. Consequently, the hypothesis being tested is:
H1: There is no significant difference between the performance of ELS Scheme of SBI, Canara and BOB mutual fund.
H2: There is no significance difference between growth and dividend option of ELS schemes of mutual fund.
Research Methodology
The present study is analytical in nature and based upon secondary source of data where in selected equity linked saving schemes such as SBI Magnum Tax Gain Scheme, Baroda Pioneer ELSS 96 Fund and Canara Robeco Equity Tax Saver Fund have been covered. The performance of selected ELS schemes are taken as Explanatory Variables. The Standard Deviation, Regression, Beta, Sharpe Ratio, Risk Adjusted CAGR, Expense Ratio and Analysis of Variances (ANOVA) are used to evaluate the performance of ELS schemes. The period of the study is from the year 2006 to 2015. Data has been collected from the financial statements of the companies, SEBI and other reputed sources.
Significance of the Study
Mutual fund is an emerging investment area. But common people have a lot of confusions in selecting the best mutual fund for investment. Proper assessment of various mutual fund performances and their comparison with other funds helps retail investors for making fruitful investment decisions. Among various Mutual fund schemes, the equity linked saving schemes ensures the minimum risks with maximum returns to the investors. Thus, the study helps to investors for better investment decision.
Results and Findings of ELS Scheme
The performance evaluation of selected ELS scheme of SBI, Baroda and Canara bank is measured on the basis of selected parameters such as Total Number and Assests Under Management (AUM) of ELS Schemes, Average annual NAV, Total Return, Beta (β) of the Scheme, R-Square of the Scheme, Standard Deviation, Sharpe’s Ratio, Compound Annual Growth Rate, Risk Adjusted CAGR and Expense Ratio.
- Growth in the Number and AUM of Equity Linked Saving Schemes:
The performance of ELSS in the Indian mutual funds industry can be measured on the basis of rise in the total number of ELSS schemes prevailing in the market during the period of time. Table-2 shows the growth in number of Equity Linked Saving Schemes floated in the market and AUM in ELS scheme of mutual funds in India for the period from 1st April 2005 up to 31st March 2015.
Table-2: ELS Schemes in India in terms of Number of Schemes and AUM (2006-15)
|
Year
|
Open Ended Scheme
|
Close Ended Scheme
|
Total Schemes
|
AUM (Cr.)
|
|
2006
|
26
|
11
|
37
|
6589
|
|
2007
|
29
|
11
|
40
|
10211
|
|
2008
|
30
|
12
|
42
|
16020
|
|
2009
|
35
|
12
|
47
|
12427
|
|
2010
|
36
|
12
|
48
|
24066
|
|
2011
|
36
|
12
|
48
|
25569
|
|
2012
|
36
|
13
|
49
|
23644
|
|
2013
|
36
|
14
|
50
|
22746
|
|
2014
|
38
|
14
|
52
|
25547
|
|
2015
|
39
|
16
|
55
|
39470
|
|
Mean
|
34
|
13
|
47
|
20629
|
|
SD
|
4
|
2
|
6
|
9563
|
|
CV
|
12
|
12
|
12
|
46
|
|
Max
|
39
|
16
|
55
|
39470
|
|
Min
|
26
|
11
|
37
|
6589
|
|
CAGR (%)
|
4
|
4
|
4
|
20
|
Source- www.sebi.gov.in
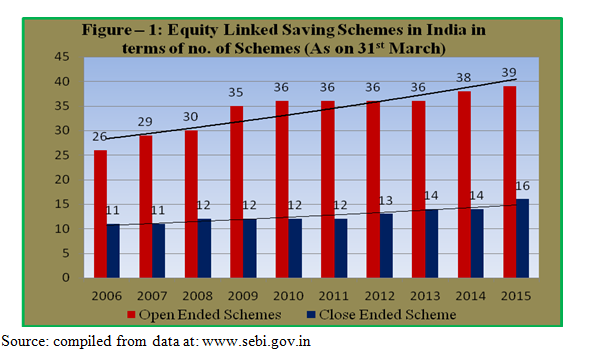
The table -2 shows an increasing number of schemes during the study period in both types of schemes. In 2006, the total number of scheme was 37 (11 close ended schemes and 26 open ended schemes) and it was grow on its peak in the year 2015 at 55 schemes. The number of open ended schemes has always been more than the number of close ended of ELS schemes.
The average number of open ended scheme is 34 for the period with standard deviation of 4 schemes and positive variation in the growth of schemes (coefficient of variation= C.V.) of 12%. It is approximately two and half times greater than the close ended scheme which is averagely 13 schemes with standard deviation of 2 schemes and 12% variation in growth of the schemes. However, the growth rate (CAGR) in close ended scheme and open ended scheme are equal.
Figure-1 clearly shows that the number of open ended schemes is quite high than close ended scheme in each year. The trend line of open ended scheme is increasing continuously from the beginning of the study period. It indicates the investors trust toward the open ended ELS scheme of mutual fund. On the basis of growth in the number
of ELS scheme, it can be concluded that the performance open ended ELSS is much better than close ended ELSS.
Assets under Management of ELSS:
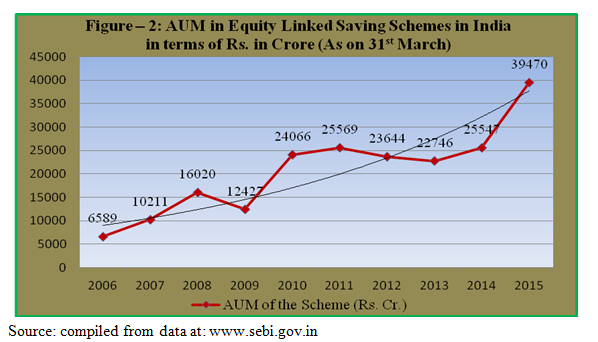
The total value of assets that a mutual fund administers for itself and its customers is known as Assets Under Management or AUM. This value reflects position of the specific fund in the mutual fund industry as a whole. The amount of AUM is simple and the most prominent factor to determine the success or failure of a single fund or an industry.
Table -2 reveal that in case of ELSS, the AUM was Rs. 6,589 crore in 2006 and it was rapidly grow at Rs. 24,066 crore in 2010 and Rs. 39,470 crore in 2015. The CAGR of AUM in ELS scheme is 20% for the period. The average AUM is Rs 20629 crore for period with variation (C.V.) of 46% in growth of ELSS. The rapid growth of AUM shows the future prospect of mutual fund sector. The Figure -2 indicates that there is progressive trend with little fluctuation during study period in AUM of ELS scheme. It was tremendous increase from March 2006 to March 2015 (from 6589 crores to 39470 crores).
- Average Annual Net Assets Value (NAV)
The Equity Link Saving funds have been compared on the basis of their average annual NAVs and their growth over and above the previous year values. Table-3 reveals that the ELSS have seen a fluctuated growth in terms of their NAV, after the worst effect of subprime crisis of the U.S in the year 2008 which were caused due to excess lending provided by reputed American banks to people with low or poor credit worthiness. Firms like Bear Sterns, Lehman Brothers, and Meryl Lynch had gone broken and many others were finding it tremendously tricky to balance on their feet. In order to strengthen their balance sheets, these banks wrapped up positions in developing markets which led to a losing swing in markets like India. A simple case in point was the intraday 1400 points fall on the BSE in January 2008 that was brought about by City Bank unwinding its position in many front line stocks in India. In these testing times all the ELSS gave negative growth.
The highest average NAV in a year recorded in the period of study was 114.32 by SBI Tax Saver growth option in the year 2014-15. This scheme has also given highest average NAV of Rs. 59.19 for study period. While the least positive average NAV in the year 2008-09 was of Rs.10.85 by Canara Robeco Equity Tax Savings with lowest average NAV of Rs.16.86 for study period. It is also found that initially when the scheme is launched, the NAV of its growth and dividend option remains more or less closer. But, gradually huge differences between the two values can be seen which is due to intensive ploughing back of profits by growth options which leads to appreciation in the value of investments.
The highest average NAV of dividend option of ELS scheme, for the study period, is Rs. 32.03 of SBI Magnum with variation (CV) of 20.85% (Table 3). The highest overall growth rate (CAGR) of dividend option in Canara Robeco is 7.97%. In the growth option of ELS scheme, the SBI Magnum quotes the highest average NAV as Rs. 59.19 with variation of approximately 40% but the highest overall growth rate (CAGR) in growth option of ELS scheme is represent by Canara Robeco at14.71%. It reveals that the performance of dividend option of SBI Magnum ELS scheme is better but in terms of NAV, Canara Robeco ELSS is giving more consistent growth rates in comparison to its counterparts.
Table –3: Comparative Table for Annual Average NAV of Selected Banks’ ELS Mutual Fund Schemes
(As on 31st March 2015)
|
YEAR
|
SBI Magnum Tax Gain Scheme
|
Baroda Pioneer ELSS 96 Fund
|
Canara Robeco Equity Tax Saver Fund
|
|
D
|
%
|
G
|
%
|
D
|
%
|
G
|
%
|
D
|
%
|
G
|
%
|
|
2005-06
|
24.71
|
|
36.70
|
|
18.29
|
|
18.29
|
|
12.05
|
|
12.05
|
|
|
2006-07
|
28.56
|
15.58
|
42.42
|
15.59
|
18.49
|
1.09
|
18.49
|
1.09
|
12.66
|
5.06
|
12.66
|
5.06
|
|
2007-08
|
34.50
|
20.80
|
51.07
|
20.39
|
22.87
|
23.69
|
22.87
|
23.69
|
15.76
|
24.49
|
15.76
|
24.49
|
|
2008-09
|
20.88
|
-39.48
|
30.91
|
-39.48
|
12.93
|
-43.46
|
12.93
|
-43.46
|
10.85
|
-31.15
|
10.85
|
-31.15
|
|
2009-10
|
35.46
|
69.83
|
57.80
|
86.99
|
24.23
|
87.39
|
24.23
|
87.39
|
19.21
|
77.05
|
23.33
|
115.02
|
|
2010-11
|
33.01
|
-6.91
|
60.07
|
3.93
|
24.74
|
2.10
|
24.74
|
2.10
|
18.21
|
-5.21
|
25.83
|
10.72
|
|
2011-12
|
32.05
|
-2.91
|
58.35
|
-2.86
|
21.73
|
-12.17
|
21.73
|
-12.17
|
17.29
|
-5.05
|
25.96
|
0.50
|
|
2012-13
|
30.88
|
-3.65
|
62.95
|
7.88
|
21.41
|
-1.47
|
21.41
|
-1.47
|
17.15
|
-0.81
|
27.89
|
7.43
|
|
2013-14
|
34.65
|
12.21
|
77.35
|
22.88
|
23.76
|
10.98
|
23.76
|
10.98
|
19.46
|
13.47
|
32.95
|
18.14
|
|
2014-15
|
45.61
|
31.63
|
114.32
|
47.80
|
31.95
|
34.47
|
31.95
|
34.47
|
25.94
|
33.30
|
47.52
|
44.22
|
|
Mean
|
32.03
|
|
59.19
|
|
22.04
|
|
22.04
|
|
16.86
|
|
23.48
|
|
|
SD
|
6.68
|
|
23.66
|
|
4.99
|
|
4.99
|
|
4.41
|
|
11.38
|
|
|
CV
|
20.85
|
|
39.98
|
|
22.64
|
|
22.64
|
|
26.15
|
|
48.47
|
|
|
Max
|
45.61
|
|
114.32
|
|
31.95
|
|
31.95
|
|
25.94
|
|
47.52
|
|
|
Min
|
20.88
|
|
30.91
|
|
12.93
|
|
12.93
|
|
10.85
|
|
10.85
|
|
|
CAGR (%)
|
6.32
|
|
12.03
|
|
5.74
|
|
5.74
|
|
7.97
|
|
14.71
|
|
|
Source: www.sebi.gov.in
Note: G = growth option D = dividend option (% = % growth over the previous year NAV)
|
- Total Return:
The total returns are the difference between the net asset value (NAV) of two separate dates divided by the NAV of the preceding date. It measures the overall profitability performance of the schemes. It can be calculated as:
Total Return = (Closing NAV - Opening NAV) / Opening NAV)*100
The return values of S&P CNX 500 index (335.76%) has also been taken as a benchmark for more effective interpretation of the results.
Table – 4: Comparative Table of Total Return in ELS Schemes (%)
(As on 31st March 2015)
|
SBI Magnum Tax Gain Scheme
|
Baroda Pioneer ELSS 96 Fund
|
Canara Robeco Equity Tax Saver Fund
|
|
Growth
|
Dividend
|
Growth
|
Dividend
|
Growth
|
Dividend
|
|
523.34
|
269.31
|
159.55
|
159.55
|
597.80
|
280.91
|
Source: Calculated from the table-3 average annual value (2006-15)
Table-4 shows that only growth option of Canara Robeco and SBI Magnum maintains the standards. The Canara Robeco ELSS is giving highest returns to their investors of 597.80% (growth option). Second maximum ELSS return is recorded by SBI Tax Savings growth option (523.34%). In the dividend option, canara Robeco is the leading scheme. It can be concluded that SBI and Canara Robeco ELSS, during last decade gives more return than benchmark return in growth options. In nut shell, Canara Robeco ELSS is the more profitable scheme.
- Beta (β) of the Schemes:
Beta is the measurement of volatility of the return with fluctuation in the market return. It can be calculated as:-
Beta (β) = Covariance of Portfolio Return and Market Return/Variance of Market of Market Return
OR Beta (β) = ∑xy/∑x2
Beta is a measure of risk which applied to a fund provides functional statistical information. It indicates a fund's precedent price volatility relative to a particular stock market index. A fund with a Beta greater than 1 is considered more volatile than the market and less than 1 means less volatile.
Table – 5: Comparative Table of Beta (β) in ELS Schemes (%)
(As on 31st March 2015)
|
SBI Magnum Tax Gain Scheme
|
Baroda Pioneer ELSS 96 Fund
|
Canara Robeco Equity Tax Saver Fund
|
|
Growth
|
Dividend
|
Growth
|
Dividend
|
Growth
|
Dividend
|
|
1.326
|
0.347
|
0.253
|
0.253
|
0.642
|
0.244
|
Source: Calculated from the table-3 average annual value (2006-15)
Table -5 reveals the Beta value of fund returns of the selected ELSS schemes as on 31st March 2015 calculated on the basis of average returns of the last ten years. The table shows that the Beta value of SBI Magnum Tax Gain growth option at 1.326. It is maximum in line with the changes in the market. The fund which is least affected by the market risk is BOB Pioneer ELSS. As per the risk measure is concerned, it can be concluded that SBI ELSS most volatile towards the market fluctuation as compared to their counterpart growth options and Baroda ELSS is less risky.
- R-Square of the Schemes:
R-square measures a fund's movements against its particular benchmark index on a scale. Here, R-square means that portion of change in NAV which is affected by the change in the market. The ‘Market’ refers to BSE Index. In Table-6, R-square values of the selected ELSS has been given as on 31st March 2015 which have been calculate by using the daily returns of the last ten years. Here r2 has been calculated between portfolio return and Benchmark S&P CNX 500 index return.
Table –6: Comparative Table of R - Square value in ELS Schemes (%)
(As on 31st March 2015)
|
SBI Magnum Tax Gain Scheme
|
Baroda Pioneer ELSS 96 Fund
|
Canara Robeco Equity Tax Saver Fund
|
|
Growth
|
Dividend
|
Growth
|
Dividend
|
Growth
|
Dividend
|
|
0.88
|
0.76
|
0.72
|
0.72
|
0.89
|
0.86
|
Source: Calculated from the table-3 average annual value (2006-15) and S&P CNX 500 index
The highest R-square was noted of Canara Robeco ELSS growth option with the value of 0.89 (table-6) which implies that 89% of the change in the NAV of ELS fund is due to the fluctuations in the market. The fund which is most adequately diversified is the BOB Pioneer ELSS 96 in both options with an R-square of 0.72. The table also indicates that market condition is more a descriptive variable for the NAVs of ELSS. In a nutshell, it can be said that on an average portfolios of all ELSS are effectively distributed. In the light of R- square it can be conclude that BOB Pioneer ELSS 96 is less market sensitive in comparison to other.
- Standard Deviation:
Standard deviation is the most used measure to estimate a fund's risk than any other. In simple way, it measures how much a fund’s return varies around its mean or average value. Thus, A higher value of standard deviations means more deviation from its average rate of return. The table-7 reveals the standard deviations of fund returns of all the selected ELSS as on 31st March 2015 which have been calculated by using the daily return values of the schemes.
Table –7: Comparative Table of Standard Deviation value in ELS Schemes (%)
(As on 31st March 2015)
|
SBI Magnum Tax Gain Scheme
|
Baroda Pioneer ELSS 96 Fund
|
Canara Robeco Equity Tax Saver Fund
|
|
Growth
|
Dividend
|
Growth
|
Dividend
|
Growth
|
Dividend
|
|
23.66
|
6.68
|
4.99
|
4.99
|
11.38
|
4.41
|
Source: Calculated from the table-3 average annual value (2006-15)
It is clear from the table 7 that the highest Standard Deviation (S.D) is represented by SBI Magnum Tax Gain scheme (23.66 for growth option) followed by Canara Robeco ELSS (11.38 for growth option). It means that this fund gives the most unpredictable returns. The Baroda ELSS shows lowest deviation in its return. Therefore, it can be concluded that growth option ELSS are more volatile and random as compared to dividend option ELSS in terms of their returns and BOB Pioneer ELSS 96 is most consistent performer.
- Sharpe’s Ratio:
Sharpe’s Ratio model evaluates funds on the basis of reward per unit of total risk. A high and positive Sharpe’s ratio is an indication of a finer risk adjusted performance. Here the Sharpe’s Ratios have been calculated on the basis of average portfolio return, Standard Deviation of the fund in the last decade and 91 day Treasury Bill return (risk free rate of return). The table-8 shows the Sharpe’s ratios of all the selected ELSS as on 31st March 2015 along with Sharpe’s ratio of the S&P CNX 500 index as the benchmark for more effective analysis of the data.
Table –8: Comparative Table of Sharpe’s Ratio in ELS Schemes (%)
(As on 31st March 2015)
|
S&P CNX 500
|
SBI Magnum Tax Gain Scheme
|
Baroda Pioneer ELSS 96 Fund
|
Canara Robeco Equity Tax Saver Fund
|
|
|
Growth
|
Dividend
|
Growth
|
Dividend
|
Growth
|
Dividend
|
|
3.29
|
2.21
|
3.76
|
3.03
|
3.03
|
1.45
|
2.25
|
Source: Calculated from the table-3 average annual value (2006-15)
The table-8 clearly indicates that the ratio of all the schemes is less than the benchmark index. All the funds have at most given better outcomes than the market. SBI Magnum Tax Gain fund (3.76 dividend option) can be adjudged as the best amongst selected fund houses. So it can be concluded that on an average SBI Magnum Tax Gain is managed to provide superior domino effects as compared to other ELSS.
- Compound Annual Growth Rate:
Compound Annual Growth Rate is the year-over-year growth rate of an investment is for a specified period of time. It is an improved version of the total percentage growth rate. Table-9 shows the CAGR of benchmark and selected ELSS, calculated on the basis of average annual return of the year 2005-2006 and 2014-2015.
Table –9: Comparative Table of CAGR in ELS Schemes (%)
(As on 31st March 2015)
|
S&P CNX 500
|
SBI Magnum Tax Gain Scheme
|
Baroda Pioneer ELSS 96 Fund
|
Canara Robeco Equity Tax Saver Fund
|
|
|
Growth
|
Dividend
|
Growth
|
Dividend
|
Growth
|
Dividend
|
|
12.22
|
12.03
|
6.32
|
5.74
|
5.74
|
14.71
|
7.97
|
Source: Calculated from the table-3 average annual value (2006-15)
Table -9 indicates that BOB Pioneer ELSS 96 is giving least CAGR of 5.74% in both growth and dividend options, which is much lower than benchmark return and from the least CAGR of others. Canara Robeco growth option being the exceptionally good performer is given a positive CAGR (14.71%) i.e. it can be assumed that it is grown with every compounding cycle. This growth is even higher than the growth experienced by our benchmark index (12.22%). Hence, it can be concluded that the Equity Linked Saving Schemes of Canara Robeco provides higher growth opportunity than other selected bank.
- Expense Ratio:
The bank is done various expenses to comply with and control of any mutual fund schemes. All such expenses and charges can be evaluated under a single category called expense ratio. Expenses are the decision making measure of how superior the returns of a mutual fund will be. In Table 10, the average Expense Ratios of the selected tax saver schemes is given on the basis of the data for the period starting from 1st April 2005 up to 31st March 2015. Higher ratio shows the inefficiency in management of cost and lower ratio shows efficiency in management of operating cost of funds.
Table-10: Comparative Table of Expense Ratio of ELS Scheme (%)
(As on 31st March 2015)
|
Scheme Name
|
SBI Magnum Tax Gain Scheme
|
Baroda Pioneer ELSS 96 Fund
|
Canara Robeco Equity Tax Saver Fund
|
|
2005-06
|
2.14
|
1.27
|
1.25
|
|
2006-07
|
1.89
|
1.30
|
1.15
|
|
2007-08
|
2.5
|
1.69
|
2.50
|
|
2008-09
|
2.5
|
2.50
|
2.50
|
|
2009-10
|
1.78
|
2.50
|
2.38
|
|
2010-11
|
1.81
|
2.50
|
2.33
|
|
2011-12
|
1.82
|
2.50
|
2.29
|
|
2012-13
|
2.21
|
3.22
|
2.65
|
|
2013-14
|
2.28
|
3.02
|
2.59
|
|
2014-15
|
2.26
|
2.88
|
2.63
|
|
Average
|
2.12
|
2.34
|
2.23
|
|
SD
|
0.28
|
0.69
|
0.56
|
|
CV
|
13.13
|
29.49
|
24.93
|
|
Maximum
|
2.50
|
3.22
|
2.65
|
|
Minimum
|
1.78
|
1.27
|
1.15
|
|
CAGR
|
0.55
|
8.53
|
7.72
|
Source: www.valueresearchonline.com
The lowest expense ratio of ELS schemes during the study period is presented by Robeco Equity Diversified Fund. It spent only 1.15% of its returns earned on operational activities in a specific year (2006-07). The maximum average expense ratio position is held by Baroda Pioneer Growth Fund (3.22%) which indicates Baroda Pioneer is not able to control its operational expenses.
The mean of overall expense ratio for the period is 2.12% with variation of 13.13% of SBI’s ELS scheme, 2.34% with variation of 29.49% of Baroda,s ELS scheme and 2.23% with variation of 24.93% of Canara’s Scheme (table 6.30). Therefore, it can be concluded that on an average all three are almost similar, but SBI Magnum Tax Gain is better in expenses performer. SBI Magnum Tax Gain scheme is found the most misers towards the operational expenses which included items like fund manager’s fee, audit fee etc. during the study period.
- Statistical testing of difference between average NAVs of selected ELSS:
The data for the ELSS was tested separately for growth and dividend option. To begin with the choice of the five schemes has been justified by trying to know whether there is significant difference between the average NAVs of their ELSS or not. For this ANOVA was applied:
Table – 11: ANOVA Results for Mean of NAVs of ELS Schemes
|
|
Sum of
Squares
|
df
|
Mean
Square
|
F
|
Sig.
|
|
GROWTH Option
|
Between Groups
|
8859.944
|
2
|
4429.972
|
18.605
|
.0008
|
|
Within Groups
|
6429.048
|
27
|
238.113
|
|
|
Total
|
15288.992
|
29
|
|
|
Dividend Option
|
Between Groups
|
1189.644
|
2
|
594.822
|
20.065
|
.0004
|
|
Within Groups
|
800.394
|
27
|
29.644
|
|
|
Total
|
1990.038
|
29
|
|
Table-11 reveals the output of the One Way ANOVA analysis and check the significant difference between mean of NAVs of ELSS. In the case of growth option and dividend option significance level is 0.0008 and 0.0004, which are less than significance level 0.05. Therefore the null hypothesis is rejected. Hence null hypothesis which states that there is no significant difference between mean of NAVs of ELSS has also rejected. So, the interpretation will be that there is significant difference between the selected mutual fund average NAVs.
CONCLUSION:
On the whole taking ELSS as the representative sample for the Indian mutual funds industry it can be summarized by saying that mutual funds are fast becoming the preferred choice of investment for the literate working class as that are capable of providing better returns than the other tax saving options. There is continues growth in total no. of scheme options available in the market in this category and their AUM has also shows increasing trend. The investors can park their funds in these equity schemes for now.
References:
Acharya, Debashis & Sidana, G. (2007). Classifying Mutual Funds in India: Some results from clustering. Indian Journal of Economics and Business, 6(1): 71-79.
Bala, Ramaswamy, Mathew, C. H. and Yeung (2003), “Evaluating Mutual Funds in an Emerging Market- Factors that matter to Financial Advisor”,
Chang, Eric C., & Lewellen, Wilbur G. (1984). Market Timing and Mutual Fund Investment Performance. The Journal of Business. 57(1), 57-72.
Debasish & Sathya, S. (2009). Investigating Performance of Equity-based Mutual Fund Schemes in Indian Scenario. KCA Journal of Business Management, 2(2):1-15.
Goel & Gupta (2014), lMutual Fund Industry in India: An Overview, International Journal of Emerging Research in Management &Technology ISSN: 2278-9359 (Volume-3, Issue-5)
Gupta, M. and Aggarwal, N. (2007), “Performance of Mutual Funds in India: An Empirical Study”, The IUP Journal of Applied Finance, Vol. 13, No. 9, pp. 5-16.
Gupta, Manak C. (1974). Mutual Fund Industry and Its Comparative Performance. The Journal of Quantitative and Financial Analysis. 9(5) (1974 Proceedings), 891-92.
Gupta,O.P. & Sehgal, S., (1997), Investment Performance of Mutual Funds-The Indian Express', 'Indian Capital Market-Trends & Dimensions', published in Tata McGraw Hill Publishing Company Ltd. pp 1-41.
Jayadev, M. (1996), “Mutual Fund Performance: An Analysis of Monthly Returns”, Finance India, Vol. X, No.1, pp. 73-84.
Jaydev. M., (1996) Mutual Fund Performance: An Analysis of Monthly Returns', Finance IndiaVol. X, No. 1, (March), pp. 73-84.
Malhotra & McLeod. (1997). An Empirical Analysis of Mutual Fund Expenses. Journal of Financial Research. 17(2), pp:145-164
Performance evaluation of selected Mutual Fund schemes, ICFAI Journal of applied finance Vol. 10, No.12.
Performance evaluation of selected Mutual Fund schemes, ICFAI Journal of applied finance Vol. 10, No.12.
Risk adjusted performance evaluation of Indian Mutual Funds, Finance India Vol. XX No. page 965-983.
Risk adjusted performance evaluation of Indian Mutual Funds, Finance India Vol. XX No. page 965-983.
Sarkar, J. & Majumadar S., (1995) Weak form of Efficient Market Hypothesis'. A Special Analytical Investigation', Vikalpa, (April-June)pp.25-30.
Sharpe, William F. (1966). Mutual Fund Performance. The Journal of Business. 39(1) Part 2: Supplement on Security Prices, 119-138.
Sharpe, William F. (1966). Mutual Fund Performance. The Journal of Business. 39(1) Part 2: Supplement on Security Prices, 119-138.
Sondhi, H.J., & Jain, P.K. (2010). Market Risk and Investment Performance of Equity Mutual Funds in India: Some Empirical Evidence. Finance India, XXIV (2):443-464.
Sondhi, H.J., & Jain, P.K. (2010). Market Risk and Investment Performance of Equity Mutual Funds in India: Some Empirical Evidence. Finance India, XXIV (2):443-464.
Tripathy, N. P. (2006), “Market Timing Abilities and Mutual Fund Performance: An Empirical Investigation into Equity Linked Saving Schemes”, XIMB Journal of Management, Vol. 3, No. 2, pp. 127-138.
Turan, M.S. and Bodla, B.S. (2001), Performance Appraisal of Mutual Funds, Excel Books, New Delhi.
Yadav, R.A. and Mishra, Biswadeep (1996), “Performance Evaluation of Mutual Funds: An Empirical Analysis”, MDI Management Journal, Vol. 9, No. 2, pp. 117-125.
http://www.investopedia.com
http://www.moneycontrol.com
www.barodapioneer.in
www.canararobeco.com
www.mutualfundsindia.com
www.rbi.org.in
www.sbimf.com
www.sebi.gov.in
www.valueresearchonline.com

