A Refereed Monthly International Journal of Management
Study on the effect of Service Quality on Customer Perception in Private Sector Banks in West Bengal– A SERVQUAL based approach
Author
|
Prof. Meghdoot Ghosh
PGDEM, MBA, UGC (NET), PhD (pursuing)
Assistant Professor
Institute of Management Study, Kolkata
|
Prof. Rituparna Ghosh
PGDHRM, DBF, MBA, PhD (pursuing)
Assistant Professor
Institute of Management Study, Kolkata
|
ABSTRACT
The quality of the service has a significant impact on any organization's market performance and subsequently, economic performance. Service Providers are under constant pressure to elaborate that their services are customer-oriented and that continuous performance improvement is being delivered. Given the financial and other resource constraints under which any organizations must manage, it is essential that the customer expectations are properly understood and measured and that, from the customers ’ perspective, any gaps in service quality are identified. Measuring Service Quality becomes indispensable for any service organization to monitor and control the quality of service delivery and enjoy competitive advantage. This study aims to estimate the gaps in service quality in banking sector by applying the SERVQUAL framework.
KEYWORDS:
Banking Sector, GAP Model, SERVQUAL, Perceived Value, Expected Value, Customer satisfaction
INTRODUCTION
Banking service is intangible and it plays crucial role not only in the economic development of any country but also in the development of human life. Customer service is an integral part of any facet of banking and it defines the future of any banking organization. In this era of stiff competition, banks in India have realized the importance of achieving high levels of customer satisfaction by providing quality service to the customers. The choice and preference of the customers for selecting a bank depends on not only on the offered services by the banks but also on the quality of the services and the way services are offered to customers. Service quality is particularly essential in the banking services because it provides high level of customer satisfaction and hence it becomes a key to competitive advantage which leads to customer retention. Service quality also has a significant impact on a bank’s success and performance. Technology made tremendous impact by introducing “anywhere banking” and “anytime banking”. It’s the quality of the product or service, that satisfies a customer. Service quality is especially important in the banking sector because differentiation of products is difficult and duplication of products and services is relatively easy. Thus, quality becomes the only differentiator and the key to continuing success. Banks that wish to succeed and stay ahead must, therefore, systematically build a structure that aims at providing Total Quality Service. In a service sector like banking industry, the whole range of activity and generation of income swivels around the customer. With increasing competition, banks that survive and succeed will be the one that provide quality service. Research studies have repeatedly proved that customers are willing to pay for quality service. Thus it is necessary to reduce the service gap to deliver superior quality of service to retain existing customers as well as to attract new customers.
LITERATURE REVIEW
Customer service has become a distinct component of both product and service sectors with the developments in information technology. Service Loyalty is the degree to which a customer exhibits repeat purchasing behavior from a service provider. Gremler & Brown, (1996) attempts to create framework by examining loyalty by looking at the three antecedents to service loyalty: satisfaction, switching costs and interpersonal bonds. “Service Loyalty” is the most important aspect in the age of relationship marketing. Loyal customers create value for any business through a range of positive outcomes such as, repeat purchases, recommendation and reduced response to competitor activity. The worldwide trend toward service quality was initiated in the 1880s when businesses realized that a quality product, in itself, is not guaranteed to maintain competitive advantage (van der Wal et al., 2002). Service quality, customer satisfaction and customer value have become the main concern of both manufacturing and service organizations in the increasingly intensified competition for customers in today's customer-centered era (Wang et al., 2004).
Satisfaction with a bank's products and services thus also plays a role in generating loyalty. Customer loyalty is not the same as customer retention, as loyalty is distinct from simple repurchase behaviour. Service loyalty reduces all incurred costs and thus increase profitability of any business. Thus managers are under increasing pressure to demonstrate that their services are customer-focused and continuous performance improvement is being delivered. All business basically aims at 3Rs. They are "Retain old customers", Recruit new customers, Regain lost customers". The retention cost is cheaper than to recruit a new customer (Barsky, 1994). The purchase demand of service depends on the service quality as perceived by the customers (Bass, 1974; Tranberg and Hansen,1986). Jacoby and Chesnut (1978) have interpreted loyalty as patterns of repeat purchase of product or service.
Numbers of strategies have been introduced to retain customers. In order to attract and retain existing customers and increase loyalty, many banks have introduced innovative product and services ( Alam and Khokhar, 2006). Service quality influences the customer’s intentions to buy a specific brand provided by a bank. Evidence suggests that service quality influences consumer behavior and intention (Veloutsou et al.,2004; Ruyter et al., 1998). Morgan and Hunt (1994) have added reliability and integrity are also important elements for trust on partner. Customer loyalty depends on customer satisfaction, inter-personal bonds and switching cost.
Given the financial and resource constraints under which service organizations must manage, it is essential that customer expectations are properly understood and measured. From the customer’s perspective, if any gaps are there in service quality are to be identified. This information then assists a manager in identifying cost-effective ways of closing service quality gaps and of prioritizing which gaps to focus on. (Chowdhury, Rahman & Afza, 2007).
2.1 Service Quality Dimensions & Quality Gap Model
2.1.1 Service Quality Dimensions
Parasuraman et al. in 1988, proposed 10 service quality dimensions. They included reliability, responsiveness, competence, access, courtesy, communication, creditability, security, understanding (customer’s knowledge) and tangibles. They simplified the ten dimensions of service quality into five dimensions as tangibility, reliability, responsiveness, assurance and empathy. These five dimensions measure the performance of 22 items in the SERVQUAL scale.
Every company (both product and service) wants to get loyal customers which add to repeating purchases and thus helps to yield maximum revenue. We have used five types of service quality dimensions as defined by Parasuraman, Zeithaml & Berry, 1988.
Dimension 1- Tangibility
Dimension 2- Reliability
Dimension 3- Responsiveness
Dimension 4- Assurance
Dimension 5- Empathy
The factors covered by the dimensions are given in the following Table1
Table 1: Dimensions & Factors of Service Quality
|
Dimensions
|
Factors
|
|
Tangibles
|
Physical facilities, equipment and appearance of personnel.
|
|
Reliability
|
Ability to perform the promised service dependably and accurately.
|
|
Responsiveness
|
Willingness to help customers and provide prompt service.
|
|
Assurance
|
Knowledge and courtesy of employees and their ability to inspire trust and confidence.
|
|
Empathy
|
Caring and individualized attention that the firm provides to its customers.
|
2.1.2 Service Quality Gap Model
To develop greater understanding of the nature of service quality and deliver high quality service, Parasuraman, Zeithaml and Berry developed a model that shows major requirements for delivering high-quality service (Figure 2)
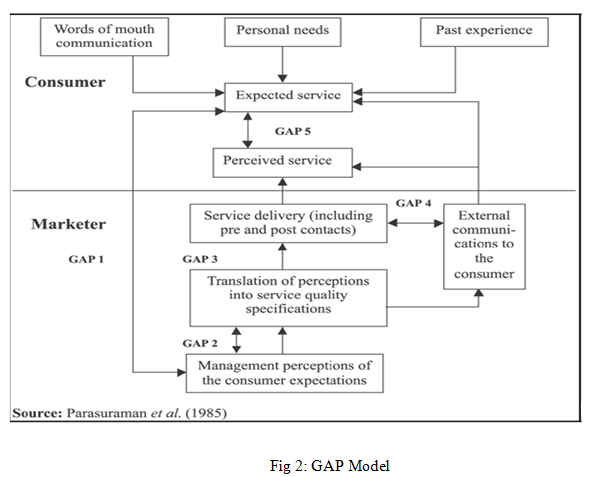
This model in Fig 2 clearly shows that consumers’ quality perceptions are influenced by a series of five gaps. Any of the five possible gap points can be the cause of matching of consumer expectations and the perceived service quality.
- OBJECTIVES OF THE STUDY
- To study the customer’s perception of the different dimensions of banking service quality in West Bengal.
- To analyze & estimate the GAP between the perceived service and expected service quality of the customers regarding the banking service in West Bengal.
- DATA COLLECTION METHODOLOGY
4.1 Sampling Plan
Extent: Kolkata & Howrah districts in West Bengal.
Sampling Method: Area Sampling Method (type of Cluster Sampling where the cluster units are country / states / districts etc) is used to select 2 districts (Kolkata and Howrah) randomly. From the 2 districts we randomly select 75 customers from Axis Bank & HDFC Bank.
Sample size: 75 respondents were selected randomly of which only 50 respondents agreed to participate in the survey.
4.2 Data Sources: Primary & Secondary Data
This study is a cross sectional empirical research based on survey method. Data required for this study are both primary and secondary. Primary data relating to customers of the banking sector were collected through personal interview with the respondents and secondary data relating to the service quality were collected from the different books, journals, websites and blogs. The researcher had personal discussions with the customers of the banks and they were personally contacted and interviewed to elicit relevant information from the respondents. Interview schedule was constructed for the collection of data. The important attributes that came out from the output were classified into five dimensions. After obtaining feedback from the customers, a interview schedule using SERVQUAL model was developed containing 24 items, each having two sections: one, the expectations of the customers from the organization and the other, the perceptions of the customer's. For understanding the importance and satisfaction of each service quality dimension a five point Likert scale was used (1= Strongly Disagree, 2= Disagree, 3= Neutral, 4= Agree, 5= Strongly Agree).
The overall questionnaire is divided in 4 sections. Section 1 deals with the demographic profile of the respondents. Section 2 & Section 3 focuses on the expectations and perceptions of the respondents about the quality of service delivery measured on a 5 point likert scale. Section 4 has questions pertaining to the relative weights of individual quality dimensions as perceived by the respondents measured on a constant sum scale.
4.3 Variables used for the Study
The following variables are used for collection of data:
The demographic variables in the study include age, sex, educational qualification, marital status,
profession, income.
SERVQUAL Dimensions: Responsiveness, Assurance, Tangibility, Empathy, Reliability. (RATER) as displayed in Table 1.
- DATA ANALYSES METHODOLOGY
The data collected from the survey was subjected to data cleaning in order to identify missing value, sample characteristics and meet the assumptions of normality. After this, the descriptive analysis was used to summarize the respondents’ demography. The following table represents the GAP Score as obtained for different dimensions of service quality. The score is computed by using the formulae (GAP = Perceived Mean – Expected Mean). If Perceived Mean > Expected Mean, GAP score will be positive which means customers are delighted with that dimension of service quality, but if Perceived Mean < Expected Mean, GAP score will be negative which means customers are not at all satisfied with that dimension and care is to be taken by the bank to minimize the GAP by allocating optimized resources. If Perceived Mean = Expected Mean, GAP Score will be 0, which means that the customer gets all the values from the service that he expected to get and they are assumed to be satisfied from the service. Here the researcher used weighted mean scores for each dimension to understand GAP in service quality. The weightage is obtained from the respondents by asking them to allocate the points to each dimension based on a constant sum scale. The statements used to measure the expected and perceived values of each dimensions are given in Table 7.
- EMPIRICS
The demographics of the respondents are presented under the 5 attributes i.e. age, gender, qualification, profession, income level. The following table(s) depicts the respondent’s profile and the type of company they have selected for patronizing. As far as the age is concerned in Table 2, almost 50% of the respondents were between 25-34 years old (50%) followed by the age group of 35- 44 years (26%) . On the other hand, 5 respondents (10%) were 45-54 years of age and 7 respondents (14%) were in the 55-64 years age group. Gender-wise as depicted in Table 3, 56% of the respondents were female and only 44% were male. 50% of the respondents were Graduates followed by 32% higher secondary, Post graduates (12%) and PhD(s) only 6% according to Table 4. According to the level of income in Table 5, 34% of the respondents falls under the income bracket of Rs 1 lakh – 3 lakhs, 28% of the total respondents falls under the income group of Rs. 3 lakhs – 6 lakhs whereas only 20% are under 1 lakh and 18% are greater than Rs. 6 lakhs.
Table 2: Parameter: Age
|
|
|
|
Frequency
|
Percent
|
Valid Percent
|
Cumulative Percent
|
|
Valid
|
25-34
|
25
|
50.0
|
50.0
|
50.0
|
|
35-44
|
13
|
26.0
|
26.0
|
76.0
|
|
45-54
|
5
|
10.0
|
10.0
|
86.0
|
|
55-64
|
7
|
14.0
|
14.0
|
100.0
|
|
Total
|
50
|
100.0
|
100.0
|
|
Source: Survey Data
|
Table 3: Parameter: Gender
|
|
|
Frequency
|
Percent
|
Valid Percent
|
Cumulative Percent
|
|
Valid
|
Male
|
22
|
44.0
|
44.0
|
44.0
|
|
Female
|
28
|
56.0
|
56.0
|
100.0
|
|
Total
|
50
|
100.0
|
100.0
|
|
Source: Survey Data
Table 4: Parameter: Education Qualification
|
|
|
|
Frequency
|
Percent
|
Valid Percent
|
Cumulative Percent
|
|
Valid
|
Higher Secondary
|
16
|
32.0
|
32.0
|
32.0
|
|
Graduate
|
25
|
50.0
|
50.0
|
82.0
|
|
Post Graduate
|
6
|
12.0
|
12.0
|
94.0
|
|
PhD
|
3
|
6.0
|
6.0
|
100.0
|
|
Total
|
50
|
100.0
|
100.0
|
|
Source: Survey Data
Table 5: Parameter: Annual Income
|
|
|
|
Frequency
|
Percent
|
Valid Percent
|
Cumulative Percent
|
|
Valid
|
< 1,00,000
|
10
|
20.0
|
20.0
|
20.0
|
|
1,00,000-3,00,000
|
17
|
34.0
|
34.0
|
54.0
|
|
3,00,000-6,00,000
|
14
|
28.0
|
28.0
|
82.0
|
|
>6,00,000
|
9
|
18.0
|
18.0
|
100.0
|
|
Total
|
50
|
100.0
|
100.0
|
|
Source: Survey Data
|
Table 6: Reliability Statistics
(Service Expectation)
|
|
Cronbach's Alpha
|
N of Items
|
|
.914
|
23
|
All the items (service expectation) are reliable thus included in the analysis process with cronbach’s alpha > 0.9 as depicted in Table 6.
|
Table 7: Reliability Statistics
(Service Perception)
|
|
Cronbach's Alpha
|
N of Items
|
|
.881
|
23
|
All the items (service perception) are reliable thus included in the analysis process with cronbach’s alpha > 0.8 as depicted in Table 7
Table 8: SERVQUAL Statements applicable to Banking sector
|
DIMENSIONS
|
STATEMENTS
|
|
Tangibility
|
1. Bank’s staffs look professional
2. The ambience of the bank is highly satisfying.
3. The environment of the bank is convenient.
4. Effective information is available through product and service Brochure.
5. Bank is having memorable advertisement.
|
|
Reliability
|
1. Staff provides error free service
2. Staffs are always there to fulfill promises on time.
3. Banking professionals perform the service right in first.
4. Customer can dependent fully on employees
5. My Bank provides warrantee of the service performance.
|
|
Responsiveness
|
1. Employees of the bank provide prompt service to their customer.
2. Employees gives their customer first service turnaround.
3. Employees in a position to inform the customer about the time it will take to completion of the service.
4. Quick response to any service failure.
|
|
Assurance
|
1. Employees are trustworthy and honest
2. Employees of the bank having knowledge and competence to solve customer problems.
3. Employees of the bank give correct information when the services will be performed.
4. You feel safe in your transactions with the bank.
5. Employees in the bank are always willing to help you.
6. Employees in the bank are never too busy to respond to your request.
|
|
Empathy
|
1. The employees goes out of the way for you.
2. Employees on the bank are consistently courteous with you.
3. The employees of the bank understand your specific needs.
|
Table 9: Average GAP score of each dimension
|
Dimension
|
Statement
|
Expectation Score
|
Perception Score
|
Gap Score
|
t -value
|
Sig.
|
Average for Dimension
|
|
Tangibles
|
1
|
4.4574
|
3.5
|
-0.9574
|
-4.175
|
.000*
|
|
|
|
2
|
4.4680
|
3.3085
|
-1.1595
|
-5.444
|
.000*
|
|
|
|
3
|
5.4148
|
4.6489
|
-0.7659
|
-3.961
|
.000*
|
|
|
|
4
|
4.3297
|
3.5531
|
-0.7766
|
-3.068
|
.003*
|
|
|
|
5
|
4.6063
|
3.6063
|
-1.000
|
-4.518
|
.000*
|
|
|
|
TOTAL
|
23.2762
|
18.6168
|
-4.6594
|
|
|
-0.93188
|
|
|
|
|
|
|
|
|
|
|
Reliability
|
6
|
4.2765
|
3.8191
|
-.4574
|
-2.263
|
.026*
|
|
|
|
7
|
5.3404
|
4.1914
|
-1.149
|
-5.585
|
.000*
|
|
|
|
8
|
5.7446
|
4.3191
|
-1.4255
|
-7.155
|
.000*
|
|
|
|
9
|
5.2765
|
4.2978
|
-0.9787
|
-4.476
|
.000*
|
|
|
|
11
|
4.5106
|
3.5212
|
-0.9894
|
-4.435
|
.000*
|
|
|
|
TOTAL
|
25.1486
|
20.1486
|
-5.000
|
|
|
-1.000
|
|
|
|
|
|
|
|
|
|
|
Responsiveness
|
12
|
5.0319
|
4.3510
|
-0.6809
|
-3.135
|
.000*
|
|
|
|
13
|
5.4680
|
5.1914
|
-0.2766
|
-1.261
|
.211
|
|
|
|
14
|
5.2340
|
4.4574
|
-0.7766
|
-3.492
|
.001*
|
|
|
|
15
|
5.1595
|
4.6382
|
-0.5213
|
-2.325
|
.022*
|
|
|
|
TOTAL
|
20.8934
|
18.638
|
-2.2554
|
|
|
-0.56385
|
|
|
|
|
|
|
|
|
|
|
Assurance
|
16
|
5.7872
|
4.8723
|
-0.9149
|
-3.690
|
.000*
|
|
|
|
17
|
4.6914
|
3.9468
|
-0.7446
|
-3.799
|
.000*
|
|
|
|
18
|
5.6914
|
4.9893
|
-0.7021
|
-3.343
|
.001*
|
|
|
|
19
|
3.2872
|
3.3510
|
0.0638
|
1.136
|
.259
|
|
|
|
20
|
5.2659
|
4.4148
|
-0.8511
|
-3.222
|
.002*
|
|
|
|
21
|
4.6063
|
3.5851
|
-1.0212
|
-4.405
|
.000*
|
|
|
|
TOTAL
|
29.3294
|
25.1593
|
-4.1701
|
|
|
-0.69502
|
|
|
|
|
|
|
|
|
|
|
Empathy
|
10
|
4.4361
|
3.9361
|
-0.5
|
-2.369
|
.020*
|
|
|
|
22
|
4.3617
|
3.7765
|
-0.5852
|
-2.726
|
.008*
|
|
|
|
23
|
4.7978
|
4.1382
|
-0.6595
|
-2.897
|
.005*
|
|
|
|
TOTAL
|
13.5956
|
11.8508
|
-1.7447
|
|
|
-0.58157
|
|
|
|
|
|
|
|
|
|
|
Unweighted Average SERVQUAL score:
|
|
|
-0.75446
|
*significant at 5% level
Table 10: Perceived Weightage of different dimensions of Service Quality
|
Features
|
Points
|
|
1. The appearance of the banks facilities, equipment, personnel and communication materials.
|
22.2
|
|
2. The bank’s ability to perform the promised service dependably and accurately
|
24
|
|
3. The bank’s willingness to help customers and provide prompt service.
|
21
|
|
4. The knowledge and courtesy of the bank’s employees and their ability to convey trust and confidence.
|
25
|
|
5. The caring individual attention the bank provide to its customers.
|
7.8
|
|
Total:
|
100
|
Table 11: Weighted GAP Score
|
SERVQUAL Dimension
|
Score from Table 7
|
Weightage from Table 8
|
Weighted Score
|
|
Tangibility
|
-0.93188
|
22.2
|
-20.6877
|
|
Reliability
|
-1.000
|
24
|
-24.000
|
|
Responsiveness
|
-0.56385
|
21
|
-11.8409
|
|
Assurance
|
-0.69502
|
25
|
-17.3754
|
|
Empathy
|
-0.58157
|
7.8
|
--4.53622
|
|
Total Weighted GAP Score
|
-69.3678
|
- CONCLUSION & INTERPRETATION
All the different dimensions of service quality based on which the overall service quality is measured and interpreted is displayed in Table 8.
From the Table 9, it is found that the maximum unweighted negative GAP score occurred for Reliability, Tangibility and Assurance dimensions followed by Empathy and Responsiveness. Independent sample t-test is being performed and it is evident that the gaps recorded in all dimensions are statistically significant. Reliability dimension displays maximum negative (-1.000) score which means that the bank needs to have more skilled manpower and an active HR base that will constantly monitor the performance of the staffs and provide them proper training. Problem also lies with other dimensions especially with tangibility and assurance. The weighted GAP score also shows that the maximum negative gap occurs for Reliability dimension which has relatively high weightage of 24% (Table 10). This implies that the staff needs to be proactive in their approach and a quick and effective error free service delivery is somewhat required to minimize the GAP.
Other important dimensions with large negative scores are Assurance & Tangibility (Table 9). The employees need to focus individual customers and customize services accordingly as much as possible. They have to increase courtesy and warmth in their behavior towards the customers. They have to be more transparent in their approach, promote themselves through different media more frequently even counsel customers to reduce their anxiety and dissonance.
The overall weighted GAP Score is highly negative (-69.3678), as depicted in Table 11. Thus there are ample scopes of improvement in all the dimensions of service quality.
- RECOMMENDATIONS
It is quite evident that if the banking sector focus on the quality, their business can further be enhanced because in the present age of competition and clutter, customers judge an organization not only by the number of products offered by it but by the quality of the products and services. Also, there should be transparency and well documentation in the functioning of the banks. Consistency in meeting the customer expectation is a must. Bank should provide suitable infrastructure for error free services. Service personnel should be prompt enough in attending the customers and serving their requirements. Employees should be empowered by the management to do all that they can to assist a customer in trouble. They should empathize with customers who report problems and work quickly to resolve them. Employees working with commitment and customer orientation should be rewarded to encourage similar behavior among all the employees.
- LIMITATIONS
The data for the study was collected from Kolkata only. However, a more extended geographical sample may produce different results. Due to time constraints the sample of respondents was just 50, further study can be conducted by taking larger sample. Further comparative study of private and public sector banks can be conducted to find out the gap of expected and actual satisfaction level of customers.
REFERENCES
- Alam M, Khokhar R (2006). "Impact of Internet on Customer Loyalty in Swedish Banks". J. Econ. Psychol., 16: 311-29.
- Barsky, J. (1994), World -Class Customer Satisfaction, IL: Irwin Professional Publishing, Burr Ridge.
- Chowdhury, T. A., Rahman, M. I., & Afza, S. R. (2007). Perceptions of the Customers towards Insurance companies in Bangladesh-A Study based on the SERVQUAL model. BRAC University Journal, 4(2), 55-66.
- Gremler, D. D., & Brown, S. W. (1996). Service loyalty: Its nature, importance, and implications. Advancing Service Quality: A global perspective, 171-180.
- Jacoby J, Chestnut RW. In: Webster FE, editor. Brand Loyalty: Measure-ment and Management. New York: Wiley, 1978.
- Morgan, and Hunt, S. (1994). “The commitment-trust theory of relationship marketing”. Journal of Marketing. Vol. 58. No 3, pp. 20-38.
- Parasuraman, A., Zeithaml V. A., Berry L. L. (1985). A conceptual model of services quality and its implication for future research, Journal of Marketing, 49(4), 41-50.
- Parasuraman, A., Zeithaml, V. A., & Berry, L. L. (1988). Servqual:A Multiple-item Scale for Measuring Consumer Perception of Service Quality . Journal of Retailing, 64(1), 12-40.
- Tranberg, H. & Hansen, F. (1986). Patterns of brand loyalty: Their determinants and their role for leading brands. European Journal of marketing, 20(3): 81-109.
- van der Wal, R.W.E., Pampallis, A. and Bond, C. (2002), “Service quality in a cellular telecommunications company: a South African experience”, Managing Service Quality, Vol. 12 No. 5, pp. 233-6.
- Veloutsou, C.; Daskou, S. and Daskou, A. (2004). “Are the determinants of bank loyalty brand specific?”. Journal of Financial Services Marketing, vol. 9, n. 2, pp. 113-125.
- Wang, Y., Hing-Po, L. and Yang, Y. (2004), “An integrated framework for service quality, customer value and satisfaction: evidence from China’s telecommunication industry”, Information Systems Frontiers, Vol. 6 No. 4, pp. 325-40.

