A Refereed Monthly International Journal of Management
Evaluating the Performance of HDFC & ICICI: A Study of Portfolio Management with Capital and Earning Parameter
Ms. Ritu Priya
Assistant Professor in Commerce
Guru Nanak Khalsa College for Women, Ludhiana.
Abstract
Portfolio management is the combination of three basic cannons viz. profitability, liquidity and solvency. Lending is main function of every commercial bank. Banks should manage their lending in such a way that it confirms to the principle of portfolio management. Here profitability refers to the earning capacity of banks, liquidity refers to the ability of banks to meet out some emergency requirements and solvency refers to the bank’s ability to continue operations in future. In present paper two leading private sector banks have been selected viz. HDFC and ICICI. Study is based on the secondary data drawn from the annual reports of respective banks. Data of five years i.e. from 2011-12 to 2015-16 are analyzed by calculating 6 ratios related to portfolio management. Statistical tool “two tailed t-test” has been used for evaluating the financial performance of these two banks. Data is analyzed manually without using any software. And results show that financial performance of both the banks is good.
Keywords: HDFC, ICICI, Financial Performance, Portfolio Management.
Introduction
Banking sector is playing a significant role in the development of economy. Every country is known from its strong banking system. Banks inculcate the habit of saving among the people; provide finance as per the requirement of general public, business enterprises and even to the government. Indian banking system is very strong with the mixture of public, private and foreign sector banks. HDFC and ICICI are top two banks according to the latest reports. HDFC (Housing Development Finance Corporation) was incorporated in August 1994. It was the first bank which got approval from RBI to set up its functioning in India as a private bank. This bank holds number one position among private sector banks. ICICI (Industrial Credit and Investment Corporation of India) bank was also promoted in the year 1994 by ICICI limited, an Indian financial institution, and was its wholly owned subsidiary. It holds second position.
Portfolio Management
Portfolio management is the combination of three basic cannons viz. profitability, liquidity and solvency. Lending is main function of every commercial bank. Banks should manage their lending in such a way that it confirms to the principle of portfolio management. Here profitability refers to the earning capacity of banks, liquidity refers to the ability of banks to meet out some emergency requirements and solvency refers to the bank’s ability to continue operations in future. Fulfillment of one principle will lead to the sacrifice of another. Banks have mainly two types of advances viz. long term and short term. In long term advances, there will be more profitability but less liquidity and solvency because funds will be recovered in future therefore it involves risk and because of high risk banks can charge more interest. On the other hand in case of short term advances situation is reverse. Here less risk is there and it ensure liquidity because bank can recover its loan in lesser period but it has to sacrifice its profit because of lower rate of interest. We can explain it in a better way with the help of following equation.
- Long term advances: Profitability ↑ Liquidity ↓ Solvency ↓
- Short term advances: Profitability ↓ Liquidity ↑ Solvency ↑
In order to elaborate the study, we have selected six ratios related to the principles and these ratios can be explained as follows.
|
Principles
|
Meaning
|
Ratios
|
Interpretation of Ratios
|
|
Profitability
|
Profitability refers to the earning capacity of banks. Main source of earning is interest. Profitability will be higher in long term advances and lower in short term advances.
|
(1). Return on Assets
(2). Return on Equity
|
Profit after tax
Total Assets
Profit after tax _____
Equity share capital + Employee’s stock option outstanding + Reserves and surpluses
|
|
Liquidity
|
Liquidity refers to the ability of banks to meet out some emergency requirements such as withdrawals. Liquidity will be higher in short term advances and lower in long term advances.
|
(3). Cash and Cash Equivalents to Total Deposits
(4). Total Investment to Total Deposits
|
Cash and Balances with RBI + Balances with Banks and Money at Call and Short Notice / Total Deposits
Total Investments
Total Deposits
|
|
Solvency
|
Solvency refers to the bank’s ability to continue operations in future. Solvency will be higher in short term advances and lower in long term advances. Its position is same as liquidity.
|
(5). Capital Adequacy Ratio
(6) Net Non Performing Assets to Net Advances.
|
According to BASEL Norms
Net NPA (Total NPA-Provision) / Net Advances (total loans - provisions)
|
Literature Review
Dr. Srinivas K. and Saroja L. (2013) conducted a study to compare the financial performance of HDFC Bank and ICICI Bank. From the study it is clear that there is no significance difference between the ICICI and HDFC bank’s financial performance but we conclude that the ICICI bank performance is slightly less compared with HDFC.
Biswas Mahua (2014) studied the financial performance of Andhra Bank & Bank of Maharashtra. Andhra Bank dominated in Management Efficiency and Earning Quality. However on Assets Quality & Liquidity Bank of Maharashtra dominated over Andhra Bank. Both the banks were on par with respect to the Cash Adequacy Ratio. Overall both the banks were found to be performing on par with each other.
Karri Hari Krishna, Meghani Kishore and Mishra Bharti Meghani (2015) studied that two banks viz., Bank of Baroda and Punjab National Bank have succeeded in maintaining CRAR at a higher level than the prescribed level 10%. But the Bank of Baroda has maintained highest across the duration of last five years. It is very good sign for the banks to survive and to expand in future. Out of 14 ratios used, the average figures of Bank of Baroda is the best for (6 ratios) followed by Punjab National Bank (5 ratios). Thus it is established that Bank of Baroda is the best bank in the selected public sector banks.
Rostami Malihe (2015) studied the performance of Iranian Bank. Q-Tobin’s ratio is put as performance indicator and concluded that bank can focus on risk and some important ratios and try to manage and control some possible crisis.
Ahsan Mohammad Kamrul (2016) studied the performance of selected Islamic Banks in Bangladesh and found that all the selected Islamic banks are in strong position on their composite rating system. They are sound in every respect i.e., capital adequacy, asset quality, management, earning capacity and liquidity condition.
Objectives of the study
The main objectives of the study are
- To analyze and compare the financial position and performance of HDFC and ICICI.
- To describe the Portfolio Management of Banking with the help of ratios.
- To interpret the statistical results drawn out from the research and evaluate the usefulness of Portfolio Management in doing so.
- To suggest measure on the basis of the study results, to improve further financial performance of the banks under study.
Research Methodology
In order to conduct the research, data has been taken from the annual reports of HDFC and ICICI (from the websites of the respective banks). Time period of five financial years have been covered i.e. from 2011-12 to 2015-16. Six ratios have been taken into consideration viz. Return on Assets, Return on Equity, Cash and Cash Equivalents to Total Deposits, Investment to Total Deposits, Capital Adequacy Ratio and Net Non Performing Assets to Net Advances. Statistical tool t-test (two-tailed-test with α 0.05) has been used, in order to evaluate the results. Data is analyzed manually without using any software.
Hypothesis
For the hypothesis testing, T-test is applicable. Various ratios are tested under the following hypothesis.
(1). Return on Asset Ratio
Null Hypothesis (Ho): There is no significant difference among Return on Asset ratio of HDFC and ICICI.
Alternative Hypothesis (Ha): There is significant difference among Return on Asset ratio of HDFC and ICICI.
(2). Return on Equity Ratio
Null Hypothesis (Ho): There is no significant difference among Return on Equity ratio of HDFC and ICICI.
Alternative Hypothesis (Ha): There is significant difference among Return on Equity ratio of HDFC and ICICI.
(3). Cash and Cash Equivalents to Total Deposits Ratio
Null Hypothesis (Ho): There is no significant difference among Cash and Cash Equivalents to Total Deposits ratio of HDFC and ICICI.
Alternative Hypothesis (Ha): There is significant difference among Cash and Cash Equivalents to Total Deposits ratio of HDFC and ICICI.
(4). Total Investment to Total Deposits Ratio
Null Hypothesis (Ho): There is no significant difference among Total Investment to Total Deposits Ratio of HDFC and ICICI.
Alternative Hypothesis (Ha): There is significant difference among Total Investment to Total Deposits Ratio of HDFC and ICICI.
(5). Capital Adequacy Ratio
Null Hypothesis (Ho): There is no significant difference among Capital Adequacy Ratio of HDFC and ICICI.
Alternative Hypothesis (Ha): There is significant difference among Capital Adequacy Ratio of HDFC and ICICI.
(6) Net Non Performing Assets to Net Advances Ratio
Null Hypothesis (Ho): There is no significant difference among Net Non Performing Assets to Net Advances Ratio of HDFC and ICICI.
Alternative Hypothesis (Ha): There is significant difference among Net Non Performing Assets to Net Advances Ratio of HDFC and ICICI.
Analysis and Interpretation
In this section we will analyze the different ratios according to Portfolio Management and interpret our results.
(1). Return on Asset Ratio: Earning quality mainly measures the profitability and productivity of the bank, explain the growth and sustainability of future earning capacity. It can be measured as the return on asset ratio. Higher the ratio, better it is.
Table 1. Showing Return on Asset Ratio of HDFC Bank and ICICI Bank
|
Banks
|
2011-12
|
2012-13
|
2013-14
|
2014-15
|
2015-16
|
|
HDFC Bank (in percent)
|
1.55
|
1.69
|
1.74
|
1.76
|
1.76
|
|
ICICI Bank (in percent)
|
1.31
|
1.50
|
1.56
|
1.57
|
1.19
|
Source: Annual Reports of HDFC Bank and ICICI Bank from their websites
|
Banks
|
Ratio
|
Mean
|
Standard Deviation
|
Standard
Error
|
T-Test Value
|
Table Value
|
P-Value
|
Accept and Reject Criteria
|
|
HDFC Bank
|
Return on Asset
|
1.7
|
0.0886
|
0.0443
|
3.22
|
2.306
|
0.0122
|
3.22 > 2.306
Hypothesis Rejected
0.0122 ≤ 0.05
Result is significant
|
|
ICICI Bank
|
1.426
|
0.1683
|
0.08416
|
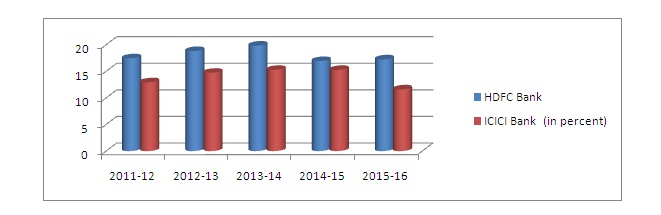
Findings: As we know that higher the ratio better it is. Here position of HDFC Bank is better as compare to ICICI Bank in all years. As far as hypothesis is concerned than result reveals that 3.22 > 2.306 (t-test value is greater than table value and in two tailed test if t-test value is greater than 2.306 or less than -2.306 then hypothesis is rejected) and 0.0122 ≤ 0.05 (p-value is less than value of α), so result is significant and hypothesis is rejected.
Diagram 1. Showing trend in Return on Asset Ratio of HDFC Bank and ICICI Bank

(2). Return on Equity Ratio: Return on equity or Return on Capital is the ratio of net income of a bank during a year to its shareholders' equity. It is a measure of profitability of shareholders' investments. Higher the ratio, better it is.
Table 2. Showing Return on Equity Ratio of HDFC Bank and ICICI Bank
|
Banks
|
2011-12
|
2012-13
|
2013-14
|
2014-15
|
2015-16
|
|
HDFC Bank (in percent)
|
17.46
|
18.83
|
19.84
|
16.94
|
17.25
|
|
ICICI Bank (in percent)
|
12.95
|
14.73
|
15.28
|
15.28
|
11.61
|
Source: Annual Reports of HDFC Bank and ICICI Bank from their websites
|
Banks
|
Ratio
|
Mean
|
Standard Deviation
|
Standard
Error
|
T-Test Value
|
Table Value
|
P-Value
|
Accept and Reject Criteria
|
|
HDFC Bank
|
Return on Equity
|
18.06
|
1.2279
|
0.61398
|
4.49
|
2.306
|
0.0020
|
4.49 > 2.306
Hypothesis Rejected
0.0020 ≤ 0.05
Result is significant
|
|
ICICI Bank
|
13.97
|
1.6294
|
0.81470
|
Findings: As we know that higher the ratio better it is. Here again position of HDFC Bank is better as compare to ICICI Bank in all years. As far as hypothesis is concerned than result reveals that 4.49 > 2.306 (t-test value is greater than table value and in two tailed test if t-test value is greater than 2.306 or less than -2.306 then hypothesis is rejected) and 0.0020 ≤ 0.05 (p-value is less than value of α), so result is significant and hypothesis is rejected.
Diagram 2. Showing trend in Return on Equity Ratio of HDFC Bank and ICICI Bank
(3). Cash and Cash Equivalents to Total Deposits Ratio: Cash and cash equivalents are the most liquid current assets found on a bank's balance sheet. Cash equivalents are short-term commitments easily convertible into a known cash amount. Higher the Ratio, better it is.
Table 3. Showing Cash and Cash Equivalents to Total Deposits Ratio of Banks
|
Banks
|
2011-12
|
2012-13
|
2013-14
|
2014-15
|
2015-16
|
|
HDFC Bank (in percent)
|
8.59
|
9.30
|
10.87
|
8.11
|
7.16
|
|
ICICI Bank (in percent)
|
14.60
|
15.68
|
13.42
|
12.34
|
14.42
|
Source: Annual Reports of HDFC Bank and ICICI Bank from their websites
|
Banks
|
Ratio
|
Mean
|
Standard Deviation
|
Standard
Error
|
T-Test Value
|
Table Value
|
P-Value
|
Accept and Reject Criteria
|
|
HDFC Bank
|
Cash and Cash Equivalents to Total Deposits Ratio
|
8.806
|
1.3914
|
0.69572
|
-6.28
|
2.306
|
0.00024
|
-6.28 < -2.306
Hypothesis Rejected
0.00024 ≤ 0.05
Result is significant
|
|
ICICI Bank
|
14.09
|
1.2657
|
0.63287
|
Findings: As we know that higher the ratio better it is. Here position is reverse, ICICI Bank is better as compare to HDFC Bank in all years. As far as hypothesis is concerned than result reveals that -6.28 < - 2.306 (t-test value is greater than table value and in two tailed test if t-test value is greater than 2.306 or less than -2.306 then hypothesis is rejected) and 0.00024 ≤ 0.05 (p-value is less than value of α), so result is significant and hypothesis is rejected.
Diagram 3. Showing trend in Cash and Cash Equivalents to Total Deposits Ratio
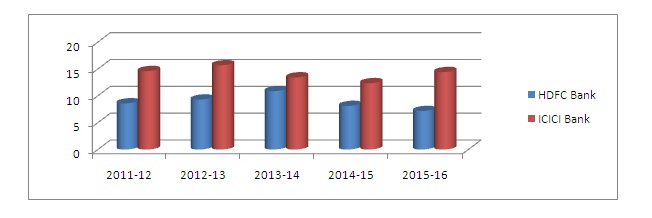
(4). Total Investment to Total Deposits Ratio: Total Investment includes all the investments that are done by the bank in the financial year which includes all the long term and short term investments. Long term investment also ensures liquidity in future. Higher the ratio, better it is.
Table 4. Showing Total Investment to Total Deposits Ratio of HDFC Bank and ICICI Bank
|
Banks
|
2011-12
|
2012-13
|
2013-14
|
2014-15
|
2015-16
|
|
HDFC Bank (in percent)
|
39.26
|
37.48
|
32.57
|
33.19
|
29.62
|
|
ICICI Bank (in percent)
|
85.07
|
81.22
|
74.44
|
71.07
|
63.41
|
Source: Annual Reports of HDFC Bank and ICICI Bank from their websites
|
Banks
|
Ratio
|
Mean
|
Standard Deviation
|
Standard
Error
|
T-Test Value
|
Table Value
|
P-Value
|
Accept and Reject Criteria
|
|
HDFC Bank
|
Total Investment to Total Deposits
|
34.42
|
3.8976
|
1.9488
|
-9.69
|
2.306
|
0.0000
|
-9.69 < -2.306
Hypothesis Rejected
0.0000 ≤ 0.05
Result is significant
|
|
ICICI Bank
|
75.04
|
8.5172
|
4.2586
|
Findings: As we know that higher the ratio better it is. Here again, ICICI Bank is better as compare to HDFC Bank in all years. As far as hypothesis is concerned than result reveals that -9.69 < - 2.306 (t-test value is greater than table value and in two tailed test if t-test value is greater than 2.306 or less than -2.306 then hypothesis is rejected) and 0.0000 ≤ 0.05 (p-value is less than value of α), so result is significant and hypothesis is rejected.
Diagram 4. Showing trend in Total Investment to Total Deposits Ratio
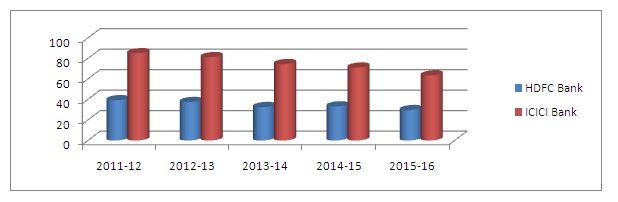
(5). Capital Adequacy Ratio: Capital adequacy reflects solvency position of the bank. Capital adequacy indicates whether the bank has enough capital to absorb unexpected losses. It also shows the ability of the management to meet the need for the additional capital. We are using capital adequacy ratio as per the BASEL Norms. It has to be noted here that data has been collected from the annual reports of respective banks and capital adequacy ratio is as per BASEL norms II for the year 2011-12 and 2012-13 and for the years 2013-14, 2014-15 and 2015-16, it is according to BASEL norms III as indicated in annual reports of banks. Higher the ratio, better it is.
Table 5. Showing Capital Adequacy Ratio of HDFC Bank and ICICI Bank
|
Banks
|
2011-12
|
2012-13
|
2013-14
|
2014-15
|
2015-16
|
|
HDFC Bank (in percent)
|
16.5
|
16.8
|
16.1
|
16.8
|
15.5
|
|
ICICI Bank (in percent)
|
18.5
|
18.7
|
17.7
|
17
|
16.6
|
Source: Annual Reports of HDFC Bank and ICICI Bank from their websites
|
Banks
|
Ratio
|
Mean
|
Standard Deviation
|
Standard
Error
|
T-Test Value
|
Table Value
|
P-Value
|
Accept and Reject Criteria
|
|
HDFC Bank
|
Capital Adequacy Ratio
|
16.34
|
0.55045
|
0.27523
|
-2.85
|
2.306
|
0.0215
|
-2.85 < -2.306
Hypothesis Rejected
0.0215 ≤ 0.05
Result is significant
|
|
ICICI Bank
|
17.7
|
0.91378
|
0.45689
|
Findings: As we know that higher the ratio better it is. This ratio is the best indicator of financial position of any bank. Here again, ICICI Bank is better as compare to HDFC Bank in all years. As far as hypothesis is concerned than result reveals that -2.85 < - 2.306 (t-test value is greater than table value and in two tailed test if t-test value is greater than 2.306 or less than -2.306 then hypothesis is rejected) and 0.0215 ≤ 0.05 (p-value is less than value of α), so result is significant and hypothesis is rejected.
Diagram 5. Showing trend in Capital Adequacy Ratio of HDFC Bank and ICICI Bank
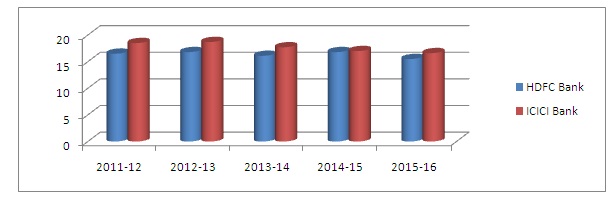
(6). Net Non Performing Assets to Net Advances Ratio: It is measured by ratio of Net NPAs to Net advances. It indicates the quality of credit decisions made by bankers. Higher ratio is the indicator of poor credit decision-making.
Table 6. Showing Net Non Performing Assets to Net Advances Ratio of Banks
|
Banks
|
2011-12
|
2012-13
|
2013-14
|
2014-15
|
2015-16
|
|
HDFC Bank (in percent)
|
0.18
|
0.20
|
0.27
|
0.25
|
0.28
|
|
ICICI Bank (in percent)
|
0.62
|
0.64
|
0.82
|
1.40
|
2.67
|
Source: Annual Reports of HDFC Bank and ICICI Bank from their websites
|
Banks
|
Ratio
|
Mean
|
Standard Deviation
|
Standard
Error
|
T-Test Value
|
Table Value
|
P-Value
|
Accept and Reject Criteria
|
|
HDFC Bank
|
Net Non Performing Assets to Net Advances Ratio
|
0.236
|
0.04393
|
0.02197
|
-2.57
|
2.306
|
0.0333
|
-2.57 < -2.306
Hypothesis Rejected
0.0333 ≤ 0.05
Result is significant
|
|
ICICI Bank
|
1.23
|
0.8647
|
0.4323
|
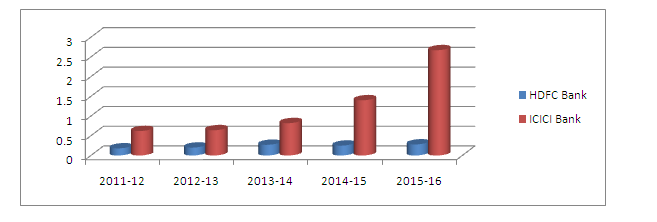
Findings: As we know that lesser the ratio better it is. Here position of HDFC Bank is better in all years because it has less NPAs as compare to ICICI Bank. As far as hypothesis is concerned than result reveals that -2.57 < - 2.306 (t-test value is greater than table value and in two tailed test if t-test value is greater than 2.306 or less than -2.306 then hypothesis is rejected) and 0.0333 ≤ 0.05 (p-value is less than value of α), so result is significant and hypothesis is rejected.
Diagram 6. Showing trend in Net Non Performing Assets to Net Advances Ratio of Banks
Summary of Findings
Above stated data is showing that overall performance of both the banks is equal. Performance of HDFC Bank is best in three ratios viz. Return on Assets, Return on Equity and Net NPAs to net advances. And position of ICICI Bank is also good in three ratios viz. Cash and Cash Equivalent to Total Deposits ratio, Total Investment to Total Deposits ratio and Capital Adequacy ratio. This shows that profitability position is better of HDFC Banks and liquidity position is better of ICICI Bank. As far as solvency is concerned then ICICI Bank is leading in Capital Adequacy ratio and HDFC Bank stands better in Net NPAs to Net Advances Ratio. And as far hypothesis are concerned we have following summarized findings:
|
Ratios
|
Significance level
|
Results
|
|
Return on Asset Ratio
|
There is significant difference among Return on asset ratio of HDFC Bank and ICICI Bank.
|
Hypothesis has been Rejected.
|
|
Return on Equity Ratio
|
There is significant difference among Return on equity ratio of HDFC Bank and ICICI Bank.
|
Hypothesis has been Rejected.
|
|
Cash and Cash Equivalent to Total Deposits Ratio
|
There is significant difference among Cash and Cash Equivalent to Total Deposits Ratio of HDFC Bank and ICICI Bank.
|
Hypothesis has been Rejected.
|
|
Total Investment to Total Deposits Ratio
|
There is significant difference among Total Investment to Total Deposits Ratio of HDFC Bank and ICICI Bank.
|
Hypothesis has been Rejected.
|
|
Capital Adequacy Ratio
|
There is significant difference among Capital Adequacy Ratio of HDFC Bank and ICICI Bank.
|
Hypothesis has been Rejected.
|
|
Net NPAs to Net Advances Ratio
|
There is significant difference among Net NPAs to Net Advances Ratio of HDFC Bank and ICICI Bank.
|
Hypothesis has been Rejected.
|
Suggestions
Financial performance of both the banks is almost equal. Profitability position is better of HDFC Bank and liquidity position is better of ICICI Bank. As far as solvency is concerned then ICICI Bank is leading in Capital Adequacy ratio and HDFC Bank stands better in Net NPAs to Net Advances Ratio. Total Investment to Total Deposits Ratio is very high of ICICI Bank. No doubt it shows great liquidity but it should be in controlled manner. NPA ratio is very high of ICICI Bank as compare to HDFC Bank. ICICI Bank should try to control its NPAs. There is need to focus on liquidity position in case of HDFC Bank. And ICICI Bank should focus on its profitability position because the profitability ratios are main indicator of financial strength of any concern.
Concluding Remarks
To uplift the economy of the country, financial sector is required to be developed. In this connection, the banking sector must be given priority to attain sustainability in financial sector. So, the smooth and efficient operation of banking sector helps to reduce the risk of failure of an economy. Therefore, the performance of banking sector has always been a source of interest for researchers to judge the economic condition of the country (Mohammad Kamrul Ahsan). And for this purpose “Portfolio Management” is common phenomenon for all banking system all over the world.
LIMITATIONS OF THE STUDY
The study is based on secondary data collected from the secondary data source viz. internet and websites of banks concerned. Therefore, the quality of the study depends upon the accuracy, reliability, and quality of secondary data source. Total investments include both long term and short term investments as mentioned in annual reports of the banks. Different websites are using this ratio by including long term investments in total investments. So here we are assuming that these investments provide liquidity in future.
References
- Ahsan Mohammad Kamrul (2016) “Measuring financial performance based on CAMEL: A study on selected Islamic banks in Bangladesh” Asian Business Consortium, Volume 6, issue 13, 2016.
- Biswas Mahua (2014) “Performance evaluation of Andhra Bank and Bank of Maharashtra with CAMEL Model” International Journal of Business and Administration Research Review, Vol.1, Issue.5, April-June, 2014
- Karri Hari Krishna, Meghani Kishore and Mishra Bharti Meghani (2015) “A Comparative Study On Financial Performance Of Public Sector Banks In India: An Analysis On Camel Model” Munich Personal RePEc Archive, MPRA Paper No. 62844, posted 17 March 2015 13:21 UTC
- Srinivas, Saroja (2013) “Comparative Financial Performance of HDFC BANK and ICICI BANK” Scholars world-International Refereed Multidisciplinary Journal of Contemporary Research Volume.1, Issue.2, July 2013
- Rostami Malihe (2015) “ Determination of “CAMELS” Model on bank’s performance” International journal of multidisciplinary research and development, Volume 2, Issue 10, October 2015.
- icicibank.com
- hdfcbank.com

