A Refereed Monthly International Journal of Management
Use of Analytical Tools for Measuring Tourist Satisfaction in India: A Critical Review of Scholarly Doctoral Theses
Author
|
Ravi Kumar Pandit
Head of the Department (Engg.)
India Tourism Development Corporation Ltd.
(Govt. of India Undertaking)
Core 8, Scope Complex, Lodhi Road,
New Delhi, India
AMU-AIMA Doctoral Scholar
|
Dr. Mohammed Naved Khan
Associate Professor
Department of Business Administration
Faculty of Management, Studies & Research
Aligarh Muslim University,
Aligarh-(UP), India
|
ABSTRACT:
This article aims to critically review the scholarly doctoral theses on tourist satisfaction studies conducted in major Universities in India. The sample frame for the study were doctoral theses uploaded on SHODHGANGA Portal of University Grants Commission (UGC) of the Govt. of India. The aim is to critically analyse the doctoral works of scholars from different reputed institutions of the country. The works cover tourist satisfaction, perceptions and expectations of tourists towards various service facilities provided at various tourist destinations.
The review involved in-depth and structured examination of fourteen (14) scholarly theses available on UGC-SHODHGANGA database by searching for publications bearing the terms “tourism” and “tourist satisfaction” in the title or keywords. Of the 14 published researches, 9 are related to various tourism studies while 5 are related to tourist satisfaction.
For the past decade, a considerable amount of research has been conducted in tourism and tourist/customer satisfaction. Finding the appropriate analytical tools for such studies and especially for measurement of customer satisfaction can be time-consuming and at times confusing too. This paper attempts to provide a comprehensive overview of the best-known analytical tools, scales and methods for measurement of customer satisfaction in tourism research. Also in this paper, a classification scheme and a review of literature is provided in order to clarify, categorise, and interpret the current research on tourism definitions and applications. It is worth pointing out that studies of this type are non-existent in the context of India. Thus, the present work is expected to serve as a ready reference for researchers and practitioners alike who are active in the area of tourism and also provide directions for future research.
Keywords: Tourism; Literature review; Satisfaction, Shodhganga
INTRODUCTION
Tourism has been one of the most significant subjects among academics and practitioners in the recent past. Globally, Tourism industry has significantly evolved during the last two decades, while the business environment has become highly competitive day by day. Tourism sector has been accepted as one of the most important players of the global industries which aids to accelerate the national economies through the development process and to act as a bridge towards the global harmony. Tourism sector will be highly beneficial to contribute towards eradicating the poverty and, to curtail the unemployment rates. In the recent years, the tourism industry outperformed to prosper the entire economy in a wider aspect, flourishing rapidly than other industries like manufacturing, financial services and retail etc. Tourism industry is proceeding towards achieving the breakthrough to be among one of the world's largest industries with growth rate more than five percent per annum during the last twenty years. Globally, tourism industry has contributed 10% of the global GDP and generates employment for more than 235 million people across the globe which is about 11% of the world employment. It is a significant generator of foreign exchange and is sensitive to world economic and political conditions. Despite the economic crisis that have stuck the world, the number of international tourists have increased many fold in the previous years and touched 1,186 million in the year 2015 from 527 million in 1995(UNWTO, 2016). International tourism receipts reached US$ 1260 billion worldwide in 2015 (UNWTO, 2016). An ever-increasing number of destinations worldwide have opened up to, and invested in tourism, turning it into a key driver of socio-economic progress through the creation of jobs and enterprises, export revenues, and infrastructure development (UNWTO, 2015).
The tourism industry has played an important role in the economy of different countries in the last decades. It is a fast growing industry that has become a top priority of the economic agenda of a number of countries. In many of the Asian countries, a progressive tourism industry is perceived as a prospective solution to pin-point the national issues like lower employment rates, source of generating foreign currencies and, as an outcome of higher government revenues. Many countries have considered tourism as a mean of generating more travellers and tourists and as a result more business and profits in their home countries. Regions and destinations are competing each other for attracting as many tourists as they can.
In developing countries, tourism can be used as a tool to solve problems like unemployment and poverty. The developed countries are engaged in doing marketing for their destinations and they are improving continuously their services and are striving to offer excellent experiences for their guests. Not only the developed countries are strongly oriented towards tourism industry, but also the less developed and the non-developed ones have understood the profits generated from the development of tourism and are putting more efforts in attracting as many tourists as possible.
India is rich in traditions and tourist destinations. Tourism is one of the fastest growing industries in the country which is being given priority to promote the beauty of the nature and its civilization which is rich in traditions and culture. Indian tourism industry has an ample scope of progressive growth. Tourism is India’s 3rd largest export industry after readymade garments, gems and jewellery. It is 3rd largest in the foreign exchange earnings. Tourism contributes to 6.8% of India’s GDP and contributes about 11.5% of the total employment of the country. India’s share of Foreign Tourist Arrivals (FTAs) from the world during 2015 were 0.68% (PIB,2016) though it has tremendous tourism potential for all types of tourists like adventurous tours, cultural exploration, pilgrimages, beautiful beaches, mountains, resorts, deserts, rain forests, valleys etc. Due to its vastness and diversity, it is probably the only country which offers various categories of tourism like historical tourism, heritage tourism, adventure tourism, medical tourism, eco-tourism, cultural tourism, rural tourism, religious pilgrimage tourism, spiritual tourism, beach tourism, heliport tourism, wellness tourism, cruise tourism, caravan tourism, sports tourism, golf tourism, wild life tourism and MICE tourism .Architecturally, India has mausoleums beyond the Taj, temples beyond Khajuraho, palaces beyond Hyderabad and Rajasthan, ancient remains that would stun even those who have been to Italy, Greece, Egypt and Jordan.
According to Press Information Bureau (PIB) of the Government of India, the FTAs in India during 2013, 2014, 2015 and 2016 were 6.97 million, 7.68 million, 8.03 million and 8.99 million respectively. During the month of Dec 2016, India received 10.37lakh Foreign Tourists as compared to 9.13 lakh in the same month of 2015. As per Times of India dated February 22, 2017, India saw 5.3 crore international travellers in 2016 up 10.4% from 4.8 crores recorded in the previous year. There has been no effect of demonetisation announced by Govt of India on Nov 8, 2016 on the international travel as the country witnessed a jump of 10.4% from 1.25 crore to 1.38 crore in international travels during the last quarter of 2016 as compared to the year 2015. The country has also moved up 13 notches to 52ndposition on a global list of countries in terms of their travel and tourism competitiveness (TTCI, 2015).
The discussion section of the present paper has been built from the findings of some research theses conducted in the various Indian Universities on the tourism sector. On this basis, it aims to offer details of various analytical tools used in tourism studies and also an empirical assessment of tourists’ satisfaction in Indian context. It aims to offer some recommendations to practitioners and managers who operate in this industry in order to create and maintain satisfied tourists.
TOURIST SATISFACTION
‘Satisfaction’ is the key to hospitality and tourism industry. Satisfaction is very much relative in nature and it is determined by various subjective and objective factors. There are mainly two schools of approaches to customer satisfaction research which are famous. The American school, led by Parasuraman, Zeithaml, and Berry (1985), who considers satisfaction as a negative or positive outcome resulting from a comparison process between initial expectations and perceived performance of products and services. The Nordic school, led by Gronroos (1990), brings a completely different perspective to measure satisfaction by stating that it is only an outcome of the actual quality of performance and its perception by consumers.
Preference is the positive attitude of a customer towards a particular service, mainly the choice of the customer/tourists for a particular service whereas customer perception is certain beliefs about service that function as standards or reference points against which performance is judged. Customers tend to compare their perceptions of performance with these reference points when evaluating service quality (Zeitaml & Bitner, 2000). Thus, customer preference and perceptions are the first and possibly, most critical step in delivering quality services. Quality services can lead to customer satisfaction, further, satisfied customers can be retained and only retained customers can become loyal to the service providers. During the service delivery process, customers’ overall experience is affected by various potential interactions such as interactions with service personnel, interactions with internal and external physical surroundings and interactions with other customers. On the other hand, consumers make their decisions based upon their perceptions. These decisions may not even be optimal. Thus, it is around these perceptions that marketers must build their competitive strategies.
Tourist satisfaction is the result of the relationship between tourists expectations about the destination based on their previous images of the destination and their evaluation of the outcome of their experience at the destination area (Neal & Gursay, 2008).As suggested by Youn and Uysal (2005), tourists compare their experiences at a travel destination with other alternative destinations or places as they have visited in the past. As a result, tourists are likely to use past experiences at the new destinations to determine whether their new experience was a satisfactory experience or not. The primary determinant of customer satisfaction should be the perceived performance. Assessing customer’s satisfaction with actual performance should indicate whether they are satisfied or not.
Tourism experience takes place in phases such as trip planning, travel to and from the destination, and the destination experiences (Neal & Gursoy, 2008). Different approaches are used to measure customer satisfaction. Measuring the perception of individuals is difficult at best and the issue is most challenging in tourism business. The reasons for measuring customer satisfaction may vary from organization to organization. Naumann (1995), however, believed that the following five objectives are the most common:
(i) Get close to the customer: Understand what attributes are the most important to customers, find which attributes affect the customer’s decision-making, the relative importance of the attributes and get a performance evaluation of how well the firm is delivering each attribute.
(ii) Measure continual improvement: The attributes significant to the customer are linked directly to value-added processes in the firm and are put into a form consistent with the internal measurements used to evaluate the process.
(iii) Achieve customer-driven improvement: Not all customers are an equally valuable source of innovation. This requires a comprehensive database that tracks not only sales but also sources of innovations.
(iv) Measure competitive strengths and weaknesses: Determine customer perceptions of competitive choices. This is achieved by surveying possible and future customers as well as current and past customers.
(v) Link CSM data to internal systems (Naumann, 1995).
TYPES OF MEASUREMENT
Most CSMs use ordinal and discrete rating scales such as Likert-type scales, which typically contain an odd number of options, usually 5 to 7. One end is labelled the “most positive” end, while the other one is labelled the “most negative”, with “neutral” in the middle of the scale. The labels “most positive” and “most negative” could be replaced with “agree” or “disagree”.
For Example:
How satisfied were you with the quality of food served to you?
|
1
|
2
|
3
|
4
|
5
|
|
Highly Dissatisfied
|
Neither Sat.
Nor Dissat.
|
Highly Satisfied
|
|
or alternatively:
The quality of food served to me was excellent
|
|
|
|
1
|
2
|
3
|
4
|
5
|
|
Strongly Disagree
|
Neither Agree nor Disagree
|
Strongly Agree
|
However, Likert-type scales might introduce an acquiescence bias, where respondents have a higher tendency to give a positive response. One way to negate this problem is to introduce items in negations, where agreement implies disagreement with the construct. Acquiescence bias might be reduced by reversing items; however, that might introduce other errors, as people may respond differently to solely deleteriously worded items. Friborg et al. (2006) found by using inferential, reliability statistics and structural equations that the semantic format fits measurement modes, model fit and uni-dimensionality better than a Likert-type scale.
The semantic differential (SD) scale was originally created by Osgood (1964). The SD measures people’s reactions to stimulus words and concepts in terms of ratings on bipolar scales defined with contrasting adjectives at each end.
An example of an SD scale for the “quality of food in a restaurant” would be: The quality of food served to me was:
|
1
|
2
|
3
|
4
|
5
|
6
|
7
|
|
Bad
|
|
|
Neither Good
nor Bad
|
|
Good
|
Similarly, Ding and Ng (2008) adjusted SD scales by using the theory of personal construct and a full grid technique, which includes in-depth interviews. This approach in developing SD scales includes interviewees’ input and removes researcher bias.
Another method for measuring customer satisfaction, needs and requirements was developed by Kano et al. (1984) and is referred to as the Kano model. The Kano model is widely used for understanding customers’ opinions, concerns and/or needs and their impact on customer satisfaction. According to this model, customer needs can be grouped into three categories: basic needs, expected needs and excitement needs. Basic and excitement needs are unspoken, but expected needs are expressed. Basic needs and expected needs are expected, and excitement needs are not. However, meeting customers’ unexpected needs is important (Wang and Ji, 2010), although some unspoken needs are difficult to explain or predict. Kano’s model is valuable in explaining human needs. More specifically, Kano and his colleagues hypothesized that customer requirements could be classified through customer questionnaires where one question consists of two parts:
Q1. How do you feel if a certain attribute is present in the product or service (functional)?
Q2. How do you feel if a certain attribute is not present in the product or service (dysfunctional)?
Responses range from I like it that way (1), it must be that way (2) and I am neutral (3) to I can live with it that way (4) and I dislike it that way (5). Once the responses are collected, they are classified into one of the six categories: A-Attractive; M-Must Be; O-One-dimensional; I-Indifferent; R-Reversal; and Q-Questionable. Then the results are tabulated according to Kano’s table and ranked. As part of the analysis, mode statistics can be applied (Table 1). Some researchers propose a quantitative analysis of Kano’s model to address customer needs by calculating customer satisfaction and customer dissatisfaction points and plotting relationship curves. The Kano model has been successfully used in hospitality research by many authors and a combination of Kano’s model and SERVQUAL was used by Tan and Pawitra (2001) as a tool for evaluating customer satisfaction.
Table: 1
CRs
|
1. Like
|
2. Must-be
|
Dysfunctional
3. Neutral
|
4. Live with
|
5. Dislike
|
|
Functional
|
Q
|
A
|
A
|
A
|
Q
|
|
|
R
|
I
|
I
|
I
|
M
|
|
|
R
|
I
|
I
|
I
|
M
|
|
|
R
|
I
|
I
|
I
|
M
|
|
|
R
|
R
|
R
|
R
|
Q
|
|
Notes: A- Attractive; O- One-dimensional; M -Must-be; I- Indifferent; R- Reverse;
Q -Questionable
Sources: Berger et al. (1993); Kano et al. (1984)
|
- DATA ANALYSIS TOOLS
Following traditional and advanced statistical techniques shall primarily be used to analyse the data in order to make study more meaningful.
- Basic Descriptive statistics including measures of central tendency, weighted arithmetic mean, percentage analysis and co-efficient of variance can be applied wherever required.
- Compound Growth Rates (CGR) can be used to assess the existing trend intourist arrivals and tourist receipts which can be worked out by applying regression model in its exponential form as under :-
Y=abt u.
Log transformation In Y+=Ina+t(Inb)+e
CGR(%) = [antilog (Inb)-1] x 100.
CGR shall test to determine their statistical significance with the help of t-test.
III. Trend equation can be used for making future projections of the tourist arrivals in linear regression form.
Y=a+bt+u
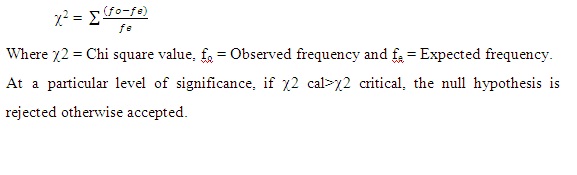
- Chi-square test:
Chi-square is a non-parametric test used for testing the significance of association between two attributes. This is the most widely used statistical tool for use with qualitative variables. If the chi-square is significant at the chosen level then the investigator routinely rejects the null hypotheses of independence and tentatively accepts the alternative hypothesis that the variables are dependent or are related. Chi square is applied to test, the relationship in the genders, age, income, marital status, period or duration of relationship etc. The hypothesis formulated can also be tested with the help of chi-square. It can be used to see the association between two way dissertation of distribution and various characteristics as under:
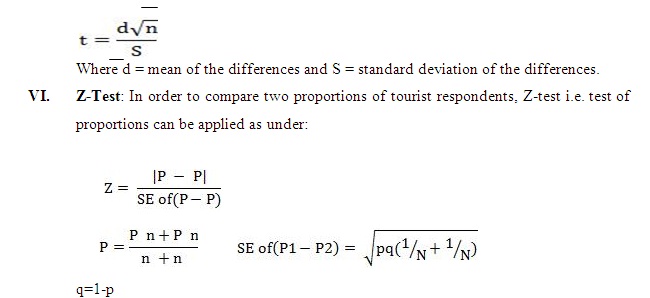
V. Paired t-test:
The paired samples or dependent t-test is used for within-subjects or matched-pairs designs in which observations in the groups are linked. The dependency between the two observations is taken into account and each set of observations serves as its own control. Because of the dependency, the degrees of freedom are based on the number of pairs rather than the number of observations. In order to assess the significance of mean gap (difference between importance and perceptions of tourist satisfaction) within the same group, Paired t-test can be applied. The formula used is as under:
VII. Garratt’s Ranking Technique can be applied to analysis the ranks given bytourists to various services & facilities. It shall be used to find out the most significant factor which influences the tourists, and the outcome of such ranking shall be converted into score value with the help of the following formula:
Percent position = 100 (Rij – 0.5)
Nj
Where
Rij = Rank given for the ith variable by jth respondents
Nj = Number of variable ranked by jth respondents.
With the help of Garrett’s Table, the percent position estimated is converted into scores. Then for each factor, the scores of each individual are added and then total value of scores and mean values of score is calculated. The factors having highest mean value is considered to be the most important factor.
VIII. Karl Pearson’s Co-efficient of correlation is a quantitative measure of the degree of relationship between two variables The coefficient of correlation lie between +1 and -1 .If x and y are two variables, then coefficient of correlation “r” will be;-

It can be applied to analysis the association between sex of tourists and their attitude in recommending a particular tourist site to other tourists.
- Analysis of Variance (ANOVA): Analysis of Variance is used for examining the difference in the mean values of the dependent variable associated with the effect of the controlled independent variables, after taking into account the influence of the uncontrolled independent variables. It is a statistical method for testing whether two or more dependent variable means are equal. The test is based on the assumptions that samples are drawn from normally distributed populations, are randomly drawn and are independent of each other. Also the populations have equal variance. ANOVA is One-way when having only one independent variable with two or more levels and Two-way when having two independent variables each with two or more levels.
- Mann Whitney Testis a Non-Parameters statistical analysis used when the data collected does not possess normality. It can be applied to determine whether there exits any significant difference between the satisfaction level of different categories of tourists.
- Multiple Regression Analysis is the process of developing a statistical model, which is used to predict the value of a dependent variable by at least two or more independent variables. The generalized equation with k independent variables is:
Yi =β0 + β1 X1+ β2 X2+ β3 X3+………………………..+ βkXk+ ε
Where,
Yi = Value of dependent variable for ith value.
β0 = a constant, the value of Y intercept when all X values are zero.
β1 = the slope of the regression surface (the β represents the regression associated with each Xi)
ε = an error, normally distributed about a mean of 0.
The Analysis can help in identifying the key indicators of customer/tourist satisfaction. It can be used to identify the best-fit combination of independent (predictor) variables with the dependent variable i.e. overall satisfaction of the tourists.
XII. Factor analysis: - Factor Analysis is a statistical approach that can be used to analyze interrelationships among a large number of variables and to explain these variables in terms of their common underlying dimensions. It is a method for extracting common factor variance from set of measures. The statistical approach involves finding a way of condensing the information contained in a number of original variables into a smaller set of dimensions (factors) with a minimum loss of information.
Exploratory Factor Analysis: This is the most common form of Factor Analysis. It is basically a form of Multivariate Analysis that is used to reduce the (large) number of variables to a smaller number of components or factors that capture most of the variance in the observed variables. It is frequently used to develop a questionnaire in order to ensure that questions asked relate to the construct intended to be measured. The reliability of EFA also depends on the sample size as correlation co-efficient fluctuate much more in small samples. It is thus important to avoid multi-collinearity and singularity. All variables involved in the factor analysis need to be measured at interval level and are assumed to be normally distributed. The goal of the analysis is to try to identify factors which underlie the variables. There may be fewer factors than variables, but there may not be more factors than variables. EFA seeks to uncover the underlying structure of a relatively large set of variables with an assumption that any indicator may be associated with any factor. Factor loadings are used to intuit the factor structure of the data. There is no theoretical basis for knowing how many factors there are or what they are, much less whether they are correlated. Usually it is assumed that measured variables are indicators of two or more different factors, a measurement model which implies orthogonal (uncorrelated) rotation.
Rotation Analysis reveals the degree to which the tourist scores on the facilities affecting tourist level of satisfaction in relation to the tourism infrastructure components. Each item measures some part of this common aspect of satisfaction, and each item also captures a unique aspect of satisfaction that is not addressed by any other item. Rotation factor analysis aims at extracting factors that account for less and less variance. The variance accounted for by successive factors is summarized in a table and the variances extracted by the factors are called the Eigen values. To make a decision on the factors to be retained, the Kaiser criterion is used, which is probably the most used method. According to this criterion all those factors which have an Eigen Value greater than one can be retained. However, one argument against this criterion is that it retains too many factors. If the model is correct, then it cannot be expected that the factors will extract all variances from the items, rather, only that proportion that is due to the common factors and shared by several items. In the language of factor analysis, this proportion of variance of a particular item, which is due to common factors (shared with other items), is called communalities. The communality measures the percent of variance in a given variable explained by all the factors jointly and may be interpreted as the reliability of the indicator and factor loading are the basis for imputing a label to the different factors. Thus communality is the sum of the squared factor loadings for all factors for a given variable (row) which is the variance in that variable accounted for by all the factors. With this, an additional task when applying this model is to estimate the communalities for each variable and the proportion of variance that is unique to each item is then measured by the respective item’s total variance minus the communality and the goal is to minimize the variance. Orthogonal rotation is considered the best and is achieved by Varimax and Quartimax rotations. Varimax maximizes the sum of squared factor loadings across the columns whereas Quartimax focuses on rows.
Confirmatory Factor Analysis: Confirmatory factor analysis (CFA), on the other hand, is theory-driven wherein planning of the analysis is driven by theoretical relationships among the observed and unobserved variables. Here the factor structure extracted in EFA is confirmed. A hypothesized model is used to estimate a population covariance matrix which is compared with the observed covariance matrix. Thus it seeks to determine if the number of factors and the loadings of the measured (indicator) variables on them confirm to what is expected on the basis of pre-established theory. Indicator variables are selected on the basis of prior theory and factor analysis is used to see if they load as predicted on the expected number of factors. Thus it can be used to verify the conceptualization of a construct of interest. It is absolutely necessary to establish convergent and discriminant validity, as well as reliability, while doing a CFA. Composite Reliability (CR) and Average Variance Extracted (AVE) are a few measures for establishing validity and reliability. CR>0.7 and AVE>0.5.Also CR>AVE. The advantage of CFA is that it allows for testing hypotheses about a particular factor structure. The Confirmatory Factor Analysis (CFA) is a special case of structural equation modeling which is discussed below. All the above tests can be carried out by using SPSS Software.
XIII. Structural Equation Modelling: SEM is an extension of General Linear Model (GLM) which enables to test asset of Regression equations simultaneously. A model based on theory is specified first and then how to measure data is determined. Data is collected and put in the SEM Software package. AMOS is very famous software for SEM. The package fits the data to the specified model and produces the results, which include overall model fit statistics and parameter estimates. The results feature overall indexes of model fit as well as parameter estimates, standard errors, and test statistics for each free parameter in the model. Observed variables are directly measured while latent or unobserved variables are inferred by the relationships or correlations among measured variables in the analysis. This is done in the same way as an exploratory factor analysis infers the presence of latent factors from shared variance among observed variables. Relationships among observed and unobserved variables are represented by using path diagrams where latent variables are represented by oval or circles and measured variables by rectangles or squares. Residuals being unobserved are represented by ovals or circles.
The Structural Equation Modelling can be carried out by using AMOS- a software tool distributed by SPSS Inc. AMOS stands for “Analysis of Moment Structures” and has a unique graphical interface specifically designed to make fitting SEMs easier.
XIV. Kaiser-Meyer-Olkin (KMO) and Bartlett's Test of Sphericity
The Kaiser-Meyer-Olkin (KMO) is a measure of sampling adequacy and provides an index (between 0 and 1) of the proportion of variance among the variables that might be common variance (i.e., that might be indicative of underlying or latent common factors). The SPSS software package suggests that a KMO near 1.0 supports a factor analysis and that anything less than 0.5 is probably not amenable to useful factor analysis. The Bartlett's Test of Sphericity is the test for null hypothesis that the correlation matrix has an identity matrix. Taking this into consideration, these tests provide the minimum standard to proceed for Factor Analysis.
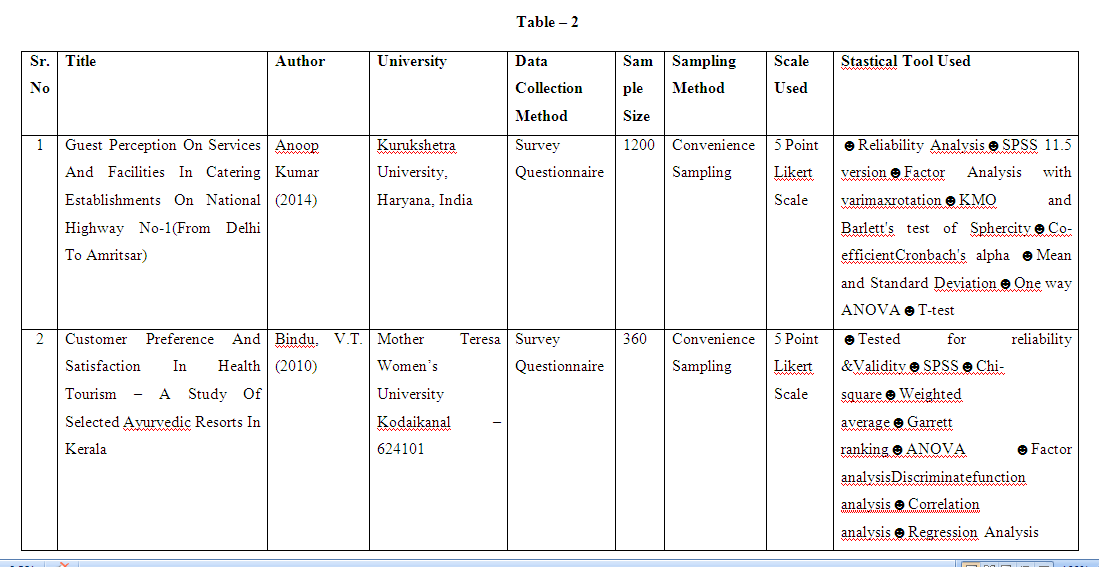
DOCTORAL THESES CRITICALLY REVIEWED
The following 14 scholarly theses submitted to various reputed Indian Universities and available on SHODHGANGA portal of UGC were thoroughly reviewed in terms of objectives, analytical tools employed, sampling methods, sample sizes, scales used etc.