A Refereed Monthly International Journal of Management
Earning Potential of Straddle and Strangle- Derivatives Strategies
AUTHOR
CA. Anshul Kothari CFPCM
Guest Faculty and Research Scholar
Faculty of Management Studies, Mohan Lal Sukhadia University
Udaipur
Earning potential of Straddle and Strangle– Derivatives Strategies
In recent years, there has been a rising interest in option strategies in the Indian Derivatives Market. This paper has analysed the profit potential of two derivatives options strategies namely, Straddle and Strangle in the context of Indian Derivatives Market. The analysis has been done using actual historical data of National Stock Exchange’s primary index, CNX Nifty 50 for a period of 5 years. 4 different strategies, Long Straddle, Short Straddle, Long Strangle and Short Strangle have been analysed for understanding their profit potential.
Derivatives Defined
A Derivative security is a financial contract whose value is derived from the value of some underlying asset, such as a stock, a commodity, an exchange rate, an interest rate, or even an index of prices.
Derivatives may be traded for a variety of reasons. A derivative enables a trader to hedge some pre-existing risk by taking positions in derivatives markets that offset potential losses in the underlying or spot market. In India, most derivatives users describe themselves as hedgers (Fitch Ratings, 2004) and Indian laws generally require that derivatives be used for hedging purposes only. Another motive for derivatives trading is speculation (taking positions to profit from anticipated price movements)
In the Indian context, the Securities Contracts (Regulation) Act, 1956 (SC(R) A) defines "Derivative" to include-
- 1. A security derived from a debt instrument, share, loan whether secured or unsecured, risk instrument or contract for differences or any other form of security.
- 2. A contract which derives its value from the prices, or index of prices, of underlying securities.
Derivatives are securities under the SC(R) A and hence the trading of derivatives is governed by the regulatory framework under the SC(R) A.
As per reserve bank of India:
Section 45U(a) of the RBI Act 1934 defines derivatives as:
“an instrument, to be settled at a future date, whose value is derived from change in interest rate, foreign exchange rate, credit rating or credit index, price of securities (also called ‘underlying’)’ or a combination of more than one of them and includes interest rate swaps, foreign currency-rupee swaps, foreign currency options, foreign currency rupee options or such other instruments as may be specified by the bank from time to time”
Derivatives Products
Following is a brief description of various types of Derivatives Contracts
A forward contract is a customized contract between two entities, where settlement takes place on a specific date in the future at today's pre-agreed price. In forwards, the counterparty risk is too high and mostly they are traded as over-the-counter (OTC) products.
A futures contract is a standardized exchange traded forward contract between two parties to buy or sell an asset at a certain time in the future at a certain price. In futures, the counterparty is derivative exchange and hence the counterparty risk is negligible. The liquidity of futures is high as it is market traded instrument.
- Options
Options are derivative securities which gives the holder right (but not an obligation) to buy or sell the underlying asset at a predetermined price (exercise price) on or before expiration period.
Characteristics of Options Contract
- Call Optionsand Put Options
- Call Options give the buyer the right but not the obligation to buy a given quantity of the underlying asset, at a given price on or before a given future date.
- Put Options give the buyer the right, but not the obligation to sell a given quantity of the underlying asset at a given price on or before a given date.
- American vs European Options
- An American Option can be exercised by its owner at any time on or before the expiration date.
- A European Option can be exercised by its owner only on the expiration date and not before it.
- In-the-money (ITM), At-the-Money (ATM) and Out-of-the-Money (OTM) Options
- A Call Option is said to be ITM if the price of the stock is greater than the exercise price, while if the stock price is smaller than the exercise price, the Call is said to be OTM. If the Stock price is equal to the exercise price, then the Call is said to be ATM.
- A Put option is said to be ITM if the price of the stock is less than the exercise price, while if the stock price is greater than the exercise price then the Put is said to be OTM. If the stock price is equal to the exercise price, then the Put is said to be ATM
- Warrants
Longer-dated options are called warrants and are generally traded over-the-counter.
The other various derivatives instruments are LEAPs, Baskets and SWAPs and other Exotic options
Options Strategies
Combining any of the four basic kinds of option trades (Long Call, Short Call, Long Put and Short Put) and the two basic kinds of stock trades (long and short) allows a variety of options strategies. Simple strategies usually combine only a few trades, while more complicated strategies can combine several. There are various types of option strategies such as Covered Call Writing, Protective Put, Money Spread, Time Spread and Calendar Spread, Butterfly, Box Spread and Combination strategies like STRIPs, STRAPs, Straddle, Strangle etc.
- Straddle:
Straddle is an investment strategy involving the simultaneous purchase or sale of optionderivatives that allows the holder to profit based on how much the price of the underlying security moves, regardless of the direction of price movement. There can be two types of Straddle strategies
- Long Straddle: A long Straddle involves going long(buying) both a call option and a put option on some underlying asset. The two options are bought at the same strike price and expire at the same time. The holder of a long Straddle makes a profit if the underlying price moves a long way from the strike price, either above or below. Thus, an investor may take a long Straddle position if he thinks the market is highly volatile, but does not know in which direction it is going to move. The profit potential is unlimited but the loss is limited to the premium paid on options.
- Short Straddle: A short Straddle is a non-directional options trading strategy that involves simultaneously selling a put and a call of the same underlying security, strike price and expiration date. The profit is limited to the premiums of the put and call, but it is risky if the underlying security's price goes up or down much. It is preferred when the investor perceives the market to be stable for the duration of the contract.
- Strangle:
Strangle is similar to Straddle strategy with just one difference, the call and put options have different strike prices that is,they are OTM Call and OTM Put Options. It allows the holder to profit based on how much the price of the underlying security moves, with relatively minimal exposure to the direction of price movement. Like Straddle there can be two types of Strangle strategies
- Long Strangleinvolves going long that isbuying an OTM Call and an OTM Put on the same underlying with same maturity but different strike prices. The profit potential is unlimited and the loss is restricted to the amount of premium on options. However, it is cheaper than long Straddle as the premiums for OTM Call and Put are lower than ATM Call and Put.
- Short Strangle involves going short (selling) both OTM Call and OTM Put Option of the same underlying security with same maturity but different strike prices. Here the profit is limited upto the amount of premium received but can result in significant losses if the price of the underlying fluctuates by a large margin. The premium received in Strangle is less due to writing of OTM Call and Put.
This paper evaluates the profit potential of four options strategies namely, Long Straddle, Short Straddle, Long Strangle and Short Strangle using actual market data from the official website of National Stock Exchange of India, www.nseindia.com.The paper analyses the above strategies to the futures and options segment ofCNX Nifty 50 index of the National Stock Exchange of India.
CNX Nifty 50 Index
The CNX NIFTY 50 index is National Stock Exchange of India's benchmark stock market index for Indian equity market. Nifty is owned and managed by India Index Services and Products Ltd. (IISL), which is a wholly owned subsidiary of the NSE Strategic Investment Corporation Limited.
NIFTY 50 Index has shaped up as the largest single financial product in India, with an ecosystem comprising: exchange traded funds (onshore and offshore), exchange-traded futures and options (at NSE in India and at SGX and CME abroad), other index funds and OTC derivatives (mostly offshore). NIFTY 50 is the world’s most actively traded contract.The NIFTY 50 covers 22 sectors of the Indian economy and offers investment managers exposure to the Indian market in one portfolio.
The NIFTY 50 index is a free float market capitalisation weighted index. The Nifty 50 index tracks the behaviour of a portfolio of blue chip companies, the largest and most liquid Indian securities. It includes 50 companies listed on the NSE, captures approximately 65% of its float adjusted market capitalization.The index was initially calculated on full market capitalisation methodology. From June 26, 2009, the computation was changed to free float methodology. The base period for the CNX Nifty index is November 3, 1995, which marked the completion of one year of operations of National Stock Exchange Equity Market Segment. The base value of the index was set at 1000, and a base capital was 2.06 trillion.
Trading in derivative contracts based on Nifty 50 The National Stock Exchange of India Limited (NSE) commenced trading in derivatives with index futures on June 12, 2000. The futures contracts on the NSE are based on the Nifty 50. The exchange introduced trading on index options based on the Nifty 50 on June 4, 2001. The CNX Nifty is professionally maintained and is ideal for Derivatives trading.
Period of Study
The paper studies the profit potential of the above mentioned 4 strategies in the above index for a period of 5 years (60 Monthly contracts) starting from April 1, 2011 and to March 31, 2016.
Assumptions
Following points are important to understand the results of the analysis
- Only one month contracts are bought or sold
- The new contract is bought the next working day when the last contract has expired
- For Spot prices, Futures Prices, Strike prices and Option Prices, the researcher has referred to historical data section of NSE’s official website www.nseindia.com
- For selecting the strike price for options under Straddle and Strangle, following methodology has been used
- For Straddle – Since it is not possible to always find ready ATM strike prices as on every transaction date, the strike price closest to the transaction day opening spot price is taken as the ATM strike price. ATM Put and ATM Call with an expiry of one month are bought at the open price on the day of entering the contract. At the end of the contract, if the contract expires in the money for any option, the profits has been recorded. Otherwise the options are allowed to expire worthless
- For Strangle - OTM Put and OTM Call with an expiry of one month are bought at the open price on the day of entering the contract. At the end of the contract, if the contract expires in the money for any option, the profits have been recorded. Otherwise the options are allowed to expire worthless.
- During the study, it was observed that on some days, a nearest OTM strike price would have no opening option prices, therefore on those dates the settlement price has been used instead of the opening price.
- Once a contract expires, it is assumed that on the next working day, one month Call and Put options as relevant to the strategy are bought/sold and the process continues for all the 60 months covered in the study.
- The actual lot sizes have been used as prevalent in a particular month.
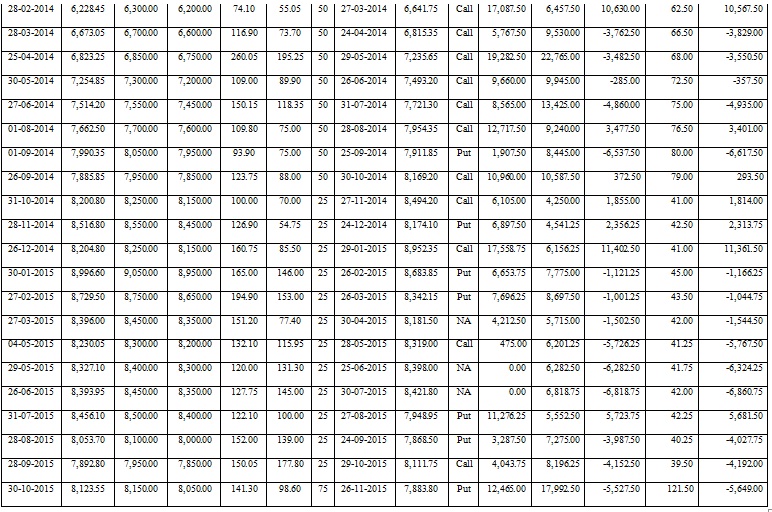
- Lot size of 50 for contracts expiring on April 28, 2011 to 30 October, 2014
- Lot size of 25 for contracts expiring on November 29, 2014 to October 29, 2015
- Lot size of 75 for contracts expiring on November29, 2015 to March 31, 2016
- Brokerage has been assumed to be 0.01% of the contract value of options and 0.01% of the contract valueof futures. Also for calculating returns on traditional Nifty investment brokerage has been assumed to be 0.01% of the total purchase value.
- For options that are written (sold), initial margin amount has been assumed to be 10% of the Contract Value of Option as reduced by the amount of premium received.
- The interest on margin amount has been calculated at 10% p.a. on monthly basis assuming each contract is for 30 days and 360 days in a year.
ANALYSIS OF DATA
STRADDLE STRATEGY
LONG STRADDLE
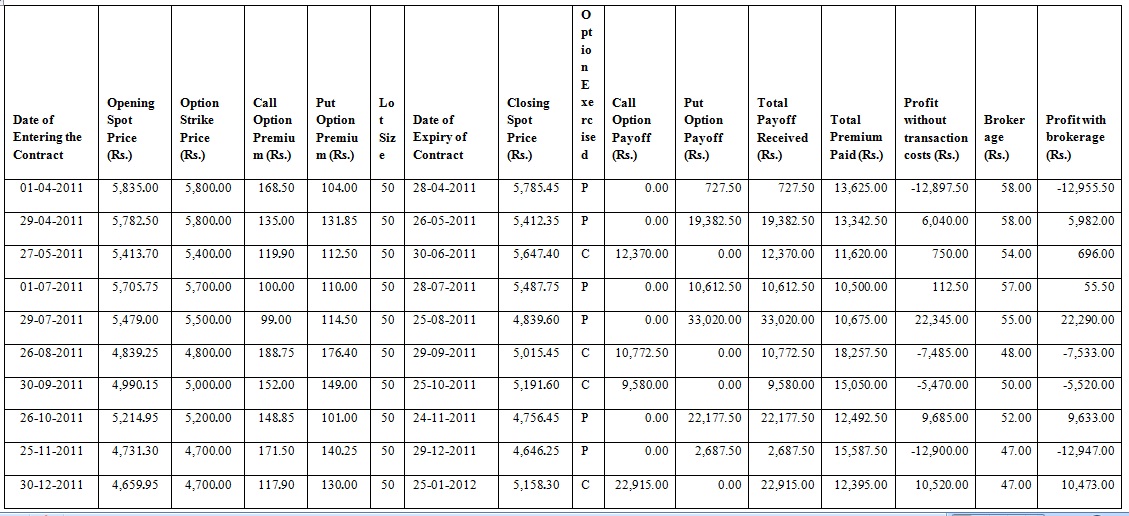
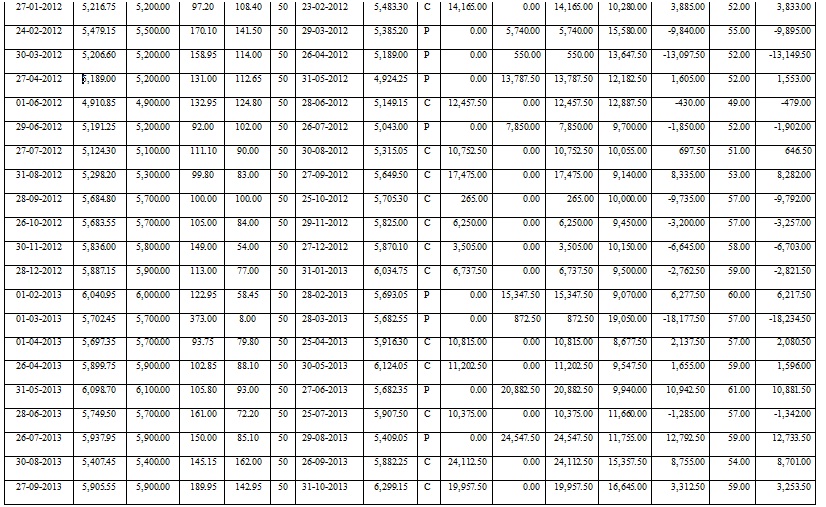
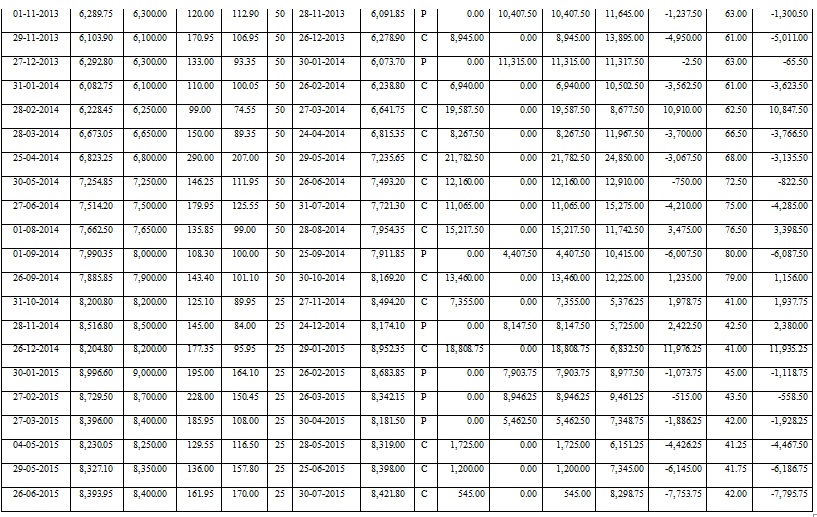
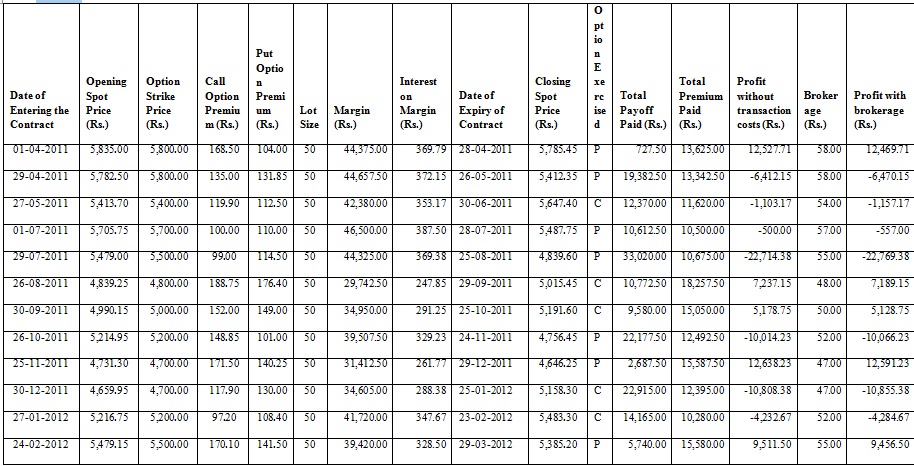
Analysis
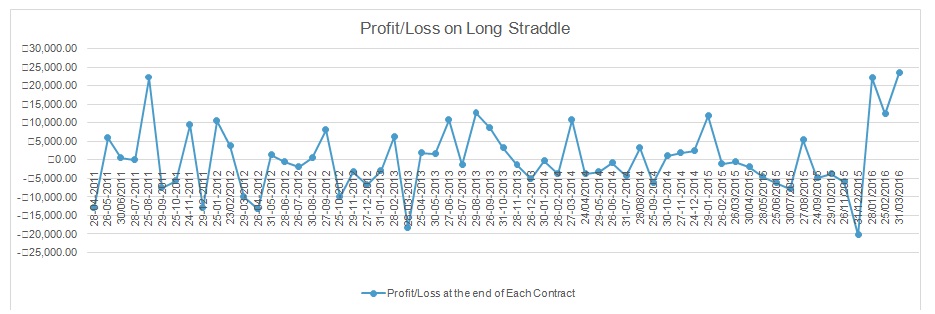
From the above analysis, we can conclude that long straddle is a profitable strategy in the Indian Derviatives Market. Applying long straddle on Nifty for a period of 60 months an investor could have earned a profit of 16,958.75 without transaction costs and 13,356.75 when transaction costs are considered. The strategy has been applied uniformly throughout the study period. The profit and loss on the expiry of each contract has been volatile but overall the net position has been positive. The return on average capital invested of 12,231.13 is 14.85% p.a. which is higher than traditional investment in CNX Nifty. While applying the above strategy, it was observed that the Call options were exercised 34 times whereas Put options were exercised 26 times. Overall it can be said that Indian derivatives market are volatile as long straddle is profitable when the prices are volatile but the direction of their movement cannot be predicted with certainty. The following chart depicts the profit/loss on the strategy at the end of each contract expiry.
SHORT STRADDLE
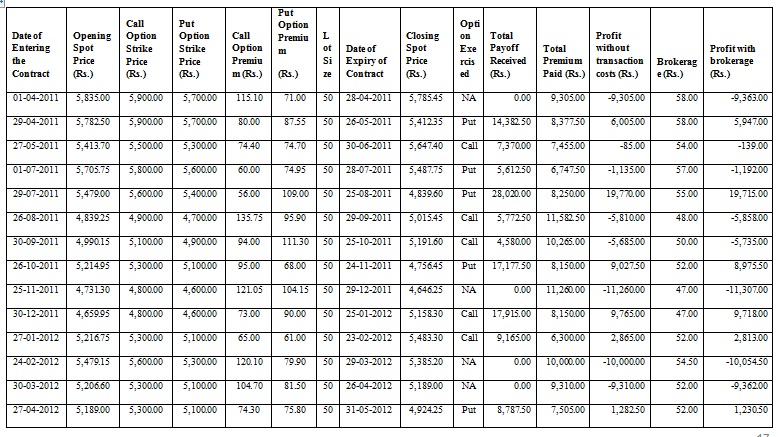
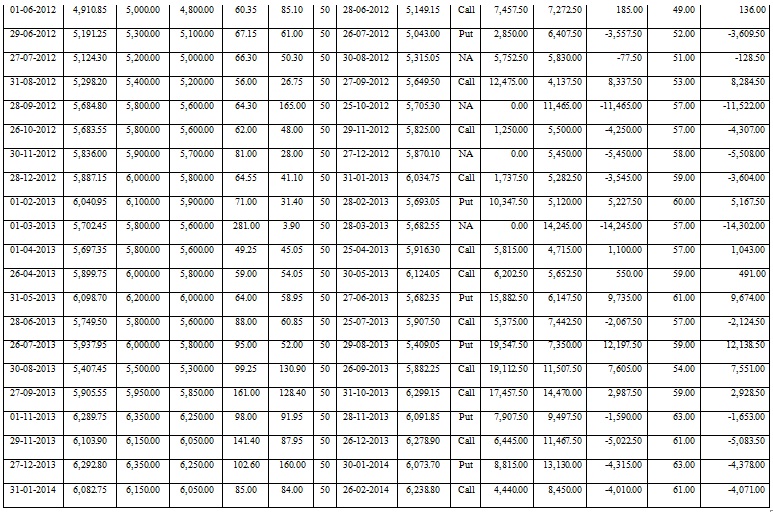
Data Table
Table 2
Analysis
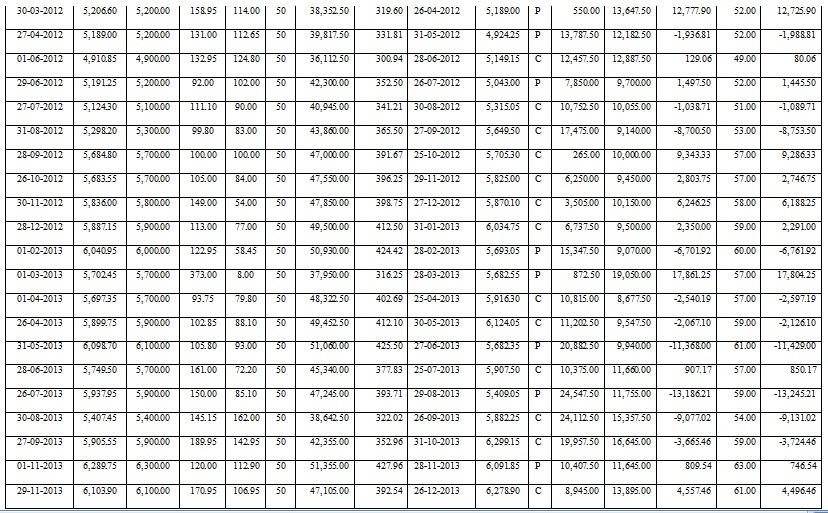
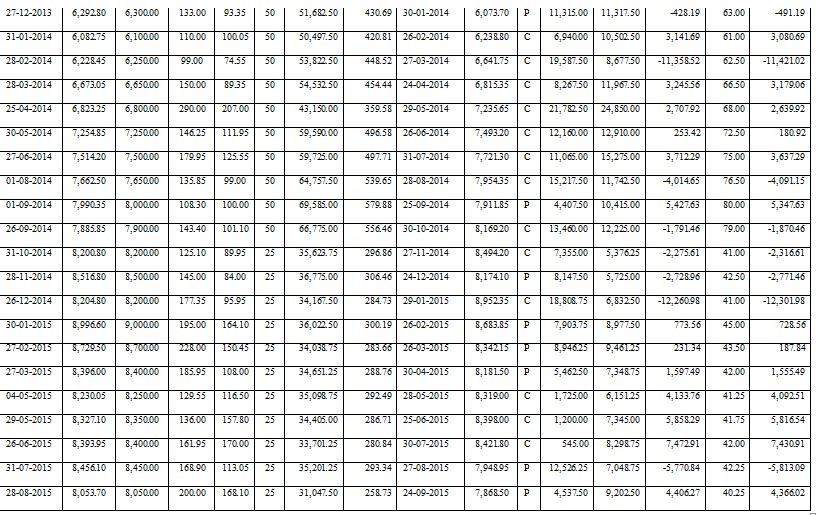
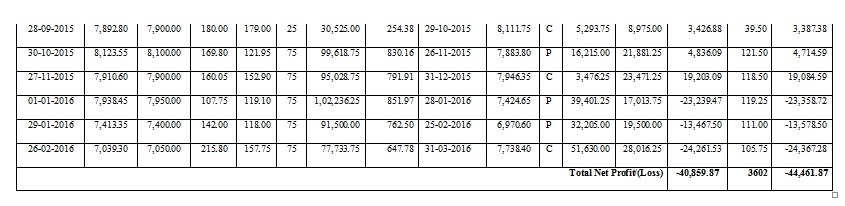
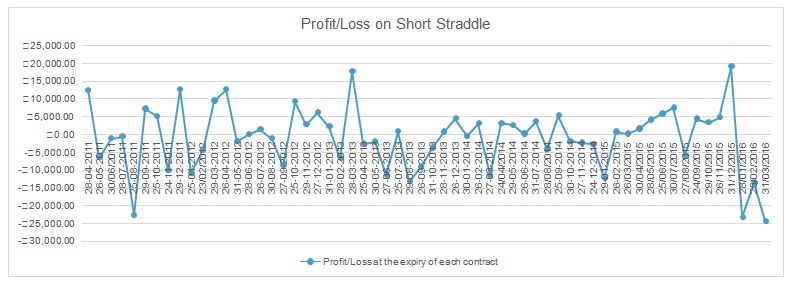
From the above table, we have observed that Short Straddle does not have earning potential in the context of Indian Derivatives market. As witnessed from the table, the strategy when applied to Nifty for past 5 years on monthly basis have resulted in loss of 40,859.87 even when transaction costs are not considered. The loss however, shoots up to 44,461.87 when transaction costs of Rs 3,602.00 are considered. This analysis reveals that Indian derivatives market is not suitable for systematic speculation as Short Straddle has not resulted in Profit. The Profit/Loss as on the expiry of each contract has been highly volatile as witnessed in the following table:
Figure 2
STRANGLE
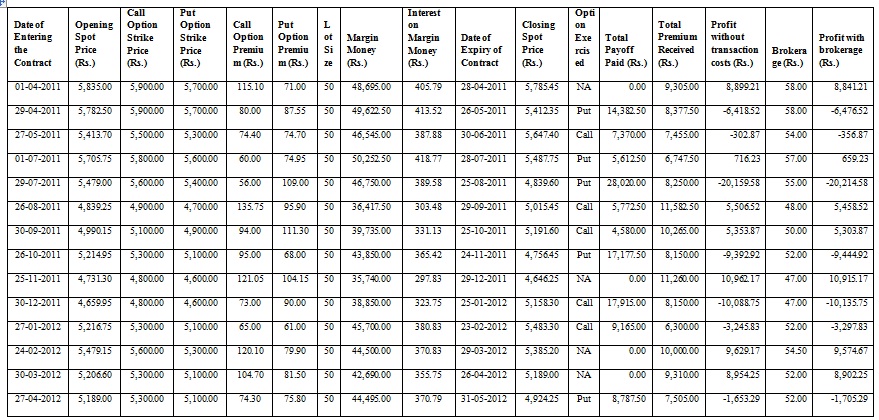
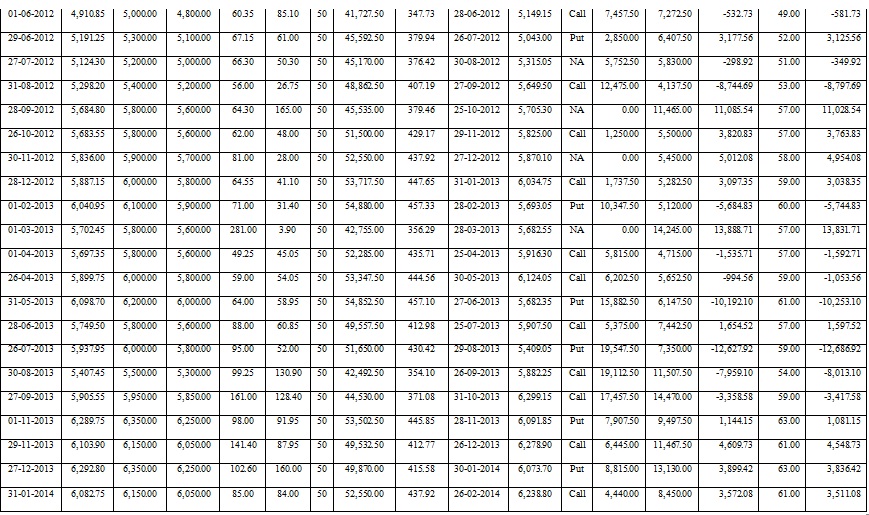
Long Strangle
Data Table
Table 3
Analysis
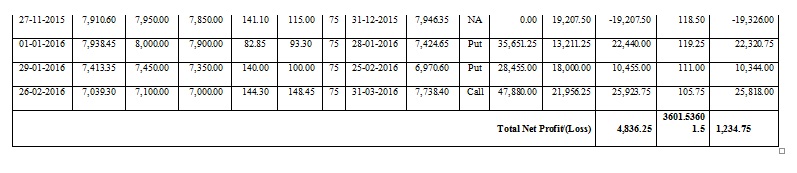
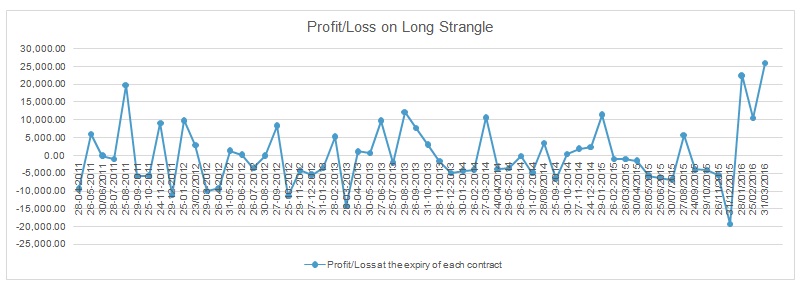
From the above table, we can observe that like long straddle, long strangle strategy has also resulted in profit when applied to Indian Derivatives Market. When applied uniformly to Nifty for a period of 5 years over 60 contracts, the strategy has resulted in a profit of 4836.25 when transaction costs are not considered and 1,234.75 when transaction costs are considered. The return on an average capital invested of 9,190.35 is 2.52% p.a. The reduced amount of profit is in accordance with the concept of strangle being a more conservative (less risky) strategy. Overall during the study, it was found that the call price was exercised 27 times and put options were exercised 21 times and no options were exercised on the remaining 12 contracts. The profit/loss on the expiry of each contract is presented in the following chart.
Figure 3
SHORT STRANGLE
Data Table
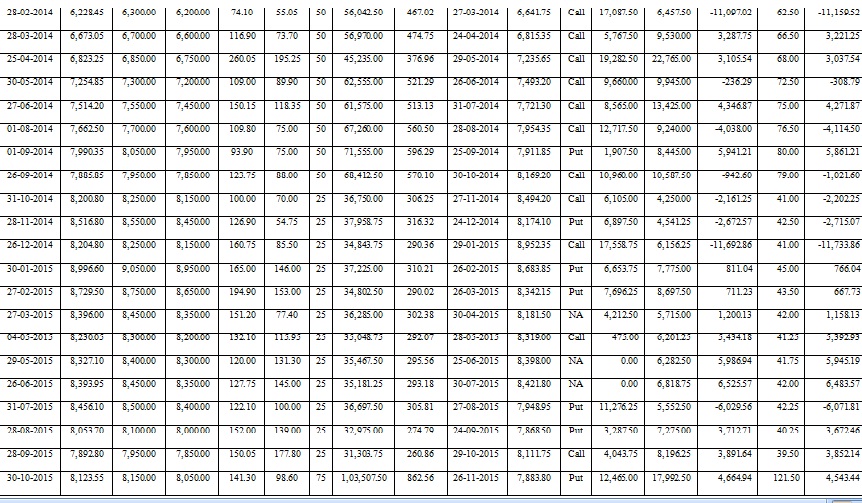
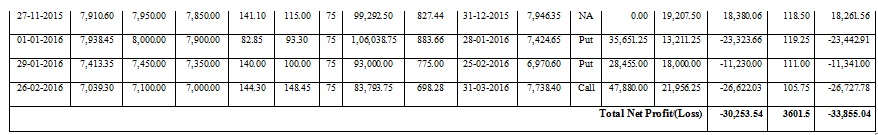
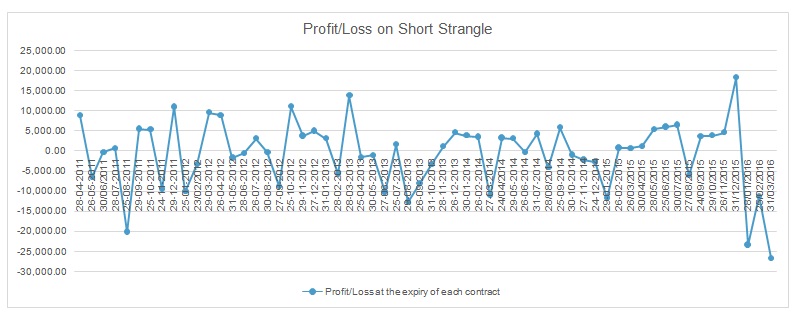
Analysis
From the above table, we have observed that applying Short Strangle strategy in the Indian Derivatives Market has resulted in a loss. Since the long strategy resulted in a profit it was evident that the short strategy would result in loss. The strategy overall when applied to 60 successive months taking monthly contracts have resulted in a loss of Rs. 30,253.54 when the transaction costs are not considered, and has swelled up to Rs. 33,855.04 when transaction costs are considered. Even the profit/loss value at the end of each contract has been highly volatile to provide any useful insight. This can be witnessed from the following chart. During the study, it was observed that the Nifty prices have breached the OTM Call strike price 27 times and the OTM Put strike price 21 times and the 12 times it has remained within the level of the two strike prices.
Return on Traditional Nifty Investment during the period
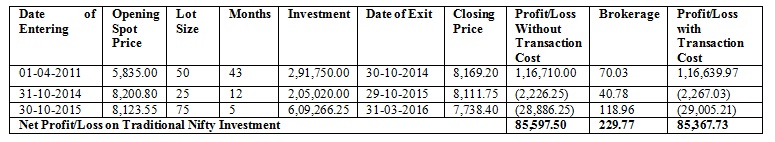
If the Investor has traditionally invested in Nifty using the same lot sizes as considered during the same period of investment, then the return earned by him over the 60-month period is computed as follow:
The investment horizon has been divided into 3 periods due to the lot size changes in the futures and options segment of the CNX Nifty 50. The three periods respectively are
- Holding period 1 – From April 1, 2011 to October 30, 2014 (43 Contracts)
- Holding Period 2 – From October 31, 2014 to October 29, 2015 (12 Contracts)
- Holding Period 3 – From October 30, 2015 to March 31, 2106 (5 Contracts)
Table 5
Calculation of Compounded Return under Traditional Investment in Nifty (without transaction Charges)
Holding Period 1 (01-04-2011 to 26-06-2014) – 9.43%
Holding Period 2 (27-07-2014 to 30-07-2015) – (-1.09%)
Holding Period 3 (31-07-2015 to 31-03-2016) – (11.60%)
Total Compounded Return without transaction Charges – 5.87%
Calculation of Compounded Return under Traditional Investment in Nifty (with transaction Charges)
Holding Period 1 (01-04-2011 to 26-06-2014) – 9.42%
Holding Period 2 (27-07-2014 to 30-07-2015) – (-1.10%)
Holding Period 3 (31-07-2015 to 31-03-2016) – (-11.62%)
Total Compounded Return without transaction Charges – 5.85%
Conclusion
Looking at the above analysis, it can be concluded that Indian derivatives market are highly volatile and therefore Long Straddle and Long Strangle strategies are profitable. Though the amount of profit is low, it is because of high options prices which ranges between 2 to 2.5% of the strike price. Long straddle strategy achieved an annual return of 14.85% p.a. which is higher than the return under traditional investment in CNX Nifty which was only 5.85% p.a.Overall, the long strategies were profitable and the short strategies resulted in losses. The higher losses in short strategies were due to the loss of interest on margin which was not the part of cost in long strategies. Also, transaction costs are always an outflow which further magnifies the loss in short strategies.
Overall it can be concluded that bullish on volatility strategies, Strangle and Straddle (Long) were more successful whereas the short strategies resulted in losses.
References
Books
Chance, D. M., & Brooks, R. (2015).Introduction to derivatives and risk management. Cengage Learning.
Hull, J. C. (2006).Options, futures, and other derivatives. Pearson Education India.
Gupta, S. L. (2005).Financial Derivatives: Theory, concepts and problems. PHI Learning Pvt. Ltd.
Websites
National Stock Exchange (NSE), www.nse-india.com
Money Control, www.moneycontrol.com
Wikipedia, www.wikipedia.org
Research Papers
Deepak, P. L., Scholar, P. R., & Amudha, R. (2015) Hedging of Financial Derivatives: Contrivance to maximize returns.
Shah, C. B. (2015). A Study on back testing of Bull Call Debit spread strategy on Nifty Index Options. IOSR Journal of Business and Management (IOSR-JBM), 72-80.
Mandaviya, J. (2014). A Ready Reckoner to Options Strategies. SAMZODHANA – “Journal of Management Research”, 2 (1).
Girish, G. P., & Rastogi, N. (2013). Efficiency of S&P CNX Nifty Index Option of the National Stock Exchange (NSE), India, using Box Spread Arbitrage Strategy.Gadjah Mada International Journal of Business,15(3).
Singh, V. K., & Ahmad, N. (2011). Forecasting Performance of Volatility Models for Pricing S&P CNX Nifty Index Options via Black-Scholes Model.IUP Journal of Applied Finance,17(3), 53.
Vashishtha, A., & Kumar, S. (2010). Development of financial derivatives market in India-a case study.International Research Journal of Finance and Economics,37(37), 15-29.
Santa-Clara, P., & Saretto, A. (2009). Option strategies: Good deals and margin calls.Journal of Financial Markets,12(3), 391-417.
Sehgal, S., & Vijayakumar, N. (2008). Determinants of implied volatility function on the nifty index options market: Evidence from India.Asian Academy Of Management Journal Of Accounting And Finance,4, 45-69.
Schneeweis, T., & Spurgin, R. B. (2001). The benefits of index option-based strategies for institutional portfolios.The Journal of Alternative Investments,3(4), 44-52.
Coval, J. D., & Shumway, T. (2001). Expected option returns.The journal of Finance,56(3), 983-1009

