A Refereed Monthly International Journal of Management
THE IMPACT OF DIVIDEND POLICY ON SHAREHOLDERS’ WEALTH: EVIDENCE FROM CONSUMER CYCLICAL SECTOR IN INDIA
AUTHORS
|
Sandanam Gejalakshmi
Ph.D Research Scholar
Kanchi Mamunivar Centre for PG Studies
Deenbandhu Chhotu Ram University of Science & Technology, Murthal, Sonipat. Haryana
Puducherry – 605 008, India
Email:sankari_sandanam@yahoo.co.in
|
Dr. RAMACHANDRAN AZHAGAIAH
Associate Professor of Commerce
Avvaiyar Govt. College for Women
Karaikal – 609602, India
Email:drrazhagaia@yahoo.co.in
|
Abstract
Dividend policy (DP) is the most important to shareholders because it can affect the share price and shareholders’ wealth (SW) as well. Generally, higher dividends increase the market price of the share and vice versa. Besides higher future dividends may also increase the market price of share and thereby end up with wealth maximization of the shareholders. Hence, the objective of the paper is to analyze the impact of DP on SW of Consumer Cyclical Sector in India. Out of 13firms listed on Bombay Stock Exchange (BSE), 10 firms that have been paying dividend consecutively for the recent past ten years are considered for analysis. Besides descriptive statistics, Augmented Dickey Fuller Test (ADF), Levin, Lin & Chu (LLC) t test, Philip Perron (PP) Fisher test, Im- Pesaran-Shin W (IPS-W) and Breitung test are used. To test whether the data are stationary and to satisfy one pre-condition for co-integration, Johansen Co-integration test is used. Regression and Chow test are also applied to differentiate the impact between pre and post financial meltdown periods. The results of the co-integration test proves that there exists a stationary, long-run co-integration between DP and SW. Regression result proves that DP has significant impact on SW and the Chow test result proves that the impact of DP on SW of Consumer Cyclical Sector has been significantly affected by the event viz., the financial meltdown in respect of variable dividend yield (DY) and not for the other selected variables viz., dividend per share (DPS) and dividend payout (DPO).
Key words: Dividend policy, Shareholders’ wealth, Financial meltdown
JEL Classification: G 35, L 25, L 62
1. Introduction
The principal financial objective of any business enterprise is to maximize the shareholders’ wealth (SW). The corporate function of maximizing the SW assumes that managers operate in the best interests of the shareholders. Therefore, it takes place when the returns to the shareholders’ on the investment are maximized. In addition, these returns are made up of capital gains in the form of increase in the share prices, as well as dividends, which are made possible when the firm generates adequate distributable profits.
When facing uncertainty, it is not always possible for a firm to achieve its objectives. Wealth creation in entrepreneurial and established organizations is a complex and challenging task. Therefore, in an ever-changing environment, any organization wishing to maintain a competitive position and to satisfy its shareholders’ expectation should be engaged in planning carefully every time when there is a need for.
The SW (Azhagaiah and Sabaripriya, 2008) is represented by market price of the firm’s common stock, which in turn, is the function of the firm’s investment, financing and dividend decision. The modern approach of financial management provides a conceptual and analytical framework for decision making, which emphasizes the effective use of resources to create SW. The optimal dividend policy (DP) is one that maximizes the firm’s stock price; this leads to maximization of SW and thereby ensures rapid economic growth.
Therefore, the present study is aimed at to study the long-run co-integration between the DP and the SW, and the impact of DP on SW before and after an event viz., the global financial meltdown.
2. Profile of the Study Sector - Consumer Cyclical Sector in India
Consumer cyclical sector includes industries such as automotive, housing, entertainment and retail. The sector can further be divided into durable and non-durable sectors. Durable includes physical goods such as hardware or vehicles, while consumer non-durable represents sector viz., entertainment or hotel services.
The performance of consumer cyclical sector is highly related to the state of the economy. It represents goods and services that are not considered necessities, but for luxurious purchases. During contractions or recessions, investors have less disposable income to spend on consumer cyclical. When the economy is expanding or booming, the sale of these goods rise as retail and leisure spending increase.
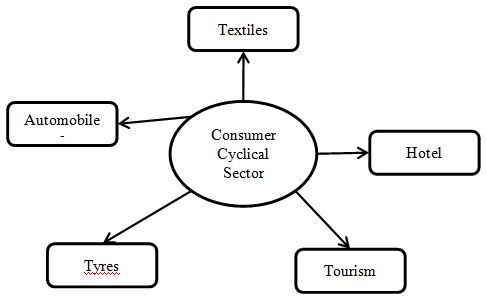
Consumer cyclical sector comprises textiles, automobiles, tyres, hotel, tourism and others as shown in figure A.
Figure A:Industries of Consumer Cyclical Sector
3. Review of Literature
Researchers have propounded many theories about a firm’s value as well as the SW. There has been a substantial literature on the relationship between the DP and the SW and the impact of DP on SW. Several studies were made in respect of determinants of DP as well asSW in the developed as well as in the developing economics like India.
Vijaya kumar (2011) revealed that the sales and profit after tax of automobile firms had strong relationship with SW. Devaki and Kamalaveni (2012)revealed that there was a positive association between lagged dividend, earnings, debt-equity ratio, sales size, age of the firm and institutional shareholding of the Indian corporate hotels. Ganesh et al. (2013) found that the economic value added, market value added, cash flow, and market to book value ratio were healthier in Ashok Leyland than that of the Tata Motors.
Priya and Nimalathasan (2013) revealed that dividend payout had a significant impact on SW. Further, earnings per share (EPS), price earnings ratio (P/E) and market price to book value (MP_BV) had significant correlation with return on assets (ROA); the P/E ratio had significant correlation with return on equity (ROE); EPS and the MP_BV were significantly correlated with ROE of the selected hotels and restaurants in Sri Lanka.
Kumaresan (2014) found that there was a positive relationship between return on equity, dividend per share and DP and SW of the firms while there was a negative relationship between retention ratio and SW of the listed firms in hotel and travel sectors of Sri Lanka.
Iqbal et al. (2014)found that the DP, firm size and firm growth had significant positive impact on SW of selected manufacturing industries from three sectors viz., textile, sugar and chemical.
Ashvin (2012) found that there was a linear relationship between dividend decision and market price of stock of the firm of selected auto sector. Ajanthan (2013) showed that the DP was a crucial factor affecting the firm’s performance of the listed hotels and restaurants in Sri Lanka.
The above literature provides a review of impact of DP on SW. The previous studies, by and large, were attempted to study the long-run and short-run co-integration between DP and SW and the impact of DP on SW. In the present study, an attempt has been made to estimate the difference in the impact of DP on SW between pre and post financial meltdown periods.
4. Statement of the Problem
Previous researchers have propounded many theories on DP as well as on SW. Thus, the researchers are puzzled by the question, “whether SW was affected by DP? for many years. In the literature, there are different views regarding whether DP affects firm’s share price in the long-run. Some studies showed that the firm’s value was not influenced by DP while some others showed that DP affected firm’s value (Toby, 2014; and Baker Collins et al.2007). So, the present study has made an attempt to study the difference in the impact of DP on SW between pre and post financial meltdown periods of the selected firms of Consumer Cyclical Sector in India.
5. Research Questions
The research proposes to seek answers to the following questions:
- Whether long-run relationship exists between dividend policy and shareholders’ wealth of listed firms of Consumer Cyclical Sector during the study period.
- How do the dividend variables along with financial variables influence the shareholders’ wealth of Consumer Cyclical Sector?
- How do finance variables (after removing dividend variables) influence the shareholders’ wealth of the Consumer Cyclical Sector in India?
- How does dividend policy impact shareholders’ wealth before and after financial meltdown of Consumer Cyclical Sector in India?
6. Objectives of the Study
- To study the difference in the impact of dividend policy on shareholders’ wealth between before and after financial meltdown periods.
6.1. Specific Objectives
- To study the long-run relationship between dividend per share, dividend payout as well as dividend yield and shareholders’ wealth of the Consumer Cyclical Sector in India.
- To estimate the impact of dividend variables along with finance variables on shareholders’ wealth of the Consumer Cyclical Sectorin India.
- To estimate the influence of finance factors on shareholders’ wealthof the Consumer Cyclical Sector in India.
- To study the difference in the impact of dividend policy on shareholders’ wealth of Consumer Cyclical Sector between pre and post financial meltdown periods.
-
7. Hypotheses Developed for the Study
- H01:“There is no co-integration between dividend per share and shareholders’ wealth”.
- H02:“There is no co-integration between dividend payout and shareholders’ wealth”.
- H03: “There is no co-integration between dividend yield and shareholders’ wealth”.
- H04:“There is no significant impact of dividend policy on shareholders’ wealth”.
- H05: “There is no significant difference in the impact of dividend per share on shareholders’ wealth between pre and post financial meltdown periods”.
- H06: “There is no significant difference in the impact of dividend payout on shareholders’ wealth between pre and post financial meltdown periods”.
- H07:“There is no significant difference in the impact of dividend yield on shareholders’ wealth between pre and post financial meltdown periods”.
8. Research Methodology
8.1. Data Source and Period of the Study
The study used secondary data, which are collected from the capital market data base called Centre for Monitoring Indian Economy Private Limited (Prowess CMIE) for a period of 10 years on year to year basis from 2003-04 to 2012-13.
8.2. Sampling Procedure and Technique
The study used multi-stage non-random sampling technique and the different stages involved in it are shown in figure B.
Figure – B
Multi-stage Non-Random Sampling Procedure

Source: Compiled and edited data collected from PROWESS database provided by CMIE
|
Table-1- List of Firms Selected for the Study (Based on listed firms in BSE 200) for
the Study Period 2003-04 – 2012-13
|
|
Total No. of Firms (1)
|
Dividend non-paying firms
(2)
|
Adequate Data not available in the data source (3)
|
Total number of firms not considered for the study
(4)= (2+3)
|
Ultimate sample firms selected for the study
(5) =(1) - (4)
|
|
|
13
|
2
|
1
|
3
|
10
|
|
Source: Compiled data collected from PROWESS database provided by CMIE
Table 1 shows the number of
firms of Consumer Cyclical sector listed in Bombay stock exchange (13), out of which dividend non-paying firms (2), and firms for which adequate data were not in the data source (1) are eliminated, hence the ultimate number of sample firms considered for the study is 10 only.
8.3. Research Methods
Besides various dividend variables and finance factors, statistical methods viz., Augmented Dickey Fuller Test, Johansen Co-integration, Ordinary Least Square method and Chow test are applied for analysis of data using Eviews 7 Econometrics software package.
8.4. Ratios used for Analysis
The study used two important ratios viz., dividend related ratios and shareholders’ wealth related ratios and details of the ratios used for analysis are shown in table2.
Table2- Dividend Variables (DPS, DPO and DY) used to Estimate the Impact of DP on SW (MPS)
|
Sl.No.
|
Classification of Dividend Ratios
|
Variables
|
Description
|
Inference
|
|
I
|
Dividend related ratios
|
1. Dividend per share (DPS)
|
Dividend / Number of equity shares outstanding
|
The DPS reveals how well earnings support the dividend payout.
|
|
2. Dividend payout ratio (DPO)
|
Dividend per share / Earnings per share
|
The DPO provides an idea as to how well earnings support the dividend payment. Mature firms tend to have a higher payout ratio, while low dividend payout ratio enables the firm to keep a large portion of its earnings for its future growth.
|
|
3. Dividend yield (DY)
|
Dividend per share / Market price per share
|
The DY shows how much a firm pays out as dividend each year relative to its share price. Higher dividend yield has been considered to be desirable for most investors. A high share price will lead to low dividend yield and vice versa.
|
|
II
|
Shareholders' wealth (SW) related ratio
|
1. Market price per share (MPS)
|
Market capitalization / Number of equity shares outstanding
|
High market price reflects that the firms are in very good position and low market price reflects reverse.
|
Table2shows the variables used to study the co-integration between DP and SW and to analyze the impact of DP on SW before and after financial meltdown periods. Market price per share (MPS) is considered as proxy response variable for shareholders’ wealth (SW), while dividend per share (DPS), dividend payout (DPO), and dividend yield (DY) are considered as predictor dividend variables.
Besides, the study also used finance variables viz., return on capital employed (R_CE), return on net worth (R_NW), return on assets (ROA), return on long-term fund (R_LF), return on equity (ROE), total debt to equity (TD_EQ), total debt to total assets (TD_TA), total debt to fixed assets (TD_FA), equity multiplier (EM), proprietary ratio (PR), total liabilities to net worth (TL_NW), current ratio (CR), quick ratio (QR), earnings per share (EPS), price earnings ratio (PER), working capital to total assets (WC_TA), current assets to total assets (CA_TA), and net fixed assets to net worth (NFA_NW) as predictor variables to study the impact of DP on SW.
For the analysis of pooled data for ten years i.e. from 2003-04to 2012-13 the following research methods are used.
- Descriptive Statistics (Jarque-Bera test)
- Augmented Dickey Fuller Test, Levin, Lin & Chu (LLC) t test (2002), Philip Perron (PP) Fisher test (1988), Im-Pesaran-Shin W test (IPS-W)(2003) and Breitung test (2000)
- Johansen Co-integration test (Johansen and Juselius, 1990 and Osterwald-Lenum, 1992)
- Ordinary Least Square Method of Regression and
- Chow test(1960)
9. Relationship between DP and SW: Analysis and Discussion
Consumer Cyclical Sector
Test of normality
Table 3 shows the mean, standard deviation, skewness and kurtosis along with Jarque Bera test for MPS, DPS, DY, DPO and EPS of ten firms of Consumer Cyclical sector. As presented in table 3, the mean of MPS ranges from 56.44 (Ashok Leyland) to 4844.91 (MRF).
Table 3 - Descriptive and Jarque-Bera Normality Test Statistics for Market Price per Share and Dividend / Finance Variables for Firms under Consumer Cyclical Sector from 2003-04 to 2012-13
|
Firm Name
|
Mean
|
SD
|
Skewness
|
Kurtosis
|
Jarque Bera Test
|
|
Value
|
p Level
|
|
Market Price per Share (MPS)
|
|
Apollo Tyres
|
145.59
|
100.46
|
0.36
|
1.62
|
1.01
|
0.6039
|
|
Ashok Leyland
|
56.44
|
49.47
|
2.19
|
6.55
|
13.26**
|
0.0013
|
|
Century Textiles & Industries
|
383.75
|
202.42
|
0.73
|
3.49
|
0.99
|
0.6096
|
|
Eicher Motors
|
697.17
|
727.84
|
1.43
|
3.73
|
3.62
|
0.1637
|
|
Exide Industries
|
123.5
|
44.38
|
0.04
|
2.59
|
0.07
|
0.9642
|
|
Grasim Industries
|
2026.64
|
765.48
|
-0.36
|
1.92
|
0.71
|
0.7011
|
|
Indian Hotels Co.
|
293.72
|
308.53
|
1
|
2.4
|
1.83
|
0.4001
|
|
MRF
|
4844.91
|
3006.44
|
0.9
|
2.83
|
1.37
|
0.5044
|
|
Mahindra & Mahindra
|
621.45
|
184.23
|
-0.52
|
2.25
|
0.69
|
0.7083
|
|
Tata Motors
|
562.94
|
241.64
|
0.64
|
2.44
|
0.81
|
0.6664
|
|
Dividend Per Share (DPS)
|
|
Apollo Tyres
|
0.5
|
0.09
|
2.22
|
6.73
|
14.03**
|
0.0009
|
|
Ashok Leyland
|
1.22
|
0.42
|
0.29
|
2.32
|
0.33
|
0.8462
|
|
Century Textiles & Industries
|
0.42
|
0.13
|
-0.48
|
1.76
|
1.03
|
0.5973
|
|
Eicher Motors
|
1.14
|
0.85
|
0.89
|
2.69
|
1.36
|
0.5055
|
|
Exide Industries
|
0.79
|
0.55
|
0.55
|
1.55
|
1.38
|
0.5008
|
|
Grasim Industries
|
2.33
|
0.59
|
-0.14
|
1.7
|
0.74
|
0.6915
|
|
Indian Hotels Co.
|
1.19
|
0.35
|
0.93
|
2.7
|
1.49
|
0.4739
|
|
MRF
|
2.5
|
0.91
|
2.31
|
7
|
15.56**
|
0.0004
|
|
Mahindra & Mahindra
|
1.63
|
0.71
|
0.52
|
1.57
|
1.31
|
0.5184
|
|
Tata Motors
|
1.35
|
0.46
|
-0.02
|
2.13
|
0.31
|
0.8552
|
|
Dividend Yield (DY)
|
|
Apollo Tyres
|
0.63
|
0.56
|
1
|
2.58
|
1.73
|
0.4219
|
|
Ashok Leyland
|
2.96
|
1.26
|
-0.9
|
2.76
|
1.38
|
0.5023
|
|
Century Textiles & Industries
|
0.13
|
0.05
|
-0.12
|
2.06
|
0.4
|
0.8201
|
|
Eicher Motors
|
0.25
|
0.26
|
2.24
|
6.71
|
14.08**
|
0.0009
|
|
Exide Industries
|
0.7
|
0.43
|
-0.21
|
1.26
|
1.33
|
0.5133
|
|
Grasim Industries
|
0.13
|
0.04
|
0.47
|
1.94
|
0.84
|
0.6561
|
|
Indian Hotels Co.
|
0.91
|
0.62
|
-0.19
|
1.3
|
1.26
|
0.5326
|
|
MRF
|
0.07
|
0.04
|
0.25
|
1.79
|
0.71
|
0.6999
|
|
Mahindra & Mahindra
|
0.26
|
0.08
|
0
|
1.44
|
1.01
|
0.6038
|
|
Tata Motors
|
0.25
|
0.07
|
0.62
|
2.1
|
0.99
|
0.6111
|
|
Dividend Payout (DPO)
|
|
Apollo Tyres
|
7.54
|
5.71
|
0.46
|
1.77
|
0.98
|
0.6122
|
|
Ashok Leyland
|
44.25
|
29.55
|
1.25
|
4.42
|
3.47
|
0.1767
|
|
Century Textiles & Industries
|
6.56
|
13.84
|
2.65
|
8.07
|
22.47**
|
0
|
|
Firm Name
|
Mean
|
SD
|
Skewness
|
Kurtosis
|
Jarque Bera Test
|
|
Value
|
p Level
|
|
Eicher Motors
|
5.53
|
5.34
|
1.8
|
4.9
|
6.92*
|
0.0315
|
|
Exide Industries
|
14.14
|
9.95
|
-0.09
|
1.44
|
1.02
|
0.6005
|
|
Grasim Industries
|
1.88
|
0.65
|
1.71
|
4.94
|
6.47*
|
0.0394
|
|
Indian Hotels Co.
|
30.48
|
19.95
|
0.12
|
1.39
|
1.1
|
0.5775
|
|
MRF
|
0.97
|
0.62
|
0.2
|
1.41
|
1.13
|
0.5693
|
|
Mahindra & Mahindra
|
4.59
|
1.4
|
0.22
|
1.39
|
1.17
|
0.5582
|
|
Tata Motors
|
6.18
|
5.68
|
1.84
|
5.15
|
7.55*
|
0.0229
|
|
Earnings Per Share (EPS)
|
|
Apollo Tyres
|
11.67
|
8.4
|
0.56
|
2.04
|
0.9
|
0.6387
|
|
Ashok Leyland
|
3.9
|
3.05
|
2.13
|
6.42
|
12.43**
|
0.002
|
|
Century Textiles & Industries
|
18.63
|
11.24
|
0.14
|
1.75
|
0.68
|
0.7113
|
|
Eicher Motors
|
23.82
|
14.33
|
1.86
|
5.23
|
7.81*
|
0.0201
|
|
Exide Industries
|
7.15
|
3.41
|
0.28
|
1.75
|
0.77
|
0.6791
|
|
Grasim Industries
|
137.52
|
55.46
|
0
|
2.37
|
0.16
|
0.9213
|
|
Indian Hotels Co.
|
7.45
|
7.48
|
1.17
|
2.77
|
2.3
|
0.3166
|
|
MRF
|
420.63
|
317.61
|
0.5
|
1.76
|
1.07
|
0.5871
|
|
Mahindra & Mahindra
|
35.81
|
9.6
|
-1.04
|
3.83
|
2.08
|
0.3533
|
|
Tata Motors
|
32.25
|
16.32
|
-0.19
|
2.01
|
0.47
|
0.7912
|
|
Tata Motors
|
32.25
|
16.32
|
-0.19
|
2.01
|
0.47
|
0.7912
|
Source: Computed from the compiled & edited data from the financial statements of selected firm’s listed-CMIE-prowess package.
** Significant at 1% level; * Significant at 5% level.
From the standard deviation, it is found that the MPS for most of the firms is highly dispersed from the central tendency (mean) (standard deviation is high for majority of the firms under Consumer Cyclical sector). Out of 10 firms with play kurtic, the MPS data are found to be with kurtosis, which are approximately equal to 3 for Exide industries, Indian hotels, MRF and Tata Motors, which fact first reveals that the MPS data are approximately symmetric. The JB test statistics for MPS data is significant for Ashok Leyland (13.66 at 1% level) and insignificant for all the other nine firms. This led to accept the null hypothesis that the data are normally distributed for the MPS.As far as the DPS data are concerned, the JB test statistics, based on skewness and kurtosis, are insignificant for eight firms, however they are significant for two firms (Apollo tyres and MRF), which evidences the presence of normality in the DPS. For DPO, the JB test result is <critical value of at 5 % level for four firms and it is insignificant for six firms. For DY, the mean ranges from 0.07 for MRF to 2.96 for Ashok Leyland. The JB test result is < critical value of at 5% level for Eicher motors and is insignificant for the rest of the nine firms, which fact shows that the data are normally distributed. Therefore, it is inferred that the MPS, DPS, DPO, DY and EPS are normally distributed for the firms under Consumer Cyclical sector.
Unit Root Test
Table 4 - Unit Root Test (Panel) Results for Market Price per Share and Dividend Variables for firms under Consumer Cyclical Sector
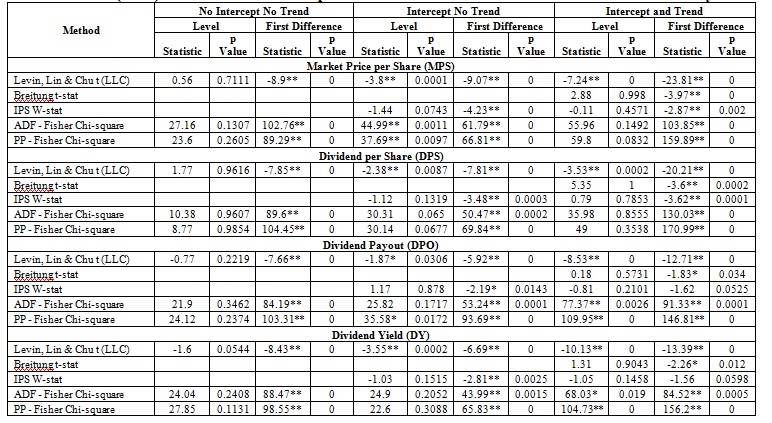
Note:Levin, Lin &Chu& Breitung t-stat - Null: Unit root (assumes common unit root process)
IPS (Im, Pesaran & Shin) W-stat, ADF - Fisher Chi-square & PP - Fisher Chi-square - Null: Unit root (assumes individual unit root process)
Source: Computed from the compiled & edited data from the financial statements of selected firm’s listed-CMIE-prowess package.
** Significant at 1% level;* Significant at 5% level.
Table 4 shows the panel unit root test result for MPS, DPS, DY and DPO of firms of under Consumer Cyclical sector. From the table it can be inferred that for both the MPS and the DPS data series, the unit root test statistics are significant at first difference based on models without deterministic trend (no intercept and no trend, with deterministic trend having only intercept and with intercept and trend). Though, IPS-W test is insignificant at levels and both the IPS-W test and the Breitung t-test are significant when first differenced, the MPS data series with drift process (with time trend) is considered to be stationary at first differenced because most of the test statistics are significant. Hence, it is found that the MPS data series are integrated of order 1, i.e. I(1) satisfying one precondition for co-integration test.
The unit root test statistics for DPO is significant at first differenced based on models without deterministic trend (no intercept and no trend, with deterministic trend having only intercept and with intercept and trend). Though, IPS-W test is insignificant at levels and both the IPS-W test and the Breitung t-test are significant when first differenced it is found that data are stationary at first differenced with intercept and no trend and also with intercept and trend, so it satisfies one precondition for co-integration test. The DY shows that the unit root test statistics is significant at first differenced based on models without deterministic trend (no intercept and no trend, and with intercept and trend so the data are co-integrated of order I (1)).
Lag Length Selection
The results of the analysis determining the lags for co-integration model between MPS and dividend variables viz., DPS, DPO and DY for Consumer Cyclical sector are shown in table 5. Based on the lag length shown by majority of the criterion, two lag is chosen for co-integration test between MPS and DPS. The chosen lag length for co-integration test is six between MPS and DPO and it is four between MPS and DY (the lag suggested by FPE and AIC is superior over LR test). Hence, the chosen lag length for co-integration test between MPS and DPS; MPS and DPO; and MPS and DY for Consumer cyclical sector is two, six and four respectively.
Table 5 - Lag Length Selection Criteria for Co-integration Test for Market Price per Share with Dividend Variables of Firms under Consumer Cyclical Sector
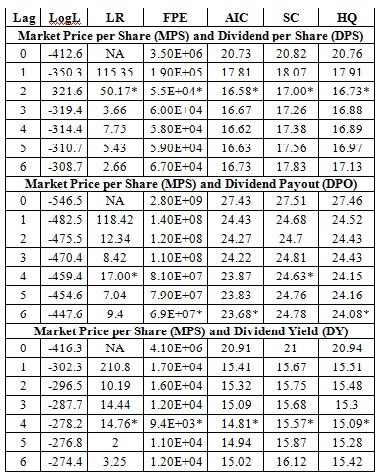
Source: Computed from the compiled & edited data from the financial statements of selected firms listed-CMIE-prowess package.
*Indicates lag order selected by the criterion
LR : sequential modified LR test statistic (each test at 5% level); FPE: Final prediction error; AIC: Akaike information criterion; SC : Schwarz information criterion; HQ : Hannan-Quinn information criterion
Co-integration Test
Table-6 - Co-integration Test Results for Market Price per Share and Dividend Variables of Firms under Consumer Cyclical Sector
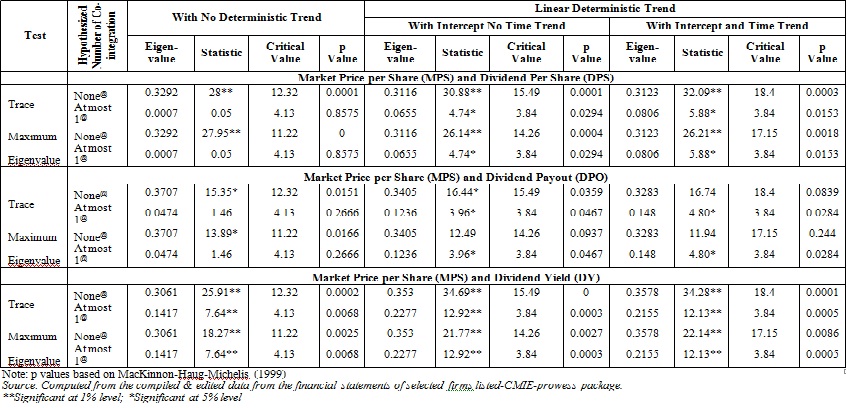
The results of co-integration analysis of Consumer Cyclical sector are shown in table 6.The table reveals that both the trace and the maximum eigen value test statistics are significant for CE with intercept but without time trend as well as CE with intercept and time trend hypothesized as ‘none’. This shows that the DPS and the MPS are co-integrated when the variables in the model are allowed for linear deterministic trend. This has further proved the existence of long-run relationship with time trend between DPS and MPS.
The results further show that the data series is co-integrated as both the trace test and the maximum eigen-value test reject the null hypothesis of no co-integration, and suggests that there are two significant co-integrating vectors in the model, which implies that there are two common stochastic trends indicating a degree of market integration. The DPS and the MPS have long-run relationship, which and is proved by trace rank test and maximum eigen value test without deterministic trend, with intercept without time trend as well as with intercept and time trend.
The results of trace test and maximum eigen value test without deterministic trend for DPS and MPS show the critical value as 12.32 and 11.22, statistical value as 28.00and 27.95 respectively; that of for with intercept and without time trend the critical value as15.49 and 14.26,statistical value as30.88and 26.14 respectively; and that of for with intercept and time trend the critical value as 18.40 and 17.15,statistical value as32.09 and26.21respectively,which are highly significant at 1% level.
The statistical values of the trace test and maximum eigen value test are >critical values for three situations i.e. without deterministic trend, with intercept without time trend as well as with intercept and time trend hence the null hypothesisH01: “there is no co-integration between dividend per share (DPS) and shareholders’ wealth (SW)” is rejected at 1% level. Therefore, the co-integration results prove that there exists a stationary, long-run relationship between DPS and MPS.
The results of trace test and maximum eigen value test without deterministic trend for DPO and MPS show the critical value as 12.32 and 11.22, statistical value as 15.35and 13.89 respectively; that of for with intercept and without time trend the critical value as15.49 and 14.26,statistical value as16.44and 3.96 respectively; and that of for with intercept and time trend the critical value as 18.40 and 17.15,statistical value as4.80 each respectively, which are highly significant at 5% level. The statistical values of the trace test and maximum eigen value are >critical values for three situations i.e. without deterministic trend, with intercept without time trend as well as with intercept and time trend hence the null hypothesisH02: “there is no co-integration between dividend payout (DPO) and shareholders’ wealth (SW)” is rejected at 5% level.
The DY and the MPS have long-run relationship proved by trace rank test and maximum eigen value test without deterministic trend, with intercept without time trend as well as with intercept and time trend. The results of trace test and maximum eigen value without deterministic trend for DY and MPS show the critical values as 12.32 and 11.22, statistical values as 25.91and 18.27 respectively; that of for with intercept and without time trend the critical valuesas15.49 and 14.26,statistical values as34.69and 21.77 respectively; and that of for with intercept and time trend the critical values as 18.40 and 17.15,statistical values as34.28 and 22.14 respectively, which are highly significant at 1% level.
The statistical values of the trace test and maximum eigen value test are >critical values for three situations i.e. without deterministic trend, with intercept without time trend as well as with intercept and time trend, hence the null hypothesisH03: “there is no co-integration between dividend yield (DY) and shareholders’ wealth (SW)” is rejected at 1% level. Therefore, the co-integration results prove that there exists a stationary, long-run relationship between DY and MPS.
Both the trace test and the maximum eigen value test statistics for the CEs without and with deterministic trend for MPS with DPS, DPO and DY are hypothesized as ‘none’ at level shows the presence of a long-run relationship between DP and SW(MPS and DPS; MPS and DPO; and MPS and DY).
10. Results and Discussion of Impact of DP on SW
Table 7 is reported with the results of regression for eliciting the impact of DP on SW. There are two regressions; first one with dividend variables (DPS, DPO and DY) besides the financial factors (P, LEV, OF, LQ, EPS, WF, AQ) and the second one is with financial factors (P, LEV, OF, LQ, EPS, WF, AQ) only.
The significance of the explanatory power of DP on SW, when all the financial factors are held constant, is found based on F value obtained from comparing R2 values of the two models using the following formula:
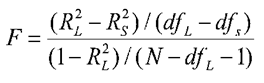
Where,
R2L = R2 from the larger model (full model)
R2S = R2 from the smaller model (subset model after removing certain predictors)
dfL = Row degrees of freedom (or number of predictors) in the larger model
dfS = Row degrees of freedom in the smaller model
N = Number of observations
Table7 Impact of Dividend Policy (after Partialling out the Effect of Financial Performance) on Shareholders’ Wealth of Consumer Cyclical Sector
|
Consumer Cyclic Sector
|
|
Estimators
|
Full Model with Dividend Variables
|
Subset Model after Removing Dividend Variables
|
|
Beta (β)
|
t-value
|
Beta (β)
|
t-value
|
|
Intercept
|
5.322**
|
17.12
|
5.964**
|
11.37
|
|
Profitability (P)
|
0.004
|
0.01
|
0.084
|
0.14
|
|
Leverage (LEV)
|
-0.319
|
-1.42
|
-0.412
|
-0.99
|
|
Owners Fund (OF)
|
0.53
|
1.82
|
0.439
|
0.88
|
|
Liquidity (LQ)
|
0.08
|
0.33
|
-0.412
|
-0.91
|
|
Earning per Share (EPS)
|
0.158*
|
2.26
|
0.374**
|
3.19
|
|
Working Fund (WF)
|
-0.02
|
-0.14
|
0.443
|
1.74
|
|
Asset Quality (AQ)
|
0.067
|
0.73
|
0.187
|
1.17
|
|
Dividend policy (DPS)
|
0.731**
|
7.7
|
|
|
|
R2
|
0.8647
|
0.5162
|
|
Adjusted R2
|
0.8495
|
0.4794
|
|
F Value
|
56.90**
|
14.02**
|
|
Degrees of Freedom
|
10..89
|
7..92
|
|
Significance of the Change in R2
|
F Value
|
DF
|
|
76.41**
|
3..89
|
Source: Computed result from the compiled & edited data from the financial statements of selected firms listed-CMIE-prowess package.
**Significant at 1% level;*Significant at 5% level.
As per table7, both the full and the subset models of regressions are fitted significantly. From the observation of the individual coefficients in both the models, it is seen that the SW tend to increase with increase in EPS. Regarding the DP, it is seen that the SW seems to increase at significant level when there has been a significant increase in the DPS (β = 0.731, t =7.70, p < 0.01). While the full model, with both the dividend and the financial factors as predictors, has the power of explanation to the extent of 86.47 per cent of the variation; the subset model, with only financial factors as predictors, explain only to the extent of 51.62 % of the variation in the SW.
The additional variance in the dependent variable (SW) explained by the dividend variables is 37.01 per cent (R2L – R2S). Further, the additional variance in presence of dividend variables is highly significant at 1% level (F value = 76.41, p < 0.01). Therefore, it is found that the DP (DPS), as an explanatory variable, has unique influence (impact) in creating additional wealth to the shareholders of firms. Therefore, H04: “there is no significant impact of dividend policy (DP) on shareholders’ wealth (SW)” is rejected at 1% level.
12. Difference in the Impact of DP on SW between Pre and Post Financial Meltdown Periods
To test whether there is any significant difference in the impact of DP on SW between pre and post financial meltdown periods, Chow test has been used and the results are shown in table 8.By applying Chow test, an attempt has been made to estimate whether there has been any significant difference in the impact of DP on SW between pre and post financial meltdown periods using the following formula:
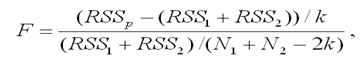
This is distributed as F with k and n1 + n2 – 2k degrees of freedom
Where, F is the test statistic
RSS p = residual sum of squares for the whole sample
RSS1 = residual sum of squares for the first group (before financial meltdown)
RSS2 = residual sum of squares for the second group (after financial meltdown)
N = number of observations
K = number of regressors (including the intercept term) in each unrestricted sub-sample
2K = number of regressors in both the unrestricted sub-sample regressions (whole sample)
N1 = number of observations for before financial meltdown period
N2 = number of observations for after financial meltdown period
Difference in the Impact of DP on SW in Pre and Post-Financial meltdown Periods for Consumer Cyclical Sector
The results of the chow test (vide table 8) reveals that the F value for DPS (1.09) and DPO (2.15) are not significant and are higher than the 5% level. This shows that there is no significant difference in the impact of DP (DPS and DPO) on SW (MPS) between pre and post financial meltdown periods, i.e. the impact of DP (DPS and DPO) on SW is unaffected by the financial meltdown. Hence, H05:“there is no significant difference in the impact of dividend per share(DPS) on shareholders’ wealth (SW) between pre and post-financial meltdown periods” andH06:“there is no significant difference in the impact of dividend payout(DPO) on shareholders’ wealth (SW) between pre and post-financial meltdown periods” are accepted.
Table 8 - Results of Chow Test for the difference in the Impact of DP on SW between Pre and Post Financial Meltdown Periods for Consumer Cyclical Sector
|
Variables
|
Pooled Regression
|
Regression for Pre Period 2003–07
|
Regression for Post Period 2009-13
|
|
(2003-07, 2009-13)
|
|
Beta (β)
|
t-value
|
Beta (β)
|
t- value
|
Beta (β)
|
t-value
|
|
MPS = f (DPS, DPS_1)
|
|
Intercept
|
-900.38**
|
-3.06
|
-392.04*
|
-2.05
|
-1229.29**
|
-2.6
|
|
DPS
|
422.93
|
1.59
|
0.32
|
0
|
594.62
|
1.56
|
|
DPS_1
|
1070.52**
|
3.94
|
1199.12**
|
4.6
|
1062.70**
|
2.8
|
|
R2
|
0.4488
|
|
0.6575
|
|
0.4369
|
|
|
Adjusted R2
|
0.4345
|
|
0.6321
|
|
0.4129
|
|
|
F Value
|
31.35**
|
|
25.92**
|
|
18.23**
|
|
|
DF
|
2..77
|
|
2..27
|
|
2..47
|
|
|
CHOW Test
|
F Value
|
DF
|
p Value
|
|
1.09NS
|
3..74
|
0.3748
|
|
MPS = f (DPO, DPO_1)
|
|
Intercept
|
1450.20**
|
6.04
|
887.18**
|
4.76
|
1873.49**
|
4.98
|
|
DPO
|
-21.19
|
-1.47
|
-20.34
|
-0.92
|
-25.89
|
-1.4
|
|
DPO_1
|
-11.7
|
-0.76
|
2.13
|
0.07
|
-15.92
|
-0.84
|
|
R2
|
0.1031
|
|
0.0883
|
|
0.1433
|
|
|
Adjusted R2
|
0.0798
|
|
0.0208
|
|
0.1068
|
|
|
F Value
|
4.42*
|
|
1.31NS
|
|
3.93*
|
|
|
DF
|
2..77
|
|
2..27
|
|
2..47
|
|
|
CHOW Test
|
F Value
|
DF
|
p Value
|
|
2.15NS
|
74
|
0.069
|
|
MPS = f (DY, DY_1)
|
|
Intercept
|
1424.92**
|
6
|
866.65**
|
4.86
|
1884.07**
|
5.01
|
|
DY
|
-494.72
|
-1.11
|
-230.31
|
-0.91
|
-1265.05
|
-1.14
|
|
DY_1
|
-94.47
|
-0.21
|
-37.17
|
-0.12
|
395.54
|
0.38
|
|
R2
|
0.0986
|
|
0.0849
|
|
0.1468
|
|
|
Adjusted R2
|
0.0852
|
|
0.0172
|
|
0.1105
|
|
|
F Value
|
4.21*
|
|
1.25 NS
|
|
4.04*
|
|
|
DF
|
2..77
|
|
2..27
|
|
2..47
|
|
|
CHOW Test
|
F Value
|
DF
|
p Value
|
|
2.48*
|
74
|
0.0393
|
However, the F value of DY (2.48) is significant at 5% level. Hence, H07:“there is no significant difference in the impact of dividend yield (DY) on shareholders’ wealth (SW) between pre and post financial meltdown periods” is rejected at 5% level i.e. the impact of DY on SW is affected by the financial meltdown. Hence, it is concluded that the impact of DP on SW is significantly affected by the financial meltdown event only for the variable DY and not for the variables DPS and DPO.
13. Concluding Remarks
The study attempts to answer the question: Is there any significant difference in the impact of DP on SW due to financial meltdown particularly the consumer cyclical sector. The main objective of the study is to shed light on the stated question. To test the relationship between DP and SW, and to estimate the impact of DP on SW before and after financial melt down periods,10 firms from Consumer Cyclical Sector are considered with one pre condition that the firms should have consistent track record in paying dividend over the period. The response variable viz., market price per share (MPS) is considered as proxy for SW and the dividend variables viz., DPS, DPO, and DY are considered as proxies of predictor variable (DP). The study used Johansen co-integration, factor analysis, regression and chow test to study the impact of DP on SW.
The overall result of the study reveals that the trace test and maximum eigen value test statistics for the CEs without and with deterministic trend for MPS with DPS, DPO and DY hypothesized as ‘at most 1’ are not significant at level, hence it leads to accept null hypothesis that there is at most one co-integration equation for MPS with each one of the dividend variables, implying that the MPS and dividend variables are co-integrated. So, there is a long-run relationship between DP and SW of the selected firms.
The finding of the study (the long-run relationship between DP and SW) corroborates with the findings of the previous research studies viz., Chidinma et al. (2013), Dewet and Mpinda (2013), Haque Collins et al. (2013), Mokaya et al. (2013), Oladele (2013), Salman (2013),Kumaresan (2014) and Toby (2014).
The financial factors viz., profitability (P), leverage (LEV), owners’ fund (OF), liquidity (LQ), working fund (WF), asset quality (AQ) and dividend variables viz., earnings per share (EPS), market price per share (MPS), and dividend per share (DPS),which are used to estimate the impact of DP on SW show that the DP has influence (impact) in creating additional wealth to the shareholders of the selected firms.
The overall conclusion of the analysis of the impact of DP on SW corroborates with the findings of the previous research studies viz., Arindam and Samanta (2012), Atiyet (2012), Gul Collins et al. (2012), Zafar et al. (2012), Onwumere et al. (2012), Altroudi and Milhem (2013), and Bawa and Kaur (2013).
The study proves that there is a significant difference in the impact of DY (DY as a proxy of DP) on MPS (MPS as a proxy of SW), hence it can be concluded that the impact of DP on SW of firms of Consumer Cyclical sector in India is significantly affected by the financial meltdown event.
14. Limitations and Scope for Further Studies
The study is based on secondary data collected from the Centre for Monitoring Indian Economy Private Limited (Prowess CMIE). Therefore, the quality of the study depends upon the accuracy, reliability, and quality of secondary data source. The analysis has produced some meaningful inferences and results, and one avenue for future research is to extend the investigation to the other sectors and across sectors.
The present study has used market price per share (MPS) as a proxy for measuring the shareholders’ wealth (SW). Further studies may be conducted using the response variable viz., Economic value added (EVA) and Market value added (MVA) to measure the SW.
The study has used research tools like Johansen co-integration test, multiple regressions and Chow test for analyzing the co-integration between DP and SW. Therefore, inclusion of some more appropriate methods of analysis viz., Block Exogeneity Wald test (1943), Bai-Perron test (2003) and Variance decomposition for analysis may add to exploring new and further inference in the area of research.
References
Ajanthan, A. 2013. The relationship between dividend payout and firm profitability: A study of listed hotels and restaurants in Sri Lanka. International Journal of Scientific and Research Publications 3(6): 1-6.
Altroudi, W., and M. Milhem. 2013. Cash dividends, retained earnings and stock prices: Evidence from Jordan. Interdisciplinary Journal of Contemporary Research in Business 4(12): 589-99.
Arindam, D., and A. Samanta. 2012. Dividend policy and its effect on shareholders’ wealth: A study on Indian banking sector. South Asian Journal of Marketing and Management Research 2(8): 211-22.
Ashvin, S. 2012. An empirical study of corporate dividend policy: A study with reference to selected auto sector. Advances in Management 5(8): 38-46.
Atiyet, B. 2012. The impact of financing decision on the shareholder’ value creation. Journal of Business Studies 4(1): 44-63.
Azhagaiah, R., and N. Sabaripriya. 2008. The impact of dividend policy on shareholders’ wealth. International Research Journal of Finance and Economics 20: 180-7.
Bai, J., and P. Perron. 2003. Computation and analysis of multiple structural change models. Journal of Applied Econometrics 18: 01-22.
Baker, H. K., S. Saadi, S. Dutta and D. Gandhi. 2007. The perception of dividends by Canadian managers: New survey evidence. International Journal of Managerial Finance 3(1): 70-91.
Bawa, S. K., and P. Kaur. 2013. Impact of dividend policy on shareholders’ wealth: An empirical analysis of Indian information technology sector. Asia Pacific Finance and Accounting Review 1(3): 17-24.
Breitung, J. 2000.The local power of some unit root tests for panel data.Advances in Econometrics 15:161-78.
Chidinma, O., S. C. Okaro and V. C. Pius. 2013. Shareholders value and firms dividend policy: Evidence from public firms in Nigeria. Research Journal of Management Science 2(12): 26-8.
Chow, G. C. 1960. Tests of equality between sets of coefficients in two linear regressions.Econometrica 28 (3): 591-605.
Devaki, S., and D. Kamalaveni. 2012. Shareholding patterns and dividend payout: An empirical analysis in Indian corporate hotels. International Journal of Multidisciplinary Research 2(1): 49-63.
Dewet, J., and M. Mpinda. 2013. The impact of dividend payments on shareholders’ wealth: Evidence from vector correction model. International Business and Economics Research Journal 12(11): 1451-65.
Ganesh, R. M., A. Somu, and V. Mathivathani. 2013. A comparative study on wealth maximization in selected automobile industry. International Journal of Scientific Research 2(2): 161-5.
Gul, S., M. Sajid, N. Razzaq, M. Iqbal and M. Bila khan. 2012. The relationship between dividend policy and shareholders’ wealth. Economic and Finance Review 2(2): 55-9.
Haque, R., J. A. Siddikee, S. Hossain, S. P. Chowdhury and M. Rahman. 2013. Relationship between dividend payout and economic value added: A case of square pharmaceuticals limited. International Journal of Innovation and Applied Studies 3(1): 98-104.
Im, K. S., M. H. Pesaran and Y. Shin. 2003. Testing for unit root in heterogenous panels. Journal of Econometrics 115: 53-74.
Iqbal, Z., M. A. Waseem and M. Asad. 2014. Impact of dividend policy on shareholders’ wealth: A study of selected manufacturing industries of Pakistan. International Journal of Innovation and Applied Studies 6(2): 210-5.
Johansen, S., and K. Juselius. 1990. Maximum likelihood estimation and inferences on co - integration with applications to the demand for money. Oxford Bulletin of Economics and Statistics 52(2):169-210.
Kumaresan, S. 2014. Impact of dividend policy on shareholders’ wealth: A study of listed firms in hotels and travels sector of Sri Lanka. International Journal of Technological Exploration and Learning 3(1): 349-52.
Levin, A., C. F. Lin and C. S. Chu. 2002. Unit root tests in panel data: Asymptotic and finite sample properties. Journal of Econometrics 108: 01-24.
Mokaya, S. O., D. M. Nyangara and L. T. James. 2013. The effect of dividend policy on market share value in the banking industry: Case of National Bank of Kenya. International Journal of Arts and Commerce 2(2): 91-100.
Oladele, K. O. 2013. The determinants of value creation in the Nigerian Banking Industry: Panel evidence. International Journal of Business and Social Science 4(3): 89-101.
Onwumere, J., G. Ibe and O. Frank. 2012. Does the use of outsiders’ fund enhance shareholders’ wealth: Evidence from Nigeria.Journal of Finance and Investment Analysis 1(1): 173-97.
Osterwald-Lenum, M. 1992.A note with quintiles of the asymptotic distribution of the maximum likelihood co-integration rank test statistic.Oxford Bulletin of Economics and Statistics 54(3): 461-72.
Phillips,P.C.B., and P. Perron. 1988. Testing for unit roots in time series regression. Biometrika 75: 335-46.
Priya, K., and B. Nimalathasan. 2013. Dividend policy ratios and firm performance: A case study of selected hotels and restaurants in Sri Lanka. Global Journal of Commerce and Management Perspective 2(6): 16-22.
Salman, M. 2013. Effect of dividend policy on shareholders’ wealth: A study of sugar industry in Pakistan. Global Journal of Management and Business Research Finance 13(7): 47-54.
Toby, A. J. 2014.Empirical test of the dividend policy irrelevance hypothesis in the Nigerian context.Research Journal of Finance and Accounting 5(6): 167-74.
Vijayakumar, A. 2011. Economic value added and shareholders’ wealth creation: A factor analytic approach. Research Journal of Finance and Accounting 2(12): 22-37.
Wald, A. 1943.Tests of statistical hypotheses concerning several parameters when the number of observations is large.Transactions of the American Mathematical Society 54: 426-82.
Zafar, T. S. M., D. S. Chaubey and S. M. Khalid. 2012. A study on dividend policy and its impact on shareholders’ wealth in selected banking companies in India. International Journal of Financial Management 2(3): 79-94.

