A Refereed Monthly International Journal of Management
Evaluation of the Factors Influencing the Performance Appraisal System with Reference to Agriculture Research Sector, Hyderabad – A Multinomial Logistic Regression Approach
AUTHORS
|
K.D.V. Prasad 1*
Faculty of Commerce, Rashtrasant Tukdoji Maharaj Nagpur University, Nagpur
|
Rajesh Vaidya2
Associate Professor, Dept of Management and Technology, Shree Ramdeobaba College of Engineering and Management, Nagpur
|
K. Srinivas3
Senior Scientific Officer, ICRISAT Asia Program, Patancheru
|
V Anil Kumar 4
Visiting Scientist, Biometrics, ICRISAT, patancheru
|
ABSTRACT
In this research study we reported the results on the factors influencing the performance appraisal system using multinomial logistic regression analysis with reference to Agriculture Research Sector employees in Hyderabad Metro, India. The data collected from one of the critical factor of HR practices under Performance Management System – the performance appraisal forms of 400 employees working in the agriculture sector consisting of from 300 men and 100 women employees. The seven independent factors Job knowledge, Skill level, Job execution, Initiative, Client orientation, Team work, Compliance to policies and practices one dependent factor outcome of the Performance Appraisal System (PAS) the Rating were measured. The descriptive analysis and multinomial logistic regression analysis carried out to arrive at the conclusions. To measure the reliability of the scale used for this study, and internal consistencies of the instrument – performance appraisal form, the reliability statistics Cronbach’s alpha (C-Alpha) and Split-half reliability estimated. The overall C-Alpha value is 0.89, and the C-Alpha values for all the factors ranged 0.83 to 0.88, whereas overall Spearman Brown Split-half measured at 0.84. The multinomial logistic regression analysis was performed to estimate the likelyhood odds ratios (ORs) to explain the factors associated outcome of the performance appraisal system Rating, a dependent variable.It can be observed from the relative log odds ratios significant negative influence of independent variables, Job Knowledge (OR, 0.404, 95% 0.168-0.972) Job skill (OR 0.126, 95% CI 0.053-0.296), Job execution (OR 0.105. 95% CI 0.039-0.280), Initiative (OR 0.307, 95% CI 0.134-0.705), Team Work (OR 0.284, 95% CI 0.129-0.624), and Compliance to Policies and Practices (OR 0.260, 95% CI 0.117) for dependent variable Rating Excellent and Job knowledge (OR 0.320, 95% CI 0.113-0.907), Job skill (OR 0.066, 95% CI 0.024-0.178), Job Execution (OR 0.036, 95% CI 0.012-0.111), Initiative (OR 0.170, 95% CI 0.064, -0.453), Team work (OR 0.142, 95% CI 0.057-0.356), Compliance to policies (OR 0.083, 95% CI 0.032-0.215) for Rating Good verses Outstanding as reference variable.
Introduction
Performance appraisal (PA) is a formal system of review and evaluation of an individual or team task performance and in actuality, managers should be reviewing an individual’s performance on a continuing basis. The Performance Appraisal System (PAS) – a development tool used to measure the actual performance in an organization and the strategic goals of the organization are aligned to that of individual performance. Using Performance Appraisal System an employee’s performance is measured against core competencies such as Job knowledge, Skill level, Job execution, Initiative, Client orientation, Cooperation and ability work effectively, Quality and quantity of output, Leadership qualities, and Compliance to policies and practices including safety and environment, Efficient handling of available resources, Intuitiveness to take new assignments and learn new things, etc. However the core competencies will vary from organization to organizations depending on its objectives, business strategies, and mission.
The performance management is an extensive, methodical, sequential and continuous process that involves performance mapping processes and sequences (Garvin 1998). Performance measurement is the process an organization follows to objectively measure how well its stated objectives/mission or goals are being met. In general this involves phases like, articulating and arriving at an agreement on objectives, selecting performance indicators and setting goals/challenges, observing performance, and analyzing those results againsta set of goals that were formulated in the organization. In reality, results are often measured without a clear definition of clear goals or objectives. Greater attention is needed on what important factors need to be measured and in due course performance appraisal systems mature, more consideration will be given to align the PAS with the organizations objectives/goals. Organizations that emphasize accountability tend to use performance targets, but too much emphasis on "hard" targets can potentially have dysfunctional consequences. In general most of the organizations include the performance appraisal system under Performance Management system on yearly basis, where supervisor/subordinate interview with a standard performance appraisal form with the factors to be appraised or listed in the form (Dargam 2009). The performance management provides more opportunities for individuals to discuss their work with their managers in an attractive atmosphere (Armstrong, 1991). Performance Appraisal system is a continuous process and a natural aspect of management and assess performance by reference to agreed objectives. Performance management gives direction to the employees through guidance from management (Medlin 2013). Managing organisations is about managing performance of people who work in organisations. The human resources managers believe that PAS is a good tool for performance improvement Longenecker and Goff (1992), if well designed and implemented it can benefit both the employees and the organizations (Coens and Jenkins, 2000). DeNisis and Pritchard (2006) aver that attitudes toward performance management affect the performance of employees in organisations.
\
Importance of Performance Appraisal in Agricultural Research Sector
The main objective of PAS in Agricultural Research Center is to improve employee and increase the potential of a researcher inperformance. Though the PAS can cause some dissatisfaction over how the employee as appraised, still it can help to achieve organization’s vision and mission. PAS one of the human resources valuable functional area which is helpful in correcting the deviations/errors in employee performance.
At the Agricultural Research Sector PAS being effectively used for Human Resource Planning In assessing a list of staff to be promoted, to identify the underperformed employees who need a corrective action. PAS also a useful tool for succession planning and provides a profile for the agricultural research sector organizations strengths and weakness. The PAS evaluations ratings will be used for Recruitment and Selection at the next level. The ratings will provide a benchmarks for evaluating internal applicant responses obtained through interviews. The PAS will be used to identify the Training and Development needs of the sector by identifying the employee deficiencies in those core competencies that effect the outcome of the performance. The PAS system is helpful for career planning, compensation program, succession planning and human resources development.
Review of Literature
Performance appraisal is an unpleasant management practice. With so much controversy in it, appraisal is continually used in the public sector around the world as an instrument to oversee the performance of its personnel (Vallance, 1999). Researchers suggested to have an effective human resource system for organizations the use of an appraisal system which is reliable and accurate for employee assessment and organisational development (Armstrong, 2003; Bohlander &Snell, 2004; Desler, 2008).
George Ndemo Ochoti et al. (2012) studied the Factors Influencing Employee Performance Appraisal System: A Case of the Ministry of State for Provincial Administration & Internal Security, Kenya. Performance Appraisal system is a good tool for human resource management and performance improvement (Longenecker and Goff, 1992). Involving the employees to understand organizational goals, what is expected of them and what they will expect for achieving their performance goal will help in organizational development (Bertone et al. 1998). PAS should also link individual performance with reward management (Townley, 1999). Linking performance with reward increases the levels of performances and should be used in both public and private sectors (Armstrong & Brown, 2005).
Feedback is an important factor of PAS and the rates should be given feedback on their competence and overall progress (Longenecker 1997). The 360 degree feedback method can be utilized by organizations as this method combines evaluations from various sources into over all appraisal (Garavan et al. 1997). Performance ratings are based on rater evaluations which are subject to human judgements and biasedness. Personal factors and prejudices are like to influence ratings (Cleveland and Murphy, 1992). The interpersonal factors are important to the PAS as they influence the outcome of the interactions (Greenberg (1993). The employee attitude toward the system is strongly linked to satisfaction with the system. The perceptions of fairness of the system are an important aspect that contributes to its effectiveness (Boswell and Boudreau, 2000). Understanding the employee’s attitude and behaviour about the PAS in organizations is important as they are key to determine the effectiveness (McDawall & Fletcher, 2004). Zakaria et al. (2012) reported that (HRM practices can develop the performance of an organisation by contributing to employee satisfaction. The performance appraisal is arguably one of the more critical factor in terms of organisation performance and appears to be an indispensable part of any HRM system when compared among the HR practices studied(Shrivastava &Purang, 2011).
Yee and Chen 2009 applied fuzzy set theory in the multi-criteria performance appraisal system and developed a performance appraisal system utilizing the performance appraisal criteria from an Information and Communication Technology based company in Malaysia. This system uses multifactorial evaluation model in assisting high-level management and following a systemic approach for assessing the employee performance.
Logistic Regression
The natural logarithm logit of an odds ratio is the main mathematical concept that underlies logistic regression. The logistic regression used for testing hypothesis about a relationship between categorical outcome variable and one more categorical or continuous predictor variables (Peng et al. 2002). In linear and multiple regression models sometimes the ordinary scatterplots are curved at the end with S-Shape and is difficult to interpret because the extremes do not follow the linear trend and errors are neither normally distributed nor constant across entire range of data (Peng, Manz, & Keck, 2001). A researcher can overcome this problem from logistic regression applying logit transformation to the dependent variable. In the essence logistic model predicts the logit, the natural algorithm of response variable (dependent) over continuous variable (independent). The simple form of logistic regression adopted from (Peng et al. 2002) is:
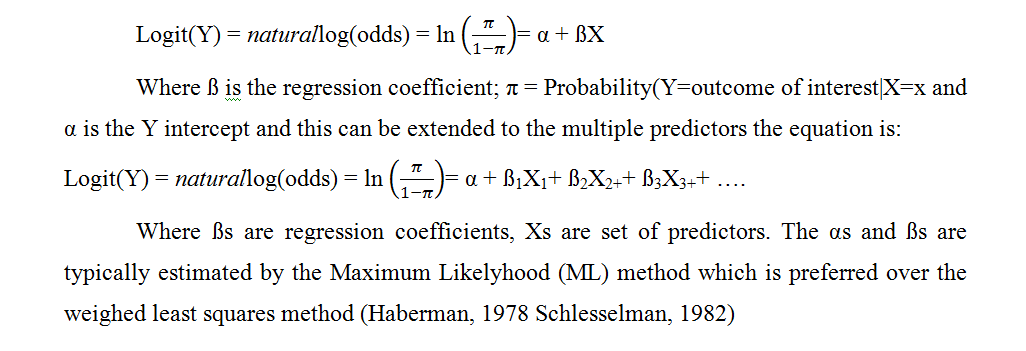
Multinomial Logistic Regression: The multinomial logistic regression is an extension of simple logistic regression that generalized to multi class problems such as with more than two possible discrete outcomes. Using this model one can predict the probabilities of the different possible outcomes of a categorically distributed dependent variable or response variable and a set of independent variables which may be continuous, binary or categorical. Using multinomial regression the dependent variable in question is a nominal where more there are more than two categories (Suryanwanshi et al. 2015). The nominal outcome variables using multinomial logistic regression are modelled in which the log odds of the outcomes are modelled as linear combination of the predictor variables (Suryanwanshi et al. 2015). Sudhir Chandra Das (2016) in his study reported the results on predictors of work-family conflict and employee engagement among employees in Indian Insurance Companies applying multinomial logistic regression analysis. Several researchers (Suryavanshi et al. 2015; Sateeshkumar and Madhu, 2012; Stephen, 2014; Masoud Lotfizadeh 2014) reported their results on occupation stress and associated factors using multinomial logistic regression. However the authors not come across any literature using multinomial regression in PAS and attempted to use multinomial logistic regression method for evaluating the factors of PAS using agricultural sector data.
Objectives of the study
The objective of the study is to present the main factors influence the PAS system in the agriculture sector institute employees;
- To identify the factors that influence PAS at the workplace of Agriculture sector institutes
- To identify whether there are any significant mean differences in the above said factors in influencing the PAS
Research question
- Does Performance Appraisal System process influence the organizational performance and effectiveness
- Does the seven independent factors Job knowledge, Skill level, Job execution, Initiative, Client Orientation, Team Work, Compliance to Policies and Practices one dependent factor outcome of the PAS Ratinginfluence the PAS?
Hypotheses
Based on the identified problem, research question and the objectives the following hypotheses were formed:
H0: There are no significant differences among factors that influence the PAS
HA: There are significant differences among the factors that influence the PAS
Research Methodology
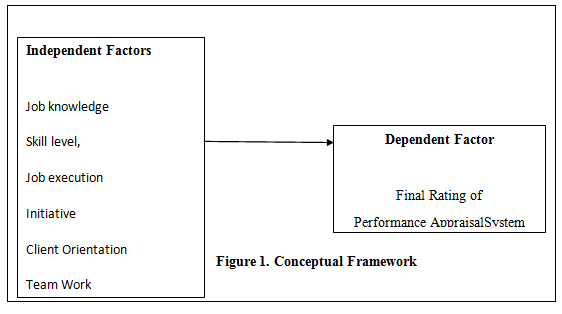
Conceptual Framework: The proposed framework was adopted based on the past research by George Ndemo Ochoti et. al. (2012). The factors under the study have been represented diagrammatically to show the relationship between independent factors and dependent factors (Figure 1).
Data Collection
Sample Size: A sample size of 400 employees selected and the demography of sample indicated the following tables.
|
Demography of Sample
|
|
Gender
|
Frequency
|
Percent
|
|
Men
|
300
|
75
|
|
Women
|
100
|
25
|
|
Total
|
400
|
100
|
|
Source: Primary data
|
|
Sample Description
|
|
Age Group
|
No of respondents
|
|
20-29
|
100
|
|
30-34
|
120
|
|
35-39
|
88
|
|
>40
|
92
|
|
Source: Primary data
|
Research Instrument: The research instrument used for the survey is a standardized, structured undisguised performance appraisal form —a main source for the primary data collection. Secondary data was collected from various published books, websites and records pertaining to the topic. The form was divided into 2 sections. In the Section I, background information/personal such as employee name, designation, institute/organization, program, date of joining and other details of the employee were readily available (pre-filled). The Section II of the form, the appraisal section where seven core competencies – the factors Job knowledge, Skill level, Job execution, Initiative, Client Orientation, Team Work, Compliance to Policies and Practices one dependent factor outcome of the Performance Appraisal System (PAS) the Rating was used to find out the PAS performance levels of the employees and impact of the PAS. This part contains 45 factors related to seven independent factors and one dependant factor effecting the PAS, as described earlier. The data was keyed from in Excel Sheet and the factors related to PAS was presented in (Table -). The researcher has identified 45 factors that affect PAS system of employees. The factor analysis was used to reduce the factors to 8 factors with the help of SPSS Version 24 (Table-1).
|
Table 1: Independent factors and causing effect on Performance Management System
|
|
Factor
|
Description
|
Factors
|
|
1
|
Job knowledge
|
5 factors such as duties, responsibilities, understanding of job, requirements, phases of work
|
|
2
|
Skill level
|
5 factors skill to perform the assigned job, acumen, basic knowledge, new ideas, computers, etc
|
|
3
|
Job execution
|
5 factors executes the job with perfection, use of resources, effective use of time, handling of unusual situation, etc
|
|
4
|
Initiative
|
5 factors develops new avenues skills, works independently with minimum supervision, demonstrates interest, follows instructions.
|
|
5
|
Client Orientation
|
5 Handling of colleagues, understands the instruction well, implementation of project, etc
|
|
6
|
Cooperation and ability work in teams
|
5 factors, can work with the team, rapport with co-workers, inter personal relations, behaviour with colleagues
|
|
7
|
Compliance to policies and practices
|
5 factors understanding of internal procedures, practices, responsibilities, loyalty etc,
|
|
8
|
Overall Rating
|
10 Overall performance: leadership, communication skills, execution of job, effective use of available resources, wastage management, time management, reporting etc.
|
Data Analysis: In our empirical investigation we have applied statistical techniques to analyse the data for drawing inductive inferences from our research data. To ensure the data integrity the authors have carried out necessary and appropriate analysis using relevant methods on our findings. The descriptive statistics are used to summarise the data, and to investigate the survey questionnaire, formulating the hypotheses and the inferential statistics were employed. To measure the central tendency such as means, variance and standard deviation, we used the dispersion methods.
Reliability methods: To measure the internal consistency, reliability of our research instrument, the survey questionnaire, and to maintain similar and consistent results for different items with the same research instrument, we used the reliability methods Cronbach’s alpha. The Cronbach alpha is an index of reliability that may be thought of as the mean of all possible split-half co-efficient corrected by Spearman-Brown formula (Cronbach, 1951) and subsequently elaborated by others (Novic & Lews, 1967; Kaiser & Michael, 1975). The estimated values of the Cronbach’s alpha are indicated in Table-2. The Statistical Package for Social Sciences (SPSS ver. 24) was used to measure the central tendency, measures of variability, reliability statistics, and to predict the dependent factor PAS based on independent factors the multinomial logistic regression analysis carried out (IBM SPSS Statistics, 2016).
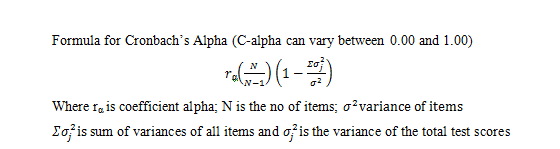
Reliability test of the Questionnaire: The outcome of the PAS Rating was measured using a Likert-type scale with items 1-5 was used (where 1=Unsatisfactory, 2=Satisfactory, 3=Good, 4=Excellent and 5 =Outstanding) in this study. The reliability statistic Cronbach’s alpha coefficient value (C-alpha) was calculated to test the internal consistency of the instrument (appraisal form in this study), by determining how all items in the instrument related to the total instrument (Gay, Mills, & Airasian, 2006). This instrument was tested with the data of 50 employees and using SPSS the Cronbach alpha static was measured at 0.78, suggesting a strong internal consistency. Three months later, keying data for all the 400 employees the overall C-alpha measured at 0.89 and it ranged from .0.80 to 0.88 for the 7 independent and 1 dependent factors (Table-2).
|
Table 2.Cronbach’s alpha values for factors used in this study
|
|
Sl. No
|
Factor
|
Cronbach’s alpha
|
|
|
Overall
|
0.89
|
|
1
|
Job knowledge
|
0.87
|
|
2
|
Skill level
|
0.85
|
|
3
|
Job Execution
|
0.86
|
|
4
|
Initiative
|
0.80
|
|
5
|
Client Orientation
|
0.85
|
|
6
|
Cooperation and ability to
work in teams
|
0.86
|
|
7
|
Compliance to policies and
practices including safety
and environment
|
0.88
|
|
8
|
Final Rating
|
0.87
|
The second reliability method Split-half reliability in which scores from the two halves of a test (e.g. even items versus odd items) are correlated with one another and the correlation is then adjusted for test length. The Spearman-Brown’s formula is employed enabling correlation as if each part were full length the value is measured 0.84 using formula and the Spearman Brown Prophecy was measured at 0.91
R = (2rhh)/(1+rhh) where rhh is the correlation between two halves.
The calculated Mean, Standard Deviation and Standard Error Values for men and women, for the primary data collected from the respondents (n=300, men and n=100, women) are presented in the Table-3. The estimate overall SE of 0.04 is relatively small, indicating that the means are relatively close to the true mean of the overall population.
|
Table 3. Mean, Standard Deviation and Standard Error of Mean of the primary data of independent and dependent factors
|
|
Sl. No
|
Factor
|
Mean
|
SD
|
SE
|
|
1
|
Job knowledge
|
4.00
|
0.79
|
0.040
|
|
2
|
Skill level
|
3.94
|
0.82
|
0.041
|
|
3
|
Job Execution
|
4.08
|
0.80
|
0.041
|
|
4
|
Initiative
|
3.81
|
0.85
|
0.043
|
|
5
|
Client Orientation
|
3.79
|
0.83
|
0.042
|
|
6
|
Cooperation and ability to
work in teams
|
4.04
|
0.80
|
0.040
|
|
7
|
Compliance to policies and
practices including safety
and environment
|
3.98
|
0.76
|
0.0.8
|
|
8
|
Final Rating
|
3.93
|
0.78
|
0.040
|
|
|
Overall
|
3.94
|
0.80
|
0.040
|
The Results of Multinomial Regression Analysis
In our study the categorical variable (termed as Response variable in SPSS, this is a dependent variable) is Rating and Gender is (Termed as Factor in SPSS) and seven independent variables as said above (Termed as Covariates in SPSS package can be continuous or categorical). To test the effectiveness of the model – how independent factors effecting the outcome of the response factor (Rating) we have evaluated our results on a) overall effectiveness of model, b) statistical tests of individual predictors, c) Goodness-of-fit statistics and validation of predicted probabilities.
Overall model evaluation: The model we have used is an improved model when compared with the intercept only model (null model with no predictors). The Table-4 shows the significance of the log likelihood of 7 independent variables. The log likelihood with no independent variables with only intercept with value (829.69) and the final model log likelihood values (354.770), and with the values of likelihood ratio score, Wald Statistic make model more significant and improved over the null model. Further the significance level of the test is less than 0.05, we can conclude that the Final mode is outperforming the Null.
|
Table 4. Model Fitting Information
|
|
Model
|
Model Fitting Criteria
|
Likelihood Ratio Tests
|
|
|
-2 Log Likelihood
|
Chi-Square
|
df
|
Sig.
|
|
Intercept Only
|
829.693
|
|
|
|
|
Final
|
354.770
|
474.923
|
16
|
.000
|
Statistical tests of individual predictors: The statistical significance of individual regression coefficients (i.e. ßs or Exp(ß) tested using Wald chi-square statistic Table-6 and Table-9. From the values of Table-6 and Table-9 the factors Job skill, Job execution, Initiative, Team work, Compliance to policies make the model significant. The client orientation and Gender are insignificant for this model.
Goodness-of-fit statistics: To assess the model used in the study against the actual outcomes (i.e. independent factors influencing the outcome of the PAS Rating). In this model the Chi-square value for both the cases has found to be significant. It can be observed from the Table-5 that the model adequately fits the data. If the null is true, the Pearson and deviance statistics have chi-square distributions with the degrees of freedom displayed.
|
Table 5. Goodness-of-Fit
|
|
|
Chi-Square
|
df
|
Sig.
|
|
Pearson
|
1634.226
|
470
|
.000
|
|
Deviance
|
340.248
|
470
|
1.000
|
The three additional descriptive measures for goodness-of-fit and estimating the strength the multinomial logistic regression relationship are R2 indices (Table-6) defined by Cox and Snell (1989) and Nagelkerke (1991). In linear regression it is the proportion of variation in the dependent variable that can be explained by predictors in the model. Attempts have been made to yield an equivalent of this concept for the logistic model. The values of (0.703 Cox and Snell; 0.753 Nagelkerke; and 0.558 (McFadden, 1975) have been used. Tabatchnick and Fidell (2007) suggest that it approximates the same variance as in linear regression interpretation as R2 and based on the log likelihood for the model compared to the log likelihood for a baseline model. With the categorical outcomes it has a maximum value of less than 1. Nagelkerke’s R2 is the adjusted version of the Cox & Snell R2 that adjusts the scale of statistic to cover the full range from 0 to 1. McFadden R2 is based on log-likelihood kernels for the intercept–only model and the full estimated model. The value of 0.558 is significant (Hensher & Johnson, 1981). Furthermore none corresponds to predictive efficiency of it can be tested in an inferential framework (Menard, 1995 & 2000). Therefore we can treat this as supplementary to other evaluations.
|
Table 6. Pseudo R-Square
|
|
Cox and Snell
|
.703
|
|
Nagelkerke
|
.753
|
|
McFadden
|
.558
|
Validation of predicted likelihood ration: The likelihood rations checks the contribution of effect on the model. Here, Job skill, Job execution, Initiative, Team work and Compliance to policies make model significant.
|
Table 7. Likelyhood Ratio Tests
|
|
Effect
|
Model Fitting Criteria
|
Likelihood Ratio Tests
|
|
-2 Log Likelihood of Reduced Model
|
Chi-Square
|
df
|
Sig.
|
|
Intercept
|
354.770a
|
.000
|
0
|
.
|
|
Job Knowledge
|
359.667
|
4.897
|
2
|
.086
|
|
Job Skill
|
390.802
|
36.032
|
2
|
.000
|
|
Job Execution
|
397.273
|
42.503
|
2
|
.000
|
|
Initiative
|
368.703
|
13.933
|
2
|
.001
|
|
Client Orientation
|
356.520
|
1.750
|
2
|
.417
|
|
Team work
|
374.443
|
19.673
|
2
|
.000
|
|
Compliance to policeis
|
386.979
|
32.209
|
2
|
.000
|
|
Gender
|
357.197
|
2.427
|
2
|
.297
|
|
The chi-square statistic is the difference in -2 log-likelihoods between the final model and a reduced model. The reduced model is formed by omitting an effect from the final model. The null hypothesis is that all parameters of that effect are 0.
aThis reduced model is equivalent to the final model because omitting the effect does not increase the degrees of freedom
|
The classification table (Table-8) documents the validity of predicted probabilities. The first three rows represent three possible outcomes of the multinomial logistic regression model. For each case predicted response category is chosen by selecting the category with the highest model-predicted probability. In this model 88.2% of the cases are classified as correctly. The classification table is most appropriate when a classification is a stated goal of the analysis, else it should only a supplement more rigorous method of assessment of fit (Hosmer &Lemeshow, 2000).
|
Table 8. The Observed and Predicted frequencies for the model
|
|
|
Predicted
|
|
Observed
|
EXCELLENT
|
GOOD
|
OUTSTANDING
|
Percent Correct
|
|
EXCELLENT
|
129
|
25
|
6
|
85.4%
|
|
GOOD
|
15
|
116
|
3
|
86.6%
|
|
OUTSTANDING
|
5
|
1
|
100
|
94.3%
|
|
Overall Percentage
|
37.25%
|
35.5%
|
27.25%
|
88.2%
|
The parameter estimates from Table-9 summarizes the effect of each predictor. Wald test evaluates whether or not the independent variable is statistically significant in differentiating between two groups in each of embedded in multinomial logistic comparisons. A Wald test calculates aZstatistic, which is ratio of the coefficient ß to its Standard error and the resultant Z is squared to yield Wald Statistic.

The results from the Table-9 indicate there is a statistically significant relationship between independent variables Job skill, Job Execution, Initiative Tem work, Compliance to policies when compared with Excellent and Good Ratings versus Outstanding a reference category. Menard (1995) warns that for large coefficients, standard error is inflated, lowering the Wald statistic (chi-square) value. Agresti (1996) states that the likelihood-ratio test is more reliable for small sample sizes than the Wald test.
The parameters with significant negative coefficients decrease the likelihood of response category (i.e dependent variable with respect to the reference category. It can be observed from the relative log odds ratios significant negative influence of independent variables, Job Knowledge (OR, 0.404, 95% 0.168-0.972) Job skill (OR 0.126, 95% CI 0.053-0.296), Job execution (OR 0.105. 95% CI 0.039-0.280), Initiative (OR 0.307, 95% CI0.134-0.705), Team Work (OR 0.284, 95% CI 0.129-0.624), and Compliance to Policies and Practices (OR 0.260, 95% CI 0.117) for dependent variable Rating Excellent and Job knowledge (OR 0.320, 95% CI 0.113-0.907), Job skill (OR 0.066, 95% CI 0.024-0.178), Job Execution (OR 0.036, 95% CI 0.012-0.111), Initiative (OR 0.170, 95% CI 0.064-0.453), Team work (OR 0.142, 95% CI 0.057-0.356), Compliance to policies (OR 0.083, 95% CI -0.032-0.215) for Rating Good verses Outstanding as reference variable.
The ß is the regression coefficient and e=2.71828 (the base of the natural logarithm) and the results are expressed in natural logarithm of an odds ratio. This indicates for each unit decrease in the performance of dependent variable Job skill, the odds of being decrease in Rating Excellent from 1 to 0.126 (=e-2.073 = 2.71828-2.073) and 1 to 0.066 (e-2.719 = 2.71828-2.719) to Rating Good versus Outstanding as reference category. Similarly for each unit decrease in the performance of Client Orientation, likely odds of being decrease Rating Excellent from 1 to 0.564 (=e-0.573) and 1 to 0.586 (e-0.535) to Rating Good versus Outstanding as reference category, and so on. From the results of Table-9 it was concluded that the factors influencing independent variables influencing the PAS – Job knowledge, Job skill, Job Execution, Initiative, Team work, Compliance to policies are similar for the Rating Excellent and Rating Good. The gender is insignificant influence of the PAS in the agriculture sector. Therefore we accept the null hypothesis H0: There are no significant differences among factors that influence the PAS.
|
Table 9: Predicted probabilities from Multinomial Logistic Regression of the influence of seven independent factors on dependent factor Rating (Odds Ratios and 95% CI for Exp(ß)
|
|
Ratinga
|
ß
|
Std. Error
|
Wald
Statistic
|
df
|
Sig.
|
Exp(ß)
|
95% Confidence Interval for Exp(ß)
|
|
Lower Bound
|
Upper Bound
|
|
EXCELLENT
|
Intercept
|
42.719
|
5.818
|
53.917
|
1
|
0.000
|
|
|
|
|
Job Knowledge
|
-0.907
|
0.448
|
4.092
|
1
|
0.043
|
0.404
|
0.168
|
0.972
|
|
Skill Level
|
-2.073
|
0.436
|
22.565
|
1
|
0.000
|
0.126
|
0.053
|
0.296
|
|
Job Execution
|
-2.255
|
0.501
|
20.226
|
1
|
0.000
|
0.105
|
0.039
|
0.28
|
|
Initiative
|
-1.18
|
0.423
|
7.768
|
1
|
0.005
|
0.307
|
0.134
|
0.705
|
|
Client Orientation
|
-0.573
|
0.434
|
1.741
|
1
|
0.187
|
0.564
|
0.241
|
1.321
|
|
Team Work
|
-1.258
|
0.402
|
9.816
|
1
|
0.002
|
0.284
|
0.129
|
0.624
|
|
Compliance to Policies
|
-1.349
|
0.406
|
11.027
|
1
|
0.001
|
0.26
|
0.117
|
0.575
|
|
[Gender=F]
|
0.749
|
0.573
|
1.71
|
1
|
0.191
|
2.115
|
0.688
|
6.499
|
|
[Gender=M]
|
0b
|
.
|
.
|
0
|
.
|
.
|
.
|
.
|
|
GOOD
|
Intercept
|
58.586
|
6.14
|
91.038
|
1
|
0.000
|
|
|
|
|
Job Knowledge
|
-1.14
|
0.532
|
4.593
|
1
|
0.032
|
0.32
|
0.113
|
0.907
|
|
Skill Level
|
-2.719
|
0.506
|
28.903
|
1
|
0.000
|
0.066
|
0.024
|
0.178
|
|
Job Execution
|
-3.319
|
0.572
|
33.664
|
1
|
0.000
|
0.036
|
0.012
|
0.111
|
|
Initiative
|
-1.77
|
0.499
|
12.566
|
1
|
0.000
|
0.17
|
0.064
|
0.453
|
|
Client Orientation
|
-0.535
|
0.509
|
1.106
|
1
|
0.293
|
0.586
|
0.216
|
1.588
|
|
Team Work
|
-1.95
|
0.468
|
17.397
|
1
|
0.000
|
0.142
|
0.057
|
0.356
|
|
Compliance to Policies
|
-2.485
|
0.484
|
26.41
|
1
|
0.000
|
0.083
|
0.032
|
0.215
|
|
[Gender=F]
|
1.07
|
0.691
|
2.399
|
1
|
0.121
|
2.914
|
0.753
|
11.283
|
|
[Gender=M]
|
0b
|
.
|
.
|
0
|
.
|
.
|
.
|
.
|
|
a. The reference category is: OUTSTANDING; b. This parameter is set to zero because it is redundant.
|
Conclusions
The main reason for conducting this study is that authors have not able find sufficient literature on evaluating PAS using multinomial logistic regression model. We made an attempt to assess the PAS using multinomial logistic regression model including sufficient information address an overall evaluation of the multinomial logistic regression model, statistical tests of individual predictors, goodness-of-fit statistics and assessment of predicted probabilities and its influence on PAS using likely log odds. This model adequacy is justified by multiple indicators, including an overall test of all parameters, the statistical significance of each predictor, etc. We have carried out the reliability tests for all the dependent and independent factors and the reliability statistics C-alpha, Split-Half reliability and Spearman Prophecy suggests the internal consistency of the instrument the performance appraisal form.
The results of this study are in line with the studies conducted by the several authors using multiple regression analysis (Ochoti et al. 2012; Poornima& John Manohar, 2015; Chee Hong et al. 2012)The major limitation of the study is Rating biasedness by the evaluator/peer. The authors have no idea whether the one-to-one interview has been happened when appraising the employee. We recommend this type of studies appraising separately for gender-related parity.
References
Agresti, A. (1996). An Introduction to Categorical Data Analysis. John Wiley and Sons, Inc.
Armstrong M, Brown D (2005). Reward strategies and trends in the United Kingdom: the land of diverse and pragmatic dreams Compens. Ben. Rev., 37(4) 41-53.
Armstrong, M. (1991). A Handbook of Personnel Management Practice (4th Edition) London: Kogan Page.
Bertone, S., Brown, M., Cressey, P., Frizzell, J., Keating, C., Morris, A., & Worland. D. (1998). Developing Effective Consultation Practices: Case Studies of Consultation at Work: Melbourne: South Pacific Publishing. Melbourne, Australia
Bohlander, G., & Snell, S. (2004). Managing Human Resources. Mason, Ohio: SouthWestern.
Boswell, W.R., & Boudreau, J.W. (2000). Employee satisfaction with performance appraisals and appraisers. Human Resource Development Quarterly, 11(3) 283-299.
Chee Hong, E.Ng., Zheng Hao, L., Ramesh Kumar., Ramendran. C. and Vimala, K. (2012). An Effectiveness of Human Resource Management Practices on Employee Retention in Institute of Higher learning: - A Regression Analysis. International Journal of Business Research and Management 3(2) 60-79
Cleveland, J.N., & Murphy, K.R. (1992). Analyzing performance appraisal as a goal directed behavior. Research in Personnel and Human Resources Management, 10, 121-185.
Coens, A. T., & Jenkins, M. (2000). Abolishing performance appraisals. San Francisco, CA: Berret- Koehler Publishers, Inc.
Cox, D.R., & Snell, E.J. (1988). The analysis of binary data (2nd ed.), London, Chapman and Hall.
Cronbach, L. (1951). Coefficient Alpha and Internal Structure of Tests. Psychometrika 16, 297-334.
Dargham, N.A.S., (2009). Effective management of the performance appraisal process in Lebanon: An exploratory study. Maître de Conférences à la FGM.
DeNisi, A., and Protchard, R. (2006) Performance appraisal, performance management and improving individual performance: A motivational framework. Management Organization Review http://www.cop-mfdr-africa.org/profiles/blogs/civil-servicerole-linked-to http:// www.wisegeek.org/what-is perfomance-management.htm.
http://www.oecd.org/development/evaluation/188
Desler, G. (2008). Human Resource Management (11th ed.). Upper Saddle River, New Jersey, USA: Pearson.
Garavan, T.N., Morley, M. & Flynn, M. (1997) 360-degree feedback: Its role in employee development. Journal of Management Development, 16(2) 134-147
Garvin, D.A. (1998). The Process of Organizing and Management. Research Future. Harvard Business School. MIT Sloan Management Review, http://sloanreview.mit.edu/article/the-processes-of-organization-and-management/.
Gay, L.R., Mills, G.E., and Airasin, P. (2009). Educational Research: Competencies for Analysis and Applications. Merrill Greenwood, Columbus.
Greenberg, J. (1993). The social side of fairness: Interpersonal and informational classes of organizational justice. In R. Cropanzano (Ed.), Justice in the workplace: Approaching fairness in human resource management: pp. 79103. Hillsdale, NJ: Lawrence Erlbaum.
Haberman, S. (1978). Analysis of qualitative data (Vol. 1). New York: Academic Press
Hensher, D., & Johnson, L.W. (1981). Applied discrete choice modelling. London: Croom Helm.
Hosmer, D.W. Jr. & Lemeshow, S. (2000). Applied logistic regression. (2nd ed.). New York, Wiley.
IBM Corp. Released 2016. (2016). IBM SPSS Statistics for Windows, Version 24.0. Armonk, NY: IBM Corp.
Kaiser, H.F., & Michael, W.B. (1974). Domain validity and Generalisability. Educational and Psychological Measurement 35, 1-13
Longenecker, C.O. & Goff, S.J. (1992). Performance appraisal effectiveness: A matter of perspective. Advanced Management Journal, 57 (2) 18-23.
Longenecker, C.O. (1997). Why managerial performance appraisals are ineffective: Causes and lessons: Journal of Career Development International, 2 (5), 212-218.
Masoud Lotfizadeh, Maimaiti, N., & Ismail, N.H. (2014). Occupational stress among white collar employees in Esfahan Steel Company, Iran. Malaysian Journal of Public Health Medicine 14(1) 79-81.
McDowall, A. & Fletcher, C. (2004). Employee development: An organizational justice perspective. Journal of Personnel Review, 33 (1), 8-29.
McFadden, D. (1973). Conditional logit analysis of qualitative choice behavior. In Frontiers in Econometrics (Edited by P. Zarembka), 105-42. Academic Press, New York.
Medlin, B. (2013) Performance Management-or lack thereof-at Bella’s. Journal of Business Cases and Applications. Vol. 7, p29 1-8
Menard, S. (2000). Coefficients of determination for multiple logistic regression analysis. The American Statistician 54(1) 17-24
Mernard, S. (1995). Applied logistic regression analysis (Sage University Paper Series on Qualtitative Applications in the Social Sciences, 07-106). Thousand Oaks, CA: Sage
Nagelkerke, N.J.D. (1991). A note on general definition of the coefficient of determination. Biometrika 78 691-692.
Novick, M.R., & Lewis, C. (1975). Coefficient Alpha and the Re3liability of Composite Measurements. Psychometrika, 32:1-13
Ochoti, G.N., Maronga, E., Muathe, S., Nyabwanga, R.N., & Ronoh, P.K. (2012). Factors Influencing Employee Performance Appraisal System: A Case of the Ministry of State for Provincial Administration & Internal Security, Kenya. International Journal of Business and Social Science 3(20):37-45.
Peng Chao-Ying, J., Lee, K.L., & Ingersoll, G.M. (2002). An introduction to logistic regression analysis and reporting. The Journal of Educational Research 96(1):3-14
Peng, C.Y., Manz, B.D., & Keck, J. (2001). Modelling categorical variables by logistic regression. Jounral of Health Behaviour, 25(3): 278-284
Poornima, V., & John Manohar, S. (2015). Performance Appraisal System and Employee Satisfaction among its Employees in Bangalore. International Journal of Science and Research 4(3): 1169-1174.
Sateesh Kumar, K., & Madhu, G. (2012). Analysis and multinomial logistic regression modelling work stress in manufacturing industries in Kerala, India. International Journal of Advances in Engineering & Technology 2(1): 410-418
Schlesselman, J.J. (1981). Case control studies: Design, control, analysis. New York. Oxford University Press.
Shrivastava, A., & Purang, P. (2011). Employee perceptions of performance appraisals: a comparative study on Indian banks. The International Journal of Human Resource Management, 22(3), 632-647.
Stephen, E.B. 2014. Occupational stress and coping strategies among female employee of commercial banks in Nigeria. International Journal of Scientific Research and Management 2(9):1417-1430.
Sudhir Chandra Das. 2016. Human resource practices as predictors of work-family and employee engagement among employees in Indian Insurance Companies: An application of Multinomial Logistic Regression Analysis. Pacific Business Review International 9(7): 1-13
Suryawanshi, A., Savasani, M. & Shah, J. (2015). A study of stress level of married men and women using multinomial logistic regression. International Journal of Scientific Research Publications. 5(8): 1-8
Tabatchnick, B.G., & Fidell, L.S. (2007). Using multivariate statistics. Pages 481-498 in (5th ed.) Boston: Pearson Education, Inc.
Townley, B. 1999. Practical reason and performance appraisal. Journal of Management Studies, 36 (3), 287-306.
Vallance, S. (1999). Performance Appraisal in Singapore, Thailand and the Philippines: A Cultural Perspective. Australian Journal of Public Administration 58(4) 78-95
Yee, C.C., & Chen, Y.Y. (2009). Performance Appraisal System using Multifactorial Evaluation Model. World Academy of Science, Engineering and Technology International Journal of Mathematical, Computational, Physical, Electrical and Computer Engineering 3(5): 2009
Zakaria, N., Zainal, S., & Nasurdin, A. (2012). Investigating the role of human resource management practices on the performance of SME: A SME: A conceptual framework. Journal of Global Management, 3(1), 74-92.

