A Refereed Monthly International Journal of Management
Lifestyle Segments of Online Shoppers based on Online Activities, Interests and Opinions
Author
|
Vivek Singh Tomar
Asst. Professor & Research Scholar
Amity Business School - Noida,
Amity University
Uttar Pradesh
|
Dr. Kalyan Kumar De
Professor
Amity Business School - Noida,
Amity University
Uttar Pradesh
|
Introduction
It is evident through general trends that the society is constantly moving towards individualization. Single product solution to meet generalized consumer needs neither fit the consumer aspirations nor it offer any help to marketers. Focus on individuals and individual aspirations drive the market today and are deemed to be the megatrend in future as well. Consumer’s needs, desires, cravings or longings have always been the core of marketer’s interest and most of the strategies of marketing are focused on them. It has also been realized that it is difficult for marketer to satisfy all consumers with similar value preposition, offered indiscriminately to everyone(Ruck & Mende, 2008). Lifestyle and Psychographic study under the framework of Activities, Interests and Opinions (AIO) has been prominently used in past researches on segmentation and has been found effective to understand the consumer’s rooted cognitions beyond the facts(Wisenblit, 2008).
Activities, interests and opinions or AIO is one of the approaches to carry out psychographic segmentation. Consumers are grouped according to some combination of three categories of variables namely activities, interests and opinions in order to understand the psychographic patterns which facilitates psychographic segmentation and are called AIOs. Generally, psychographic segmentation follows a post hoc model. That is, consumers are first asked a variety of questions about their lifestyles and then grouped on the basis of the similarity of their responses (Peter & Olson, 2010). This facilitates in understanding the attitudes, motives, needs and perception regarding a product or a brand. The most common applications of AIOs are in market segmentation and advertising. This is deduced through a series of questions asked by a market researcher which ultimately gives the consumers psychographic profile. Because of their versatility psychographics are widely used in segmentation and are part of almost any hybrid segmentation framework(Schiffman, Kanuk, & Kumar, 2010).
Theoretical Background
Customer segmentation is one of the significant activities of marketing, which help marketers to divide their customers into more meaningful homogeneous groups. There are different segmentation approaches based on different criterions, some of the major approaches are: socioeconomic/demographic, geographic approach, product-related and psychographic approach. Socioeconomic approach is also known as demographic segmentation approach. This approach emphasis on the customer’s aspects, like gender, income, age category, occupational group etc. Geographic segmentation highlights the location locational information of customer. Product-related approach of segmentation categorizes customers based on their buying behavior within the specific product category, which the customer expects from a product category. Lastly, we discuss the psychographic segmentation approach, which consider criterions like lifestyle, personalities and social status segmentation. This approach may also involve a combination of demographics and psychological criterions for segmentation. A concept proposed and presented by Demby (1974), psychographics bring along psychological as well as demographical variable together. Psychological aspects were highlighted to develop understanding of consumer behavior to guide better formulation of marketing strategies (Demby, 1974). The classification of consumers on the basis of demographic segmentations gives relatively hollow results, which divulge nothing regarding the underlying motives behind their consumption decisions. The initial stages of psychographics research emphasize on the development of personality profiles of the customers. In the later stages of psychographic researches the focus shifted from consumer personalities to consumer lifestyles. In present scenario, lifestyle is generally defined as, “A way of living ofindividuals,families(households), and societies, which theymanifestin coping with their physical,psychological, social, andeconomic environmentson a day-to-day basis”(Business Dictionary). As per Chaney (1996) lifestyle is defined as, “patterns of action that differentiate people”. He writes “lifestyles help to make sense of what people do, and why they do it, and what doing it means to them and others” (Chaney, 1996). With time the concept of lifestyle has emerged so strong that in most of the consumer researches in the area of psychographics, either it has totally replaced or is used synonymously with consumer personality ( Kahle & Chiagouris, 1997). Generally, most of the lifestyle researches were based on wide-ranging surveys. We could better understand the lifestyle research by understanding its various stages of evolution. During the stage one lifestyle research were primarily based on evaluation of AIO items. AIO refers to measurement of and dealing with activities, interests and opinions of the research population. “Activities are manifested actions (work, hobbies, social events, vacation, entertainment, community, shopping, sport, etc.). Interest in some objects, events or topics (family, home, job, community, recreation, fashion, food, media, achievements, etc.) is the degree of excitement that accompanies both special and continuing attention to it. Finally, opinions are descriptive beliefs (of oneself, social issues, politics, business, economics, education, products, culture, etc.)”(Plummer, 1974). Most researches based on AIO often used very big groups of AIO statements. Like Cosmas (1982) administered a vast survey instrument covering 250 AIO items and later applied Q Factor analysis to identify and generate seven lifestyle clusters (Cosmas, 1982). During the second stage of research in the area of psychographic value concept substituted the AIO framework. Values are commonly defined as, “desirable, trans-situational goals, varying in importance, that serve as guiding principles in people's lives” (Schwartz, Shalom H. , 1994). Presently values are of specific attention since values may influence a broad range of behavior across various circumstances. Hence values are considered major lifestyle elements. As pointed out by Gunter and Furnham (1992), “Lifestyles are defined as patterns in which people live and spend their time and money. They are primarily functions of consumer's values” (Gunter & Furnham , 1992). Generally, by linking demographics with psychographic information, the marketers could get better insight into their consumer profiles.
Lifestyle segmentation is the union of two concepts into a single system. One of the concepts is lifestyle patterns and the other is market segmentation.(Plummer, 1974) The most widely used approach to lifestyle measurement has been AIO (Activities, Interests, and Opinions) rating statements. Lifestyle as used in lifestyle segmentation research measures people’s activities in terms of (1) how they spend their time; (2) their interests, what they place importance on in their immediate surroundings; (3) their opinions in terms of their view of themselves and the world around them; and (4) some basic characteristics such as their stage in life cycle, income education, and where they live. (Wells & Tigert, 1971)
Not many studies have been found in the area of lifestyle segmentation of online shoppers/consumers worldwide. One particular study on the online shopper’s lifestyle segmentation in India has been found during literature review which is mentioned below, while other studies indicate lifestyle segmentation either in general or in some other context, a detailed review of all such relevant studies is presented below:
Aljukhadar et al. (2011) have provided a basis for segmentation of online customers. Their study reveals that online consumers form three global segments: Basic Communicators: They are consumers who mainly use e-mail to communicate , and consist of mostly highly educated people and older people. Lurking Shoppers: They are consumers who employ the internet to navigate and to heavily shop, consisting of highly educated males or females who belong mainly to the higher income and age groups. Social Thrivers: They consist of consumers who use the internet to socially interact by chatting, blogging, video streaming, and downloading information. Social Thrivers belong to the youngest age group (less than 35 years old) and fall in the lowest income bracket.(Aljukhdar, Muhammad, & Sylvain, 2011)
<
Pandey et al. (2015) found three online shopper segments, namely, mature traditionalists, offer enthusiasts, and technology mavericks. They were influenced by five key factors, namely, Internet enjoyment and convenience, Internet distrust, Internet offers, Internet logistical concerns, and Internet self-inefficacy. Mature traditionalists are the relatively older, married customers who prefer offers given by the brick-and-mortar stores but are attracted to the convenience and enjoyment of buyingonline. Internet-based offers, in terms of selection and quality, are the key attraction for the offer enthusiasts. Technology mavericks are the younger generation, avid users of the Internet having no logistical or self-inefficacy issues. However, they do not trust the security and privacy offered by Internet vendors.(Pandey, Chawla, & Venkatesh, Jan-Mar 2015)
Study conducted by Yang (2004) in Taiwan identifies three distinct segments of Internet users on the basis of their lifestyle characteristics. Lifestyle clusters were found to predict Internet users’ attitudes towards Internet advertising. Attitudinal differences were particularly worth noticing between the traditionalists, experiencers and self-indulgent.(Yang, September 2004)
In a study conducted by Allred et al. (2006) six important segments were identified. Three of the segments characterize customers who resistonlineshopping, even though they engage in otheronlineactivities. Security fears and technological incompetence typically inhibit these users from engaging in electronic exchange. Some internet users simply choose not to shoponline. Three of the segments describe active e-shoppers who are driven by a unique desire to socialize, minimize inconvenience, and maximize value.(Allred, Smith, & Swinyard, 2006)
Study by Brengman et al. (2005) Identified fouronlineshoppingsegments (tentative shoppers, suspicious learners, shoppinglovers, and business users) and fouronlinenon shopping segments (fearful browsers, positive technology muddlers, negative technology muddlers, and adventurous browsers) are profiled with regard to their web-usage-related lifestyle, themes of internet usage, internet attitude, psychographic, and demographic characteristics (Brengman, Geuens, Smith, & Swinyard, 2005).
Rationale and Objectives of the study
Review of literature based on the existing researches conducted in the area of lifestyle and psychographic segmentation reveals that a substantial gap exist which create the requirement to study the online activities, online interests and online opinions of online shoppers. Also a need to use online AIO to identify the segments based on online AIO was felt. Such segments could reveal a lot about the psychographics and lifestyle differences among online shoppers.
The major objectives for the study are:
To identify the major online activities, interests and opinions (AIO’s) of online shoppers
To identify the online shoppers segments based on online AIO
To develop distinct online shopper’s profiles based on the differences in online AIO
Research Method
The identification of online AIO was done through exploratory research design, where a series of four focus groups with small groups of eight online shoppers per focus group was recorded and investigated to understand and prepare an exhaustive list of online AIO. The final list of online AIO’s was prepared based on the insight gathered from the focus group studies.
The exploratory study was followed by the descriptive design where a questionnaire based on the final list of online AIO was prepared where data was collected from 165 online shoppers on an itemized five point scale. The questionnaire was loaded on Google Forms and was shared through forwarding the form link through email, whatsapp and facebook. The data collected was transferred to SPSS data file and further analysis was conducted.
A combinational approach for clustering was used. First, Hierarchical Cluster analysis with Ward Method using Squared Euclidean Distance as an interval measure was used to identify the number of clusters based on AIO statements. Resulting Agglomeration Schedule and Dendrogramwere analyzed to determine the number of clusters to be extracted. Further K-mean Cluster Analysis was applied on the data with a priori knowledge of clusters to be extracted.
The final clusters determined were analyzed further after assigning cluster membership to each and every case included in the sample. Based on the final analysis, detailed psychographic profiling based on AIO for online shoppers was presented and described.
Analysis and Interpretation
The analysis of focus groups transcript helped in identifying 11 Online Activities, 11 Online Interests and 13 Online Opinions as specified in Table 1, which were used as variables for cluster analysis to identify the lifestyle segments based on online AIO.
|
Table1: AIO Variables identified through focus groups
|
|
Variable Code
|
Variable Label
|
Variable Short Code
|
Mean Value
|
Reliability Coefficient
|
Overall Reliability
|
|
Online Lifestyles (Activities)
|
Cronbach α = 0.874
|
|
AC1
|
I use internet for social media
|
Social Media
|
4.16
|
Cronbach α = 0.838
|
|
AC2
|
I use internet for learning purpose
|
Learning
|
4.09
|
|
AC3
|
I use internet for movie tickets/shows
|
Movie tickets/shows
|
3.77
|
|
AC4
|
I use internet for phone calls/video calls
|
Phone calls/video calls
|
3.52
|
|
AC5
|
I use internet for information search
|
Information search
|
4.47
|
|
AC6
|
I use internet for banking activities
|
Banking activities
|
3.76
|
|
AC7
|
I use internet for travel bookings
|
Travel bookings
|
3.81
|
|
AC8
|
I use internet for entertainment
|
Entertainment
|
4.24
|
|
AC9
|
I use internet for product/services search & reviews
|
Product/services search & reviews
|
4.21
|
|
AC10
|
I use internet for online shopping
|
Online shopping
|
3.85
|
|
AC11
|
I use internet for emailing
|
Emailing
|
4.46
|
|
Online Lifestyles (Interests)
|
|
I1
|
I like watching sports online
|
Watching sports
|
2.97
|
Cronbach α = 0.858
|
|
I2
|
I like watching/downloading adult contents online
|
Watching/downloading adult contents
|
2.89
|
|
I3
|
I like online news and information updates
|
Online news and information update
|
3.99
|
|
I4
|
I like to watch/ download movies
|
Watch/ download movies
|
3.71
|
|
I5
|
I like streaming/ downloading music
|
Streaming/ downloading music
|
3.84
|
|
I6
|
I like playing online games
|
Playing online games
|
2.92
|
|
I7
|
I like to watch videos online
|
Watch videos online
|
3.95
|
|
I8
|
I like making new friends on social sites
|
Making new friends on social sites
|
3.13
|
|
I9
|
I like to share my viewpoint on online blogs / forums/ groups
|
Share my viewpoint on online blogs / forums/ groups
|
2.96
|
|
I10
|
I like to stay connected with people I know
|
Stay connected with people I know
|
4.03
|
|
I11
|
I like to research and read articles for knowledge gain
|
Research and read articles for knowledge gain
|
4.07
|
|
Online Lifestyles (Opinions)
|
|
O1
|
I think that life is impossible without internet
|
Life is impossible without internet
|
3.77
|
Cronbach α = 0.681
|
|
O2
|
I think that internet is not good for health
|
Internet is not good for health
|
2.73
|
|
O3
|
I think that children should be kept away from internet
|
Children should be kept away from internet
|
2.87
|
|
O4
|
I think that there is nothing real in this virtual world
|
There is nothing real in this virtual world
|
2.90
|
|
O5
|
I think that internet has made my life very easy
|
Internet has made my life very easy
|
4.18
|
|
O6
|
I think there is no excitement in life without internet
|
There is no excitement in life without internet
|
3.44
|
|
O7
|
I think that internet has brought the world closer
|
Internet has brought the world closer
|
4.25
|
|
O8
|
I think that one should spend more time offline with real people
|
One should spend more time offline with real people
|
3.99
|
|
O9
|
I think that internet is a waste of time
|
Internet is a waste of time
|
2.41
|
|
O10
|
I think that internet is the best and fastest way to express oneself
|
Internet is the best and fastest way to express oneself
|
3.52
|
|
O11
|
I think that the fast way to name and fame is through internet only
|
The fast way to name and fame is through internet only
|
2.93
|
|
O12
|
I think that non internet users are as good as illiterate
|
Non internet users are as good as illiterate
|
2.36
|
|
O13
|
I think that in future, all buying and selling will happen online only
|
In future, all buying and selling will happen online only
|
3.33
|
Reliability of measure represents degree to which a measurement technique can be depended upon to secure consistent results upon repeated application. In the scale used for capturing AIO overall reliability of the combined scale was found to be 0.874, which confirms the reliability of AIO Scale. Though, the Cronbach alpha value of online opinions is 0.681, which is considered obvious due to lack of expected internal consistency and difference in opinions on internet.
Apart from the variables mentioned in Table 1, data on demographics, internet usage and online shopping pattern was also collected and analyzed further.
Descriptive Analysis
The demographics information summery of the respondents surveyed for the sample study is given in Table 2 below:
|
Table 2: Demographic Characteristics
|
|
Gender
|
|
|
Frequency
|
Percent
|
|
Male
|
113
|
68.5
|
|
Female
|
52
|
31.5
|
|
Age
|
|
|
Frequency
|
Percent
|
|
18-25 Years
|
97
|
58.8
|
|
25-35 Years
|
31
|
18.8
|
|
35-45 Years
|
25
|
15.2
|
|
Abobe 45 Years
|
12
|
7.3
|
|
Education
|
|
|
Frequency
|
Percent
|
|
High school
|
2
|
1.2
|
|
Intermediate
|
38
|
23
|
|
Graduate
|
30
|
18.2
|
|
Post Graduate
|
89
|
53.9
|
|
Ph.D.
|
6
|
3.6
|
|
Profession
|
|
|
Frequency
|
Percent
|
|
Self Employed
|
13
|
7.9
|
|
Salaried (Private)
|
47
|
28.5
|
|
Salaried (Government)
|
6
|
3.6
|
|
Student
|
92
|
55.8
|
|
Housewife
|
5
|
3
|
|
Unemployed
|
2
|
1.2
|
|
Annual Household Income
|
|
|
Frequency
|
Percent
|
|
Below 5 Lac
|
39
|
23.6
|
|
5-10 Lac
|
34
|
20.6
|
|
10-15 Lac
|
36
|
21.8
|
|
Above 15 Lac
|
56
|
33.9
|
|
Marital Status
|
|
|
Frequency
|
Percent
|
|
Single
|
107
|
64.8
|
|
Married (Without Kids)
|
15
|
9.1
|
|
Married (With Kids)
|
43
|
26.1
|
respondents included in the study were single male post graduate student in the age group of 18-25, with household family income above 15 Lac per annum. Though, respondents of other demographic profiles were also adequately covered in the study. Apart from demographic details the data on Internet usage and online shopping related detail has also been collected, which is mentioned below in Table 3
|
Table 3: Internet Usage and Online Shopping Profile
|
|
Internet Usage Experience
|
|
|
Frequency
|
Percent
|
|
1-3 Years
|
11
|
6.7
|
|
3-5 Years
|
17
|
10.3
|
|
5-7 Years
|
32
|
19.4
|
|
More than 7 Years
|
105
|
63.6
|
|
Frequency of active internet usage per week
|
|
|
Frequency
|
Percent
|
|
Once a week
|
6
|
3.6
|
|
1-3 Days
|
3
|
1.8
|
|
3-5 Days
|
17
|
10.3
|
|
Daily
|
139
|
84.2
|
|
Duration of Internet usage per use
|
|
|
Frequency
|
Percent
|
|
Less than 30 Minutes
|
14
|
8.5
|
|
30 Minutes - 1 Hour
|
33
|
20
|
|
1-3 Hours
|
56
|
33.9
|
|
3-5 Hours
|
27
|
16.4
|
|
More than 5 Hours
|
35
|
21.2
|
|
Online Shopping Experience
|
|
|
Frequency
|
Percent
|
|
Less Than 1 Year
|
29
|
17.6
|
|
1-3 Years
|
66
|
40
|
|
3-5 Years
|
46
|
27.9
|
|
More than 5 Years
|
24
|
14.5
|
|
Frequency of Online Shopping Per Year
|
|
|
Frequency
|
Percent
|
|
Once in a Year
|
10
|
6.1
|
|
2-5 times
|
51
|
30.9
|
|
5-10 times
|
37
|
22.4
|
|
10-15 times
|
28
|
17
|
|
More than 15 times
|
39
|
23.6
|
|
Medium for Online Shopping
|
|
|
Frequency
|
Percent
|
|
Website
|
44
|
26.7
|
|
App
|
27
|
16.4
|
|
Both
|
94
|
57
|
The date in Table 3 reveals that majority of the respondents included in the study were mature internet users with more than 7 years of internet usage experience. Majority of the respondents use internet daily in between 1-3 hours per day, the online shopping experience of the majority respondents was found to be in between 1-3 Years, which explains their not so mature acquaintance with online shopping. Majority respondents shop online 2-5 times in a month and they use both website as well as mobile app for shopping.
Along with analysis of frequencies for internet usage experience, frequency of active internet usage per week, internet usage per day, overall online shopping experience, frequency of online shopping per year and use of medium for online shopping, the shoppers online purchase of various item categories was also analyzed and the results are as mentioned below in Figure 1.
Figure 1: Online purchase of various item categories
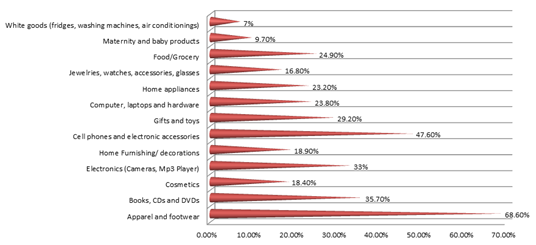
Above figure clearly specifies that through online shopping medium, apparel & footwear is the most popular purchase category followed by cell phones & electronic accessories further followed by electronic items and books CDs and DVDs. It is also evident from the data that white goods are the least preferred goods purchased online through E-tailing sites.
Cluster Analysis
Under the combinational approach Hierarchical Cluster analysis with Ward Method using Squared Euclidean Distance as an interval measure was used to identify the number of clusters based on AIO statements. Resulting Agglomeration Schedule and Dendrogram were found as given below:
|
|
|
Table 4: Agglomeration Schedule
|
|
Stage
|
Cluster Combined
|
Coefficients
|
Stage Cluster First Appears
|
Next Stage
|
|
Cluster 1
|
Cluster 2
|
Cluster 1
|
Cluster 2
|
|
1
|
15
|
105
|
1.000
|
0
|
0
|
2
|
|
2
|
15
|
134
|
3.333
|
1
|
0
|
3
|
|
3
|
15
|
26
|
6.000
|
2
|
0
|
23
|
|
-
|
-
|
-
|
-
|
-
|
-
|
-
|
|
-
|
-
|
-
|
-
|
-
|
-
|
-
|
|
-
|
-
|
-
|
-
|
-
|
-
|
-
|
|
-
|
-
|
-
|
-
|
-
|
-
|
-
|
|
158
|
6
|
13
|
4998.862
|
156
|
147
|
161
|
|
159
|
5
|
25
|
5167.061
|
157
|
152
|
162
|
|
160
|
2
|
10
|
5342.696
|
155
|
153
|
161
|
|
161
|
2
|
6
|
5571.265
|
160
|
158
|
163
|
|
162
|
3
|
5
|
5821.554
|
150
|
159
|
164
|
|
163
|
1
|
2
|
6199.547
|
154
|
161
|
164
|
|
164
|
1
|
3
|
7307.382
|
163
|
162
|
0
|
One can take a decision by observing the agglomeration schedule, obtained by using the ward linkage method, given in Table 4 where we examine the distance coefficient values in the ‘coefficients’ column. In our case, we see from the agglomeration schedule in the table that the difference between the value in the ‘coefficients’ column become suddenly high between stage 160 (five clusters) and 161 (four clusters). The number of clusters shown in an N sample data (N=165) are shown as N-1 (stage=164). Thus a five cluster solution seems correct.
The similar finding of five cluster solution is corroborated by the Dendrogram given below in Figure 2:
Figure 2: Dendrogram using Ward Linkage (Rescale Distance Cluster Combined)
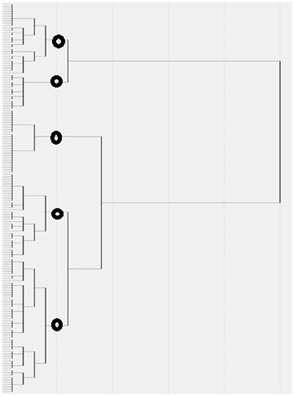
As highlighted in the above Dendrogram at a rescaled distance of 5 we could get five distinct clusters. The information so obtained would be used to find the distinct clusters by using K-means cluster analysis. Each case would be assigned cluster membership based on the k-mean cluster algorithm. Based on K-mean cluster analysis the sample of 165 was divided into five clusters as per the details given below in Table 5.
|
Table 5: Number & Percentage of Cases in each Cluster
|
|
Cluster
|
1
|
7
|
4.24%
|
|
2
|
67
|
40.61%
|
|
3
|
35
|
21.21%
|
|
4
|
36
|
21.82%
|
|
5
|
20
|
12.12%
|
|
Total
|
165
|
100%
|
Cluster wise Activities, Interests and Opinions
On the basis of cluster divisions the online AIO have been analyzed separately to understand the cluster differences and the results in terms of mean values are presented in figure 3, 4 and 5 as given below:
Figure 3: Online Activities among Clusters
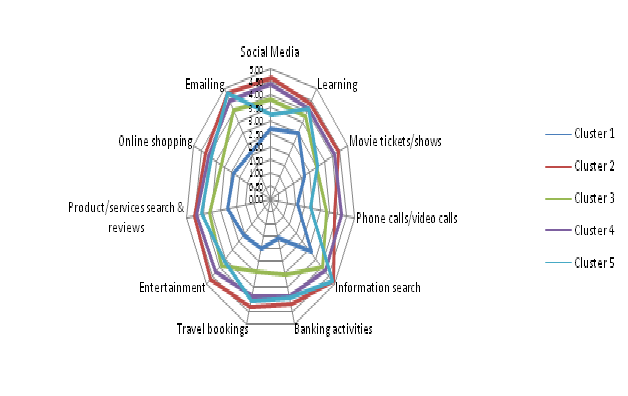
Based on above figure we could interpret that cluster 1 is lowest in terms of internet based activities, while cluster 2 is most internet active and score highest in terms of all internet activities except making phone calls and video calls, where cluster 4 is most involved and active. Cluster 3 is also low in internet activities but little more active than cluster 1. Cluster 3 is found little bit higher in terms entertainment and social media than Cluster 5. Cluster 4 is somewhere in between Cluster 2 and Cluster 5 in terms of their active involvement with various online activities. Cluster 4 is lower than Cluster 2 in all activities except making online phone calls/video calls whereas lower than Cluster 5 in online information search, learning, emailing and travel booking. Cluster 5 is found highest in terms of Emailing and information search almost equivalent to Cluster 2.
Figure 4: Online Interests among Clusters
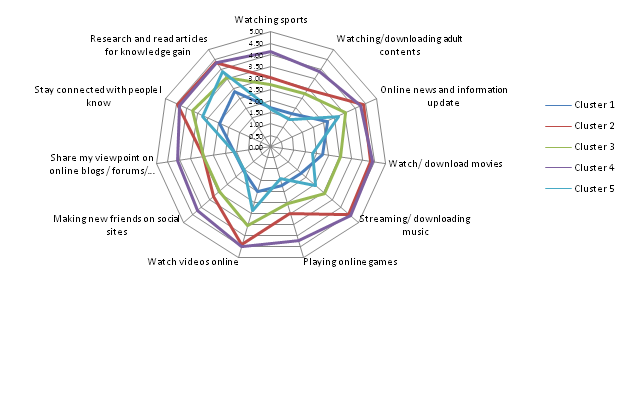
From Figure 4 it is evident that Cluster 1 is least interested in almost all online interest areas except watching/downloading movies, watching/downloading adult contents and playing online games where it is higher than Cluster 5. Cluster 2 is highest and almost equivalent to Cluster 4 in terms of watching online videos, streaming/ downloading music, watching/downloading movies, highest in online news and information updates, reading research and article for information updates and staying connected with known people on online platforms. Cluster 3 falls in between Cluster 2 and Cluster 5, where it is lower than Cluster 5 in terms of reading research and articles for knowledge gain and Cluster 3 is found almost equivalent to Cluster 2 in having interest in sharing online viewpoints through blogs, forums and groups. Cluster 4 is found highest in all eleven online interest areas, except two online news/ information updates and staying connected with known people. Cluster 5 lies between Cluster 1 and Cluster 3, where it is higher in reading research and online articles for knowledge gain than Cluster 3, this cluster is also least interested in movie, music and adult content download.
Figure 5: Online Opinions among Clusters
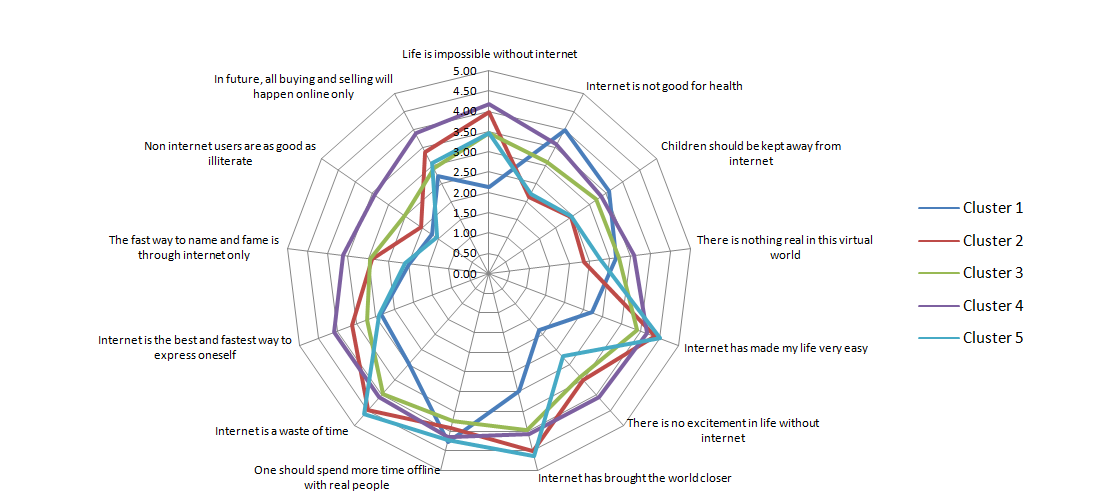
Figure 5 above quite interesting insights into the opinions that the respondents have towards being online. Cluster 1 feel strongly that spending time online is bad for health and one should spend more time with family than online virtual world, and this cluster does not believe the necessity of associating internet activities with being literate or educated. They do not find internet to be very important in terms of bringing ease in their lives and also don’t feel that internet bring any excitement to their lives. Cluster 1 also advocates strongly keeping children away from internet. Cluster 2 on the contrary strongly believe that internet has made their lives easy and has brought the world closer, they strongly believe in the reality of virtual world, but also believes that internet waste lot of time. Cluster 3 is mostly neural on their opinions on online world but believes that internet has made their lives easy and has brought the world closer; they also feel that internet is a time waster. Cluster 4 is having strongest opinion in seven areas out of thirteen. The seven areas include, life is impossible without internet, all buying/selling will happen online in future, internet non users are as good as illiterate, internet is the fastest way of expression, internet is quick way to name and fame, there is no excitement in life without internet and there is nothing real in this virtual world. Cluster 5 members are the strongest believer among the other segments that internet has made their lives easy and internet has brought the world together. Cluster 5 respondents also holds the highest contradictory opinion that internet is a waste of time and one should spend more time with real people than wasting time in virtual world. Cluster 5 respondents hold respect for non-internet users and find life exciting beyond internet.
Conclusion and Implications
Dividing the online shoppers into distinct clusters was found to be a virtuous approach to give clear and concise differences among various segments of online shoppers. Process of using online Activities, Interest and Opinion (AIO) for segmenting the online shoppers has helped in identifying five distinct segment of consumers which are homogeneous within and heterogeneous with other segments in terms of their distinct online AIO. Based on the individual characteristic of the five segments, Cluster 1 could be named as “Online Reprobates”, Cluster 2 could be named as “Online Optimizers”, Cluster 3 could be named as “Online Pragmatics”, Cluster 4 could be named as “Online Enthusiasts” and finally Cluster 5 could be named as “Online Scholars”.
Marketers could take insight from the study to develop suitable online positioning strategy to better target the five segments of online customers highlighted through the research findings. The study also suggests developing suitable appeal and theme based on the segment differences highlighted through the results. Segment called “Online Reprobates” was found smallest in size so could be initially ignored by online marketers but Segment called “Online Optimizers” was found significantly largest among all five segments so all the marketing activities and strategies should be designed keeping in focus the AIO “Online Optimizers” because this segment being biggest and most potential is hard to ignore by mass marketers. Segments called “Online Pragmatics” and “Online Enthusiasts” are also found quite sizable and significant for multi segment targeting approach as well as niche marketing approach. Segment called “Online Scholars” could be considered by niche marketers to sustain its demands and to grow this segment further. The findings of this study could be applied in emerging economies like India and other countries. For other countries/ markets the findings could also be generalized for urban, educated and affluent online users with some minor deviations attributed to cultural differences affecting AIO. Since the data was collected mostly from urban, educated and mostly high incomed respondents and do not cover the viewpoint of rural, uneducated, less incomed and non-internet users, the findings of the study is to be used selectively.
References
Aljukhdar, Muhammad, & Sylvain. (2011). Segmenting the online consumer market. Marketing Intelligence & Planning, 29 (4), 421-435.
Allred, C. R., Smith, S. M., & Swinyard, W. R. (2006). E-shopping lovers and fearful conservatives: a market segmentation analysis. International Journal of Retail & Distribution Management, 34 (4/5), 308-333.
Brengman, M., Geuens, M., Smith, S. M., & Swinyard, W. R. (2005). Segmenting internet shoppers based on their web-usage-related lifestyle: a cross-cultural validation. Journal of Business Research, 58 (1), 79-88.
Business Dictionary. (n.d.). Lifestyle . Retrieved April 12, 2016, from A Business Dictionary website: http://www.businessdictionary.com/definition/lifestyle.html
Chaney, D. (1996). Lifestyles. London: Routledge.
Cosmas, S. C. (1982). Lifestyles and consumption patterns. Journal of Consumer Research, 8 , 435-455.
Demby, E. (1974). Psychographics and from whence it came. (W. D. Wells, Ed.) Chicago: American Marketing Association.
Gunter, B., & Furnham , A. (1992). Consumer profiles: An introduction to psychographics. London: Routledge.
Kahle, L. R., & Chiagouris, L. (1997). Values, lifestyle and psychographics. Hove: Psychology Press.
Pandey, S., Chawla, D., & Venkatesh, U. (Jan-Mar 2015). Online shopper segmentation based on lifestyles: An exploratory study in India. Journal of Internet Commerce, 14 (1), 21-41.
Peter, J. P., & Olson, J. C. (2010). Consumer Behaviour & Marketing Strategy (7 ed.). New Delhi: TATA McRAW HILL.
Plummer, J. T. (1974). The concept and application of life style segmentation. Journal of Marketing, 38 (1), 33-37.
Ruck, H., & Mende, M. (2008). Innovations in market segmentation and customer data analysis. in R. B. Conrady (Ed.), Trends and Issues in Global Tourism (pp. 133-148). New York: Springer.
Schiffman, L. G., Kanuk, L. L., & Kumar, S. R. (2010). Consumer Behaviour (10 ed.). New Delhi: Pearson.
Schwartz, Shalom H. . (1994). Are there universal aspects in the structure and content of human values? Journal of Social Issues, 50 , 19-45.
Wells, W., & Tigert, D. (1971, August). Activities, interests and opinions. Journal of Advertising Research, 11 , 27-35.
Wisenblit, J. (2008). Segmentation: From traditional bases to behavioural and microtargeting. New Jersey: Working Paper, Stillman School of Business, Seton Hall University, South Orange.
Yang, K. C. (September 2004). A comparison of attitudes towards Internet. Journal of Marketing Communications , 195-212.

