A Refereed Monthly International Journal of Management
CAPACITY UTILIZATION OF CAPITAL GOODS INDUSTRY IN INDIA
Author
- AN EMPIRICAL EVALUATION
|
Dr. Aparna Bhatia
Assistant Professor
Department of Commerce,
Guru Nanak Dev University, Amritsar, Punjab, India |
Baljinder Kaur
Assistant Professor
Department of Commerce,
Lyallpur Khalsa College, Jalandhar, Punjab, India
|
ABSTRACT
A vibrant capital goods industry group is prerequisite for propelling the growth of the manufacturing sector in any country irrespective of its stage of economic development. The present paper seeks to assess the average rate of capacity utilization of Capital Goods Industry in India for a period of eleven years from 2001-02 to 2011-12. Top 57 companies taken from BT-1000 on the basis of market capitalization (dated November, 2012) form the sample of the study. The data accessed from Annual reports of the companies relating to actual production and installed capacity show that average rate of capacity utilization in Capital Goods Industry is 69.22% and Compounded Annual Growth is 0.77% during the time period under consideration. Rate of capacity utilization went up during the post reform period of 2001-02 to 2006-07, dropped in the recessionary years 2007-08 and 2008-09 and again started rising from the year 2009-10 onwards. This study also analyzes the averages of capacity utilization in sub-industries of Capital Goods Industry group. The results show that Non-Electric Machinery Group has capacity utilization of 73.71%, followed by Automobile and Transport Equipment Industry Group with 70.69% and then Electric Machinery Group at 65.63% and at last General Purpose Machinery Group with 65.53% capacity utilization. The Capital Goods Industry group witnessed near about 31% unutilized capacity due to certain bottlenecks like inadequate supply of critical inputs like power, coal, steel, transport, imported inputs, spare parts and components, over-aged plants, and lack of technological competence. These obstacles must be overcome to make our country self-reliant and move towards optimal utilization of available resources.
Keywords: Capacity Utilization, Capital Goods Industry, Production method, India.
Introduction
Capacity utilization is a key indicator in every industry group which not only helps to determine the level of utilization of existing capacity but also helps to define the required level of expansion of capacity for a targeted output. The broad concept of capacity employed means the maximum possible production with the available equipment during the year, assuming normal operative conditions (Chandrasekhar, 1990). The concept specifying capacity utilization measures the rate of utilization in terms of realized output relative to installed capacity (Seth, 1986). The optimal capacity utilization helps in generating additional jobs and it brings improvement in country’s trade balance (Ray, 2011). It helps to reduce the technological gap between the developing and the developed nations (UNIDO, 1970). Full utilization of installed capacity helps to control inflation in the economy and makes industrialization process more economical (Parwinder, 1992).
The growth and development of Capital Goods Industry is critical for India to achieve the vision of “Make in India” by increasing share of manufacturing in this sector up to 25% of Gross Value Added (Bhatia and Verma, 2012). The National Policy on Capital Goods Industry is visualized to unlock the potential of this promising sector and establish India as a global powerhouse of exporting capital goods. Capital Goods Industry is bedrock of every economy and serves as a catalyst for development and economic growth of a country. This industry group facilitates faster growth of other use based industry groups by providing them critical inputs. In India, Capital Goods Industry Group contributes 12% of total manufacturing activity. It has 1.8% share of GDP having market size of Rs. 3,12,000 crore in 2010-11 (Export-Import Bank of India, December 2012). The demand for capital goods has been witnessing a consistent growth, but unfortunately the trade deficit in this industry has been growing consistently with import of US $ 15 billion in 2012 (Report of Export-Import Bank of India, December 2012). Thus, nearly 1/3 of the domestic demand for capital goods is being gratified through imports. Hence, there is a need to assess capacity utilization in the Capital Goods Industry in order to have deeper insight into the problem of trade deficit in this vital sector.
Review of Literature
The issue of capacity utilization is an old concern among researchers. Budin et al. (1961) assessed the capacity utilization for the period 1951-59 of three Indian industry groups namely Consumer Goods, Intermediate Group and Infrastructural Industry Group. Capacity utilization of 91.53% in Infrastructure, 79.3% in Consumer Goods Industry and 62% in Intermediate Industry have been found, thus suggesting the existence of excess capacity in all the three industries. National Council of Applied Economic Research (NCAER) (1966) studied the capacity utilization in Metal and Non-Metal Industry Groups of India for the time period 1955-64. The results showed a capacity utilization of 89% in Metal and 79.28% in Non-Metal Industry Group during this period. Koti (1967) assessed capacity utilization for one year i.e. 1966-67 in Indian manufacturing sector by taking a sample of 151 companies. Companies belonging to Chemical Industry having capacity utilization of 60.50%, Fertilizer and Drugs with 75.95% capacity utilization, Rubber Steel Forgings with 91.40% capacity utilization and Textile with 75.48% had unutilized capacity varying between 30 to 40%. RBI Bulletin (1968) studied 62 Indian Industries for the time period 1961 to 1967 by using installed capacity method. Rate of capacity utilization declined in Basic Goods Industry from 12.7% in 1961 to 2.10% in 1967; in Capital Goods Industry it declined from 9% to 1% and in Consumer Goods industries from 7.51% to 3.58%. Klein et.al (1973) considered capacity utilization as attainable level of output that could be achieved under normal input conditions. The trend of capacity utilization in seven industry groups of United States had been assessed for five years from 1969 to 1973 by using output as a per cent of capacity. Industry Groups included durables, non-durables, manufacturing, mining & utilities, contract construction and services. They found that 47% of the companies operated under their preferred rate and 30% of the companies over the preferred rate and claimed that 23% of companies were operating either at the preferred rate or very close to it. Lovell (1968) studied the rate of capacity utilization in American manufacturing industries covering the period of 1949-63. The American Manufacturing Sector has been divided into 16 of industries namely Food, Tobacco, Textiles, Apparel, Paper, Printing and Publishing, Chemicals, Petroleum, Leather, Lumber and Wood, Furniture and Fixtures, Fabricated Metals, Machinery except Electricals, Electrical Machinery, Transportation Equipment and Instruments. By taking 1949-50 as base year, capacity utilization varied between 78% to 84% during 1949-50 to 1956-57, and between 89% to 95% during 1958-63. Sandesara (1969) analysed the capacity utilization into five Food Manufacturing Indian Industries i.e., Flour Milling and Grinding, Biscuit, Sugar (refined), Sugar Confectionery, Manufacture of Hydrogenated Oil (vanaspati). Data was collected for the period 1946-1966 from Monthly Statistics of the Production of Selected Industries of India. Capacity utilization was measured like production expressed as percentage of capacity output. The results showed more than full capacity utilization of 189·60% and 108·96% in Biscuit Industry Group and Refined Sugar respectively. A capacity utilization of 63·09% was found in Sugar Confectionery, 61·38% in Vanaspati and 38·82% in Flour Milling and Grinding. An improvement of capacity utilization rate was observed in all five groups of industries. Specifically it was above 9% in Biscuits and less than 1% in Hydrogenated Oil. Winston (1971) analyzed capacity utilization in Pakistani Manufacturing sector for the time period of 1961 to 1971. The results revealed 53% capacity utilization on the basis of adjustment in shift pattern. It was 50.4% in 1961, increased to 55.3% in 1965 then declined to 51.3% in 1967. It scored 55.3% and 54.3% in 1970 and 1971 respectively. Alagh and Shah (1972) classified Indian Industries into 16 major industry groups. Data was collected for input and output for the year 1967-68. Data of potential production, actual production and excess capacity was compared in these industry groups. The results showed excess capacity of greater than potential production near to 1/3rd in Transport Equipment and Non-Electrical Equipment sector whereas capacity of 1/3rd to 1/2 of potential production was found to be unutilized in Electrical Equipment, Iron and Steel, Leather and Leather Products, Food Industry, Jute Textiles, Chemical, Fertilizers and Glass, Wood and Non-Metallic Mineral Industries. Paul (1974) considered the economic concept of capacity as the output corresponding to the minimum point on the average cost curve of the manufacturing unit. He had taken time period of 1960 to 1970 and compared the annual rates of growth of installed capacity and utilization of installed capacity for three Indian groups of industries namely Consumer Goods, Intermediate Goods and Capital Goods. The average growth of installed capacity observed in all industries was 5·7% whereas utilization of installed capacity remained at 54·5%. He further divided these three broader groups of industries in 39 sub industry groups and collected data from Monthly Statistics of Production of Central Statistical Organization. The result showed that nearly half the industrial capacity in the country remained unutilized. In the period 1961-65 it remained at 54% which declined to 52% during the recession period 1966-68 and then again improved to 54% during 1969-71. Alauddin, et. al (1974) studied capacity utilization from a different perspective in Pakistani manufacturing industries for the year 1967-68. Optimal capacity utilization was defined by him as the level of output achievable if plant was operated for 7200 hours during a year. The average utilization of capacity was quite low, not exceeding even 40% under the most favourable conditions in Cotton Textile (35%), Electric Motors (39%) and Intermediate Industry (33%). The results revealed that 22% of Pakistani Manufacturing Industry had capacity utilization ranging from 20% to 40% and only 3% of industries based on indigenous material had capacity utilization about 80% to 100%. Average capacity utilization remained 44.39% in Consumer Goods Industry, Intermediate Goods and Capital Goods Industry Group. Ahmed (1978) had made an attempt to analyze the trends in output and capacity utilization in the manufacturing sector of Bangladesh for the period 1972/73 to 1976/77. He had taken indices of Industrial production as variable to check the trend of capacity utilization in 6 groups of industries namely, (1) Food, Beverage and Tobacco, (2) Textiles (3) Paper and Paper Products (4) Chemical and Rubber Manufactures (5) Non-Metallic Minerals (6) Basic Metal Industries. The data was retrieved from Bangladesh Bureau of Statistics. Overall industrial output appeared at 75% in 1972-73 but attained high level of 97.13% in 1976-77. The rate of capacity utilization level in most of the industries had tended to be low, reported as 15-20%. Bishwanath and Renganathan (1991) carried out an analysis of capacity utilization in 73 Indian industries for the time period 1981-82 to 1990-91. They reported that the trend of growth rate of capacity utilization in Indian Manufacturing came down from 1·89% p.a. to 1.28% p.a. during the period under study. Vishwanathan and Mukhopadhyay (1991) measured the capacity utilization for the period 1960-61 to 1984-85 for Cement Industry Group of India and found average capacity utilization of 68% during this time period. Srinivasan (1992) examined the levels of capacity utilization for Basic, Capital, Intermediate and Consumer Goods Industry Group by using time series data on capacity utilization for the time period of 1970 to 1984. Excess capacity 25 to 30% prevailed in these sectors during this time period. Burange (1992) computed capacity utilization for the organized sector of Indian economy during 1950-51 to 1986-87 by using weighted arithmetic mean. The study depicted that rate of capacity utilization increased from 65.97% in 1951 to 68.5% in 1955, then it revolved around 72.23% to 73.38% during 1956 to 1959, 68.6% to 77.41% during 1960 to 1969 and 69.13% to 73.66% during 1970 to 1987. Capital Industry Group especially Electric Machinery Group witnessed wide fluctuation in capacity utilization. It was 34.4% in 1951, 92.18% in 1967 and then weakened to 47.59% in 1973. It again improved to 79.17% in 1983 but again dropped to 73.32% in 1984 and to 55.98% in 1985. Ajit (1993) surveyed the trend of capacity utilization in Indian Manufacturing Sector over 1970-90. The underutilization was highest in Basic Goods Industry at 37% followed by 34% in Capital Goods Industry Group, 25% in Consumer Goods Industry Group and 10% in Intermediate Industry Group. Padma (1996) revealed capacity utilization for the period 1960-61 to 1982-83 for two industries - Basic and Capital Goods Industry Group. A capacity utilization of 67.63% was found in Basic Industry Group and 66.52% for Capital Industry Group. Uchikawa (2001) considered capacity utilization for the time period of 1979-80 to 1997-98 in industrial groups formed by National Industry Classification (NIC). The study witnessed investment boom after 1990 due to economic reforms which helped to create favorable environment for expansion of installed capacity. These reforms helped to raise output sharply but in proportion to that demand had not expanded as per the capacity which finally affected productivity of industries. The average rate of change in capacity utilization was 2.37% per annum in the post - reform period which was -1.39% per annum in the pre- reform period. Azeez (2001) used time series data for the assessment of economic capacity utilization of Non-Electric Machinery Group of Indian Industry for 1996-1998. Average capacity utilization of 67.88% was found in this group and variation in capacity utilization during this period was due to price fluctuation and cost condition. Erumban (2005) examined the trend of capacity utilization for the time period 1974-2000 in 32 sub industries of Indian Manufacturing Sector. The results showed that the phase of 1974-84 witnessed wide fluctuations revolving around 76.6%, while the phase of 1985-90 showed roughly stable level of utilization (80.6%) and 1991-2000 showed variant fluctuations (58%). Barik (2007) observed the rate of capacity utilization in Paper Industry in India for the time period of 1973-74 to 1997-98 by using data of Annual Survey of Industries. He found that capacity utilization had declined over a period from being 81.86% in 1973-74 to 70.53% in 1994-95. Gajanan (2007) analyzed rate of capacity utilization for 20 years i.e. from 1976-96. He revealed that the rate of capacity utilization ranged from 43% to 67% in industry group of Machinery and Equipment. The rates of capacity utilization were higher during 1976 to 1979 i.e.73%, dropped in mid-80s to 47% and started rising again from 49% to 60% in 90s. Kumar and Arora (2009) analyzed capacity utilization of Indian Sugar Industry for the time period of 1974-75 to 2004-05. Average amount of excess capacity in Indian Sugar Industry was 13% (approx.). Levels of capacity utilization followed the path of deceleration during the entire period of study. They used concept of capacity utilization as ratio of actual output to capacity output. They stated that 46.04% of more intermediary inputs and 15.8% more labors were required to attain the level of full capacity. Ray (2011) analyzed capacity utilization in Indian Drug and Pharmaceutical Industry. Capacity utilization was compared in two phases i.e. pre-reform period (1979-80 to 1990-91) and post reform period (1991-92 to 2007-08). Capacity utilization was 76.29% in 1979-80 which increased up to 88.77% in 1991-92 with growth rate of 8.24%. In post- reform period it was 88.35% in 1992-93 which increased to 95.93% in 2007-08 with growth rate of 6.92%. Mojekwu and Iwuji (2012) studied capacity utilization in Nigerian Manufacturing Sector for 1981-2009 by using data released by Central Bank of Nigeria (CBN) Statistical Bulletin. They found 73.3% capacity utilization in 1981 which reduced to 29.3% in 1995 and then improved to 54.3% in 2009. Ray (2012) measured the capacity utilization of Indian Automobile Industry econometrically. For this objective, production trend and sale trend of Indian Automobile Industry were analyzed for the time period 1991-92 to 2005-06. Data was collected from Annual Survey of Industries (ASI) and National Accounts Statistics (NAS). Percentage analysis was used to check the trend of capacity utilization as the ratio of actual output to capacity output. It was found that average of capacity utilization orbited around 38.19% to 73.59% during the time period under study. Saikia (2012) analyzed capacity utilization in 220 small scale industries of India. He used Wharton Index, Minimum Labour Output Ratio and Minimum Capital Output Ratio for measuring capacity utilization for the time period 2000-01 to 2008-09. The results measured by different methods showed a capacity utilization of 57.06%, 73.65% and 62.68% respectively. Average rate of capacity utilization remained at 63.86% with an average growth of 5.75%.
From the studies referred above, it can be concluded that most of the research has been conducted in Indian context by taking all manufacturing sectors collectively. None of the studies has focused on Capital Good Industry Group exclusively. After liberalization, privatization and globalization, more emphasis put on automation of industries in India. Therefore, greater need has arisen for machinery in every manufacturing industry making contribution of Capital Goods Industry more significant. Available data suggests that 30% of domestic demand for capital goods has been gratified by imports and that is a matter of great concern (CII Report on Export and Import, 2012). The review of available literature suggests that Indian Manufacturing Sector has excess potential in Capital Goods Industry, but this potential remains unused {Paul (1974), Srinivasan (1992), Burange (1992), Ajit (1993)}. Therefore, it is necessary and desirable to evaluate this sector with respect to its unutilized capacity.
The paper is divided into five sections. Section I is introduction to the topic, Section II gives a review of available literature. Section III discusses the data sources and research methodology employed. Section IV outlines the results of the analysis of Capital Goods Industry in India and its Sub-industries. Section V presents the conclusion.
Objectives of the study
The specific objectives of the study are:
- To measure the average capacity utilization of the Capital Goods Industry in India. The paper also evaluates the trends and growth rate in capacity utilization.
- To measure the average capacity utilization in sub industry groups of Capital Goods Industry and to determine the trends and growth rate of these groups in this area.
III. Database & Research Methodology
This section discusses the sample size, time period chosen, source of data, measurement method and the statistical tools used for analysis in the study.
Sample: BT-1000 Companies (dated November 4, 2012) form the universe of the study. These companies are ranked on the basis of market capitalization. Out of 549 companies belonging to the manufacturing sector, only 78 companies fall in the Capital Goods Industry. Since data for 21 companies was not available, so an effective sample of 57 companies was included and analyzed. These 57 companies have further been classified into four sub-industries of Capital Goods Industry group as per National Industrial Classification-2007. The Capital Goods Industry comprises of four sub industries namely Electrical Machinery, Non-Electric Machinery, General Purpose Machinery, and Automobile and Transport Equipment. The classification is shown as follows in Table 1:
Table 1: Sub- industry groups of Capital Goods sector
|
Serial No.
|
Sub industry group
|
No. of companies
|
|
1.
|
Electrical Machinery
|
13
|
|
2.
|
Non-electric Machinery
|
15
|
|
3.
|
General purpose Machinery
|
12
|
|
4.
|
Automobile & Transport equipment
|
17
|
|
|
Total
|
57
|
Time period: The present paper considers time period of eleven years from financial year 2001-02 to 2011-12. It is a very important period for the Indian economy. Excessive focus has been laid in upgrading technology and bringing automation during this period due to the advent of Liberalization, Privatization and Globalization in the economy. This time period is also critical for India as it witnessed the impact of global financial recession from 2006-07 onwards. An evaluation of capacity utilization during these eleven years would help to draw useful inferences.
Data Source: Secondary data required for calculating capacity utilization has been taken from the Annual Reports of respective companies. The reports were taken from the websites of companies. Help from Ministry of Corporate Affairs (MCA) was also sought in the context of collecting Annual Reports required for the period under study.
Measurement of Capacity Utilization:
Production function method has been used to measure capacity utilization. Under this method, capacity utilization is measured as the ratio of actual production to installed capacity. It can be formulated as:-
Capacity utilization (%) = Actual Production/Installed capacity ×100
This is an engineering estimate of capacity for a company/industry. Klein and Preston (1961), Ball and Smolensky (1961) and Sconfeld (1966) developed this approach where several inputs can be implicitly included in Capacity Utilization index by combining them in a production function. Sconfeld (1966), Klein, Lawrence R.(1973),Greenwald, Douglas; Edmonson, Nathan; Perry George(1985), Uchikawa (2001), Barik(2007), Ray (2012) in their studies have used this method. This method is simple too because of the ready availability of data from Annual Reports published by manufacturing companies. Also, Estimating Capacity Utilization through production function is certainly more reliable method as it takes into account all input and makes output as a function of not only capital input but labour inputs as well (Ray, 2012).
Statistical Technique Used:
Descriptive Statistics have been used to inference the trend of capacity utilization for all companies, Compounded Annual Growth Rate of capacity utilization and t-value have been used to check the growth from 2001-02 to 2011-12. These measures have been used in the studies conducted by Kumar(1982), Kaur (1997), Shergill and Sarkaria (1999), Kakani et al.(2001) and Sarkaria (2001), Aggarwal (2010).
To estimate the compounded annual growth rate of capacity utilization, the following model was used:
In Y=γ + β t + U (1)
Where
Y=value of the variable;
T= time variable;
U=stochastic disturbance term.
The compounded growth rate is worked out with the following formula:
R=(Antilogβ^-1)*100 (2)
Where β^ is the ordinary least square of β in model (1)
ANOVA test has been applied to check the significance of difference between the average capacity utilization of sub-industries and Post-hoc test has also been used to make multiple comparisons between these sub-industries of Capital Goods Industry.
Results and Analysis
Capacity Utilization in Capital Goods Industry in India
Average of capacity utilization for 57 sampled companies is presented in Table 2 as follows:
Table 2: Capacity Utilization in Capital Goods Industry
|
Year
|
Average
|
Growth rate
|
|
2001-02
|
64.34
|
-
|
|
2002-03
|
65.81
|
2.28
|
|
2003-04
|
68.55
|
6.54
|
|
2004-05
|
70.97
|
10.30
|
|
2005-06
|
71.55
|
11.20
|
|
2006-07
|
72.06
|
11.99
|
|
2007-08
|
69.81
|
8.50
|
|
2008-09
|
64.97
|
0.97
|
|
2009-10
|
65.87
|
2.38
|
|
2010-11
|
71.53
|
11.17
|
|
2011-12
|
75.99
|
18.11
|
|
CAGR
|
-
|
0.77
|
|
t-value
|
-
|
1.96
|
|
Average C.U.
|
69.22
|
-
|
|
Std.Deviation
|
3.65
|
-
|
Table 2 indicates the average of capacity utilization of Capital Industry Group, its growth rate and compounded annual growth rate. The average of capacity utilization is 64.34% in 2001-02 which increased marginally in 2002-03 to 65.81% and further rose to 68.55%, 70.97%, 71.55% and 72.06% in 2003-04, 2004-05, 2005-06 and 2006-07 respectively. However, the capacity utilization rate fell down to 69.81% in 2007-08 followed by further shrinkage of 4.84% in 2008-09 taking it as low as 64.97%. But in 2009-10, Capital Industry Group showed an increased capacity utilization average of 65.87%. This average further improved to 71.53% and 75.99% in 2010-11 and 2011-12 respectively. The Capital Industry Group has shown an overall average of 69.22% during the time period i.e. from 2001-02 to 2011-12.
The growth rate too has been calculated in Table 2 for Capital Goods Industry group by taking 2001-02 as base year. The growth rate which was 2.28% in 2002-03 rose significantly to 6.54%, then to 10.30%, 11.20% and 11.99% from 2002-03 to 2006-07 respectively. Then, it reduced to 8.50% in 2007-08 and to 0.97% in 2008-09 registering a substantial downfall, but thereafter it marked extensive growth in 2010-11 and 2011-12 by scoring 11.17% and 18.11% respectively. Compounded annual growth rate is 0.77% and t- value in Capital group is 1.96 which is significant at 5% degree of freedom.
The bird’s eye view of average capacity utilization and growth rate of Capital Goods Industry Group is presented graphically as follows:
Graph 1: Average Capacity Utilization and Growth Rate of Capital Goods Industry
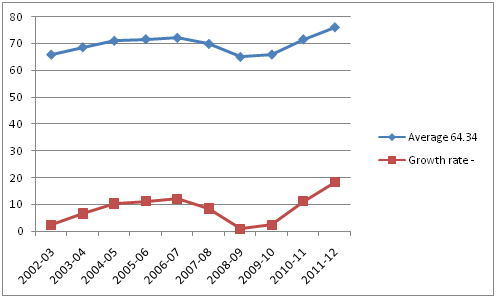
Graph 1 given above indicates the growing trend of capacity utilization from 2002-03 to 2006-07 along with the rising growth rate. The graph supports the results indicated in Table 2 and shows increasing trend from 2002-03 to 2006-07, but a dip in average capacity utilization from 2007-08 to 2008-09. After 2008-09, these averages show an upward trend towards capacity utilization by this industry till 2011-12.
The growing averages of capacity utilization in Capital Goods Industry group from 2001-02 to 2006-07 is indicative of the post effects of the regime of liberalization, privatization and globalization. As a result of that, this industry received portfolio investments, NRI deposits and External Commercial Borrowings helped it to improve the level of installed capacity and its utilization from 2003-04 onwards (Patnaik, 2007). This resulted in increase in growth rate of capacity utilization by 4.26% in 2003-04 and 3.76% in 2004-05. Also, during 2002-03 to 2006-07, there was a significant increase in capital flows to India. These investments were also exempted from capital gains tax in the financial budget of 2003-04 (CII Report, 2005). This gave a positive stimulus to Capital Goods Industry and helped it to achieve higher growth in capacity utilization. Due to economic reforms, there was growth in economic parameters as well as Gross Domestic Product (GDP) which increased from 5.39% in 2001-02 to 7.97% in 2003-04, to 9.48% in 2005-06 and further to 9.57% in 2006-07 (CSO Release, 2010). Simultaneously industry growth rate too showed intensification from being 2.61% in 2001-02 to 7.32% in 2003-04 and 9.72% in 2005-06 and still elevating to 12.17% in 2006-07 respectively (RBI Bulletin, March 2010). These economic parameters indicated that Capital Goods Industry Group improved its capacity utilization extensively.
The occurrence of subprime crisis which had gripped the industrial sector had an impact on the Capital Goods Industry as well. The same is evident from the growth rate of capacity utilization which slipped from 11.99% to 8.50% from 2006-07 to 2007-08 followed by extensive cut of 7.53% in 2008-09. The withdrawal of FIIs investments, appreciation of the US dollar as against the Indian rupee and other major currencies also created snags for this industry during the period 2007 to 2009 ( RBI report, April 2010). The year 2008-09 was the most abnormal year as there was a dip in investment in every industry during this year and even the rate of growth of gross fixed capital formation declined tremendously in 2008-09 (Economic Survey Report, 2009-10). It was 13.6% in 2003-04, touched the level of 20.7% in 2004-05 but came down to 3.5% in 2008-09 (CSO Release, 2014). It adversely cast its shadow on the average rate of capacity utilization.
From 2009-10 onwards, growth rate of gross capital formation had increased by 32.45% in 2009-10 and 43.8% in 2010-11 (CSO data, 2012) which seemed to help Capital Goods Industry Group to revive faster and achieve growth rate of 11.17% in 2010-11 and 18.11% in 2011-12 respectively. On the whole, Capital Goods Industry achieved an average of 69.22% level of capacity utilization during the period of 2001-02 to 2011-12. Thus, there is considerable unutilized capacity of approximately 30% in Capital Goods sector. These seem to be due to some unavoidable reasons like breakdown of machinery (Mulega and Weiss, 1996), inadequate supply of critical inputs (Antony, 1992), inequitable allocation system for scarce raw material and imported components (Padma, 1996), lack of technical skill and managerial ability (Saikia, 2012) etc. Volatility in prices of raw material, increased competition faced from imports and uncertainty of economic environment, infrastructure problems like power, transport and communication also affected the efficiency of Capital Goods Industries (FICCI survey on Indian manufacturing sector, 2011). India’ share of R&D was 0.9% of GDP in 2011 whereas China held twice the share at 2% (EXIM Report, 2012). Indian Capital Goods Industry has very low share in total expenditure on Research and Development as compared to other countries, perhaps that’s why competency of Indian technology in this sector is, limited (EXIM Report, 2010). The technologies used for production of capital goods are not updated in time with changing trends. This technology gap keeps widening and crippling all sub industry groups. Capacity constraints and delivery schedules in Indian Capital Goods sector are longer than in their foreign counterparts (FICCI report on Indian Manufacturing Sector, 2010). All these factors further lead to increase in the excess capacity in the industry.
Capacity Utilization in Sub-industries of Capital Goods Industry Group
Since Capital Goods Industry shows excess capacity of 30% (approx.), the Capital Goods Industry Group is classified into sub-industries as per National Industrial Classification-2007, in order to analyze as to which sub industry can be held responsible for underutilization of capacity.
The average rate of Capacity Utilization, Growth Rate and Compounded Annual Growth of these four sub industries is calculated and shown in Table 3 as follows:
Table 3: Capacity Utilization in Sub Industry Groups of Capital Goods Industry
|
|
Electrical Machinery
|
Non-Electric Machinery
|
General Purpose Machinery
|
Automobile & Transport Equipment
|
|
Year
|
Average
Electrical Machinery
|
Growth rate
|
Average Non-Electric Machinery
|
Growth rate
|
Average
General
Purpose Machinery
|
Growth rate
|
Average
Automobile & Transport Equipment
|
Growth rate
|
|
2001-02
|
60.55
|
-
|
62.54
|
-
|
58.16
|
-
|
67.68
|
-
|
|
2002-03
|
66.95
|
10.57
|
71.72
|
14.68
|
59.82
|
2.85
|
66.45
|
-1.82
|
|
2003-04
|
66.31
|
9.51
|
68.74
|
9.92
|
60.45
|
3.94
|
71.27
|
5.30
|
|
2004-05
|
61.31
|
1.25
|
78.87
|
26.11
|
65.81
|
13.15
|
74.65
|
10.29
|
|
2005-06
|
65.53
|
8.23
|
78.81
|
26.02
|
71.33
|
22.64
|
72.72
|
7.45
|
|
2006-07
|
64.29
|
6.17
|
77.55
|
24.00
|
68.00
|
16.92
|
75.16
|
11.05
|
|
2007-08
|
67.60
|
11.64
|
78.12
|
24.91
|
67.88
|
16.71
|
69.56
|
2.78
|
|
2008-09
|
61.97
|
2.34
|
76.47
|
22.27
|
62.57
|
7.58
|
64.54
|
-4.64
|
|
2009-10
|
65.92
|
8.87
|
67.46
|
7.87
|
63.02
|
8.35
|
66.18
|
-2.22
|
|
2010-11
|
68.96
|
13.89
|
72.82
|
16.43
|
69.02
|
18.67
|
72.93
|
7.75
|
|
2011-12
|
72.49
|
19.72
|
77.72
|
24.27
|
78.80
|
35.49
|
76.48
|
13.00
|
|
CAGR
|
-
|
0.962
|
-
|
0.932
|
-
|
2.155
|
-
|
0.387
|
|
t-value
|
-
|
2.216
|
-
|
1.302
|
-
|
3.104
|
-
|
0.684
|
|
Average C.U.
|
65.63
|
-
|
73.71
|
-
|
65.53
|
-
|
70.69
|
-
|
|
Standard Deviation
|
3.52
|
-
|
5.51
|
-
|
6.51
|
-
|
4.06
|
-
|
Table 3 depicts that Electrical Machinery Group having 13 companies has capacity utilization rate of 65.63% for the time period 2001-02 to 2011-12 with CAGR of 0.962%. This sector witnessed many ups and downs during this period covered under study. Rate of capacity utilization in 2001-02 was 60.55%. It increased sharply to 66.95% in 2002-03 with growth rate of 10.57% followed by slight downfall of 1.06% in 2003-04. It again got disrupted in 2004-05 and fell to 61.31%. An evident increase in rate of capacity utilization was observed in 2005-06 with improved growth rate of 8.23%. In 2006-07, the rate of capacity utilization again decreased to 64.29% having growth of 6.17%. In 2007-08, this sector scored 67.6% capacity utilization with a tremendous growth rate of 11.64% followed by apparent fall of 9.3% in growth rate in 2008-09. The trend recovered by showing capacity utilization of 65.92% along with growth rate of 8.87% in 2009-10, 68.96% in 2010-11 and 72.49% in 2011-12 with growth rate of 13.89% and 19.72% respectively. Standard deviation of this group is 3.52 with t-value of 2.216 which is significant at 5% level of degree of freedom.
Non-Electric Machinery Group comprises of 15 companies. This group has average capacity utilization of 73.71% and CAGR of 0.932%. Average rate of capacity utilization is 62.54% in 2001-02 which is taken as base year. It increased to 71.72% in 2002-03 along with growth rate of 14.68%. In 2003-04, rate of capacity utilization fell down to 68.74% indicating decreased growth rate of 4.76%. Rate of capacity utilization is 78.87% in 2004-05 with growth rate of 26.11% followed by slight decrease of 0.09% in 2005-06. Then rate of capacity utilization again witnessed drop in capacity utilization by scoring 77.55% average with growth rate of 24% followed by little downfall of 0.57% in 2007-08. In 2008-09, the rate of capacity utilization decreased to 76.47% with growth rate of 22.27%. Then year 2009-10 marked tremendous fall of 9.01% in capacity utilization with growth rate of 7.87%. The trend of capacity utilization started recovering from 2010-11 by showing increment of 5.36% in capacity utilization and growth rate up to 16.43% followed by an evident increase in 2011-12 up to 77.72% with growth rate of 24.27%. Standard deviation of this group is 5.51 with t-value of 1.302 which is not significant at 5% level of degree of freedom.
General Purpose Machinery consisting of 12 companies shows an overall average of 65.53% for 2001-02 to 2011-12 with CAGR of 2.155%. In 2001-02, this group has capacity utilization of 58.16% which increased to 59.82% followed by growth rate of 2.85% in 2002-03. It increased to 60.45% in 2003-04, 65.81%, 71.33% in 2004-05 and 2005-06 with growth of 13.15% and 22.64% respectively. The average of capacity utilization got disrupted in 2006-07 and fell to 68% with fall in growth rate to 5.72% followed by again slight drop in capacity utilization of 0.12% in 2007-08 and 5.31% in 2008-09. From 2009-10, this trend showed improvement and scored 63.02% capacity utilization in 2009-10 followed by 69.02% in 2010-11 with marvelous increase of 10.32% in growth rate which surprisingly increased to 78.8% capacity utilization in 2011-12 with 35.49%. This group has standard deviation of 6.51 and t-value is 3.104 which is significant at 5% level of degree of freedom.
Automobile & Transport Equipment having 17 companies shows average rate of capacity utilization for 2001-02 to 2011-12 to be 70.69% with CAGR of 0.684%. This group witnessed many ups and downs in growth of capacity utilization. In 2001-02, the rate of capacity utilization is 67.68% which decreased to 66.45% in 2002-03 with negative growth rate of 1.82%. The rate of capacity utilization started improving in 2003-04 with capacity utilization of 71.27% in 2003-04 with growth rate of 5.3% which indicates good increase in 2004-05 to 74.65% rate of capacity utilization with growth rate of 10.29%. In 2005-06, the rate of capacity utilization decreased to 72.72% witnessing downfall in growth rate to 2.84%. In 2006-07, it improved a little bit by achieving growth of 3.60% which further decreased by 5.60% in 2007-08 having capacity utilization of 69.56%. The average further decreased in 2008-09 to 64.54% capacity utilization with negative growth rate of 4.64%. From 2009-10, the trend gained improvement to 66.18% in 2009-10 followed by further increase to 72.93% in 2010-11 with growth rate of 7.75%. An evident increase of 5.25% in growth rate with capacity utilization of 76.48% has been scored in 2011-12. This group exhibited standard deviation of 4.06 with t-value at 0.684 which is not significant at 5% level of degree of freedom.
Average rate of capacity utilization of four sub-industry groups is presented graphically in Graph 2.
Graph 2: Average Rate of Capacity Utilization in Sub-Industry Groups
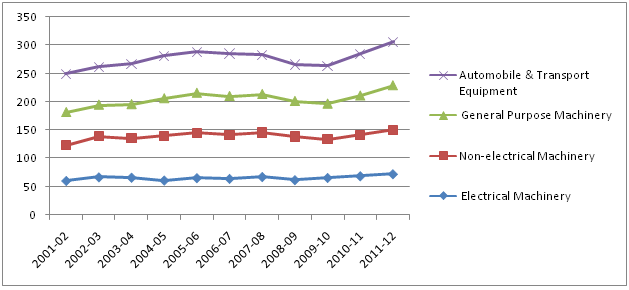
The above graph indicates the trend of capacity utilization for sub-groups of Capital Goods Industry Group for the time period of 2001-02 to 2011-12. It is evident from the graph that Capacity utilization has increasing trend till 2006-07 but the graph faces a dip in 2007-08 and 2008-09 for all the sub-industries. This trend begins to recover from 2009-10 onwards. Average rate of capacity utilization witnessed more ups and downs in the trend of Automobile & Transport Equipment followed by General Purpose Machinery Group, and then Non-Electric Machinery Group.
Rate of growth in capacity utilization of sub industry groups is also presented in Graph 3.
Graph 3: Growth Rate of Capacity Utilization in Sub-Industry Groups
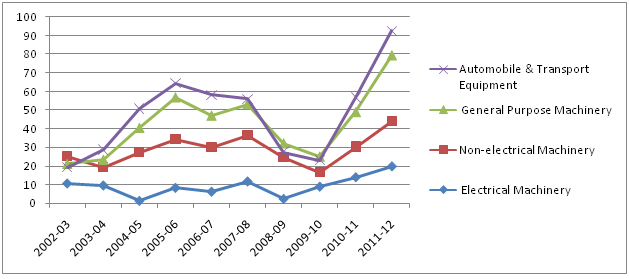
Graph 3 indicates more fluctuations in growth of capacity utilization of Automobile & Transport Equipment, followed by General Purpose Machinery Group, then Non-Electric Machinery Group. Least fluctuation is noticed in Electrical Machinery Group.
It is observed that the average rate of capacity utilization differs across sub-industries. In order to check if the variations in average capacity utilization in four sub-industry groups are significant or not; ANOVA has been applied. It is hypothesized that there is no significant difference among the average capacity utilization of sub-industries. The results of analysis are shown in Table 4.
Table 4: Results of ANOVA in Sub- industry Groups of Capital Goods Industry
: Results of ANOVA in Sub- industry Groups of Capital Goods Industry
|
Model
|
Sum of Squares
|
D.F.
|
Mean Square
|
F
|
Significance
|
|
Regression
|
533.02
|
3
|
177.67
|
6.987
|
.001*
|
|
Residual
|
1017.19
|
40
|
25.43
|
|
|
|
Total
|
1550.21
|
43
|
|
|
|
Level of significance: 0.05
Table 4 evaluates the acceptability of the model from a statistical view point. The value of F=6.987 at P<0.05 which indicates the rejection of null hypothesis. It is concluded that there is significant difference in average capacity utilization of four sub-groups of Capital Goods Industry. Post- hoc test has also been applied to make multiple comparisons among all sub-industries and its results are shown as given in Table 5 below:-
Table5: Results of Post-Hoc Test
|
Multiple Comparisons
|
|
Industry
|
Industry
|
Mean Difference
(I-J)
|
Std. Error
|
Sig.
|
95% Confidence Interval
|
|
Lower Bound
|
Upper Bound
|
|
Electrical
|
Non-Electric Machinery
|
-8.08545*
|
2.15025
|
.007*
|
-14.3605
|
-1.8105
|
|
General Purpose Machinery
|
.09818
|
2.15025
|
1.000
|
-6.1768
|
6.3732
|
|
Automobile & Transport Equipment
|
-5.06727
|
2.15025
|
.153
|
-11.3423
|
1.2077
|
|
Non-Electric Machinery
|
Electrical
|
8.08545*
|
2.15025
|
.007*
|
1.8105
|
14.3605
|
|
General Purpose Machinery
|
8.18364*
|
2.15025
|
.006*
|
1.9086
|
14.4586
|
|
Automobile & Transport Equipment
|
3.01818
|
2.15025
|
.583
|
-3.2568
|
9.2932
|
|
General Purpose Machinery
|
Electrical
|
-.09818
|
2.15025
|
1.000
|
-6.3732
|
6.1768
|
|
Non-Electric Machinery
|
-8.18364*
|
2.15025
|
.006*
|
-14.4586
|
-1.9086
|
|
Automobile & Transport Equipment
|
-5.16545
|
2.15025
|
.141
|
-11.4405
|
1.1095
|
|
Automobile & Transport Equipment
|
Electrical
|
5.06727
|
2.15025
|
.153
|
-1.2077
|
11.3423
|
|
Non-Electric Machinery
|
-3.01818
|
2.15025
|
.583
|
-9.2932
|
3.2568
|
|
General Purpose Mmachinery
|
5.16545
|
2.15025
|
.141
|
-1.1095
|
11.4405
|
Level of significance: 0.05
Table 5 indicates that there is significant difference in average capacity utilization of Non-Electric Machinery Group with Electrical Machinery Group followed by General Purpose Machinery Group with Non-Electrical Industry Group at 5% level of significance.
Non- Electric Machinery Group witnessed average rate of capacity utilization of 73.71% during 2001-02 to 2011-12. This sector attributed high growth in domestic demand for non - electrical goods (Kumar 2008, Nagaraj 2008). This perhaps led to double digit growth during the time period of 2001-02 to 2007-08. Export of this industry achieved high growth rate of about 38% during 2003-04 to 2006-07 (Keshari, 2012) which seemed to boost the level of capacity utilization. But inspite of this, this industry has excess unutilized capacity of 26.29%, perhaps due to less FDI as compared to other industries, less average research and development intensity and operational inefficiencies and infrastructure bottlenecks (Report on Non-Electric Machinery Industry, 2012).
Automobile & Transport Equipment industry standing after Non-Electric Machinery had started new journey because of delicensing under Liberalization, Privatization and Globalization and subsequent approval of 100% FDI through automatic route (CSO Report, 2003). This sector has 70.69% capacity utilization during 2001-02 to 2011-12. The increasing competition in auto companies resulted in multiple choices for Indian customers which forced this sector to improve its productivity (Ray, 2012). From 2002-03 onwards, Government also contributed to the growth of this industry by liberalizing the norms for foreign investment. Removal of restrictions on imports of spare parts, advanced technology and reduction of tariff rates added to the advantage of this sector and improve the rate of its capacity utilization (Ray, 2012). But the impact of global financial recession took its toll which was evident in decline of local as well as international demand of goods produced by this industry group (Singh & Mahajan, 2012). This dip was also due to weak supplier base for small components, lack of know-how, import tariffs and fluctuations in currency exchange rate resulting into less capacity utilization (Mahindra & Mahindra Ltd., Annual Report 2008). From 2010-11 onwards, this industry started to recover. Investment in this sector has been around Rs. 10000 crore during 2010-11 which helped this industry to improve its rate of capacity utilization (Report of Automotive Component Manufacturers Association of India, 2012). Its average rate of capacity utilization scored up to 76.48% in 2011-12. This aided in transformation of this sector from a local supplier to a global Auto parts supplier. It also resulted in export of this sub- industry group at the CAGR rate of 39% (FICCI survey, 2011) and destination of exports included SAARC countries, United Kingdom, Belgium and Germany (Economic Survey Report, 2012).
Electrical Machinery group has average rate of 65.62% capacity utilization with 34.38% unutilized capacity. Electrical Machinery group has undertaken activities like upgradation of Plant and Machinery and extension of installed capacity which helped to improve the rate of capacity utilization in the pre-recession period (MICR Electronics Ltd., Annual Report 2005-06). United States had invested US$ 2043 Billion and US$ 1567.4 in 2002-03 through FDI in Machinery Sector (Economic Survey Report, 2008). Removal of tariff protection, delicencing of electrical industry and allowance of 100% FDI, infrastructure development and reduction of custom duty on various equipment contributed positively in improving its rate of capacity utilization (Report of Department of Heavy Industries, 2012). Hundred percent FDI facilitated the entry of global players with advanced technology. This huge push elevated the growth rate of installed capacity but still its utilization did not increase at same rate, rather it felt as a threat for domestic manufacturing companies having low technological competitiveness (Economic Survey Report, 2010).
General Purpose Machinery Group attained 65.53% capacity utilization witnessing 34.47% unutilized capacity. The challenge for this industry is increasing dependence on imports of spare parts and direct import of machine tools and of finished machinery which has been increased up to 65% of total demand because Indian companies could not keep pace with the technology advancement around the globe (Report by Working Group on Capital Goods and Engineering sector, 2011). Some other reasons for the slowdown include low unit size, taxation and FDI regime favouring imports and skill scarcity (Economic Survey Report on Machine Tools Industry, 2011).
An observation suggests that during 2007-08 all the sub-industries show a retarded utilization of capacity. But from 2009-10, Gross banking credit was increased by 20% as compared to 4.6% in 2008-09 (FICCI Survey Report, 2010) which helped them in overcoming the financial obstacle and improved capacity installation and utilization.
Conclusion
Capacity utilization is a preliminary but a prominent indicator of the health of an industry. But the results of the present study suggest that Capital Goods sector could never reach the level of full utilization of capacity in any of the years under study. For the revival of Capital Goods Industry Group, precautionary steps are required. Speedy clearance of projects, especially, infrastructure projects should be ensured. Dis-incentivizing in import of second hand machinery and more Research and Development facilities for the development of indigenous machinery will definitely help in extending capacity utilization. Curbing volatility of exchange rate, easing of monetary policy and improving liquidity in the market by reducing interest rates that would help to bring down inflation must be taken up by the Indian Government (FICCI survey on Indian Manufacturing sector, 2011). Dynamic plant design, efficient management team and sound industrial relations are also required to improve the rate of capacity utilization (Singh, 2011). Quality of products through intense Research and Development activities, operating efficiency in processes, and labour productivity must be focused upon. FDI inflows for technology transfer and periodical up gradation in technology, eco friendliness and technical support in transportation would also help to increase the level of capacity utilization in all sub industry groups which contribute to maintain the strength of Indian Capital Goods Industry.
Under the leadership of Shri Narinder Modi, the process of economic upheaval of India has taken new dimensions. The focus of the Government on Infrastructure, Power Transmission, etc. offers a good opportunity to Capital Goods Industry to improve its growth and profitability in future by utilizing its capacity to the maximum. The vision of making India as Economic Super Power under the programme of “Make In India” is possible only if Indian Government lifts up the level of capacity utilization leading to the elevation of this vital sector in the country.
References:
Ajit, D. (1993). Capacity Utilization in Indian Industries. Reserve Bank of India Occasional
Papers, March, Vol. 14, No. 1
Azeez, E. A.(2002). Economic Reforms and Industrial Performance: An Analysis of Capacity
Utilization in Indian Manufacturing. Indian Journal of Economics and Business, December, vol.4 (2).
Barik, Kaustava (2007). Capacity utilization in Indian paper industry, Working paper, School of Social Science, Indira Gandhi National Open University.
Budin, M and S.Paul (1961). The Utilization of Indian Industrial Capacity (1949-1959). Indian Economic Journal,
Burange, L.G. (1992). Trends in Capacity Utilization in Indian Manufacturing Sector (1951-1986). Journal of Indian School of Political Economy,
Divatia, V.V and Ravi Varma (1970). Index of Potential Production and Potential Utilization
Ratio for the Manufacturing Industries in India. Reserve Bank of India Bulletin, April, 1970.
Gajanan, S., and D. Malhotra (2007). Measures of Capacity Utilization and its Determinants:
A Study of Indian Manufacturing. Applied Economics, Vol. 39, No.6.
Goldar, B. and V.S.Renganathan (1991). Capacity Utilization in Indian Industries. Indian Economic Journal.
Kemal, A.R. and Talat Alauddin (1974).Capacity Utilization in Manufacturing Industries of Pakistan. The Pakistan Development Review, Vol. 13, No. 3.
Koti, Raghunath (1967). Utilization of Industrial Capacity in India (1967-68). Gokhale Institute of Politics and Economics.
Kumar, Sunil and Nitin Arora (2009). Analyzing Regional Variations in Capacity Utilization of Indian Sugar Industry using Non-parametric Frontier Technique, Eurasian Journal of Business and Economics, 2 (4).
Morrison, C.J (1985). On the Economic Interpretation and measurement of optimal capacity, Review of Economic Studies LII.
Padma. Suresh, M (1991). Economic measure of capacity utilization in some selected industries in India: 1960-61 to 1982-83, Delhi School of Economics.
Paul, S. (1974). Industrial Performance and Government Controls. The Indian Economy: Performance and Prospects, University of Bombay.
National Council of Applied Economic Research (2001). Business Cycle Indicators in the
Indian Economy. http://www.ncaer.org/annual_reports.php
Report of the Reserve Bank of India, October. Accessed on March, 2016. https://rbi.org.in/Scripts/PublicationReportDetails.aspx?UrlPage=&ID=785
Ray, Sarba P. (2011). Measuring Capacity Utilization and Evaluating The Impact of Liberalization on Capacity Utilization of Indian Drug and Pharmaceutical Industry, Journal of Emerging Knowledge on Emerging Markets, Volume 3, November 2011.
Ray, Subhas.C and Kankana Mukherjee (2005). Direct and Indirect measures of capacity utilization:A non-parametric approach of US manufacturing, The Manchester School, Vol.74, July 2006 Emerging
Morrison, C.J.(1985). On the Economic Interpretation and Measurement of Optimal Capacity
Utilization with Anticipatory Expectations. Review of Economic Studies, Vol.52, No.2 (1985).
Nag, S.P. (1961)..Under-Utilization of Installed Capacity in the Cotton Textile Industry in India. Indian Economic Review, Vol. 5, No.3, pp. 274-284.
Ray, S. and Pal, M.K. (2008). On the Measurement of Capacity Utilization: An Evidence from Indian Chemical Industry. ArthaVijnana, Vol. 50, No.2, pp. 116-128.
Sandesara, J.C. (1969). Capacity Utilization in Indian Industry: A Study of the Food Manufacturing Industries. Indian Journal of Industrial Relations, Vol. 5, No.1, pp. 28-38.
Reserve Bank of India (2010). An Estimate of Capacity Utilisation – Manufacturing Sector.
RBI Bulletin, August.
Report of Confederation of Indian Industry and Department of Heavy Industry (2007) http://dhi.nic.in/writereaddata/WG_CGES_rep_2002-07.
Report by Boston Consulting Group and CII (2010). Indian Manufacturing: The Next Growth Orbit.
Report of the Working Group on Economic Indicators, Reserve Bank of India, June 28, 2002.
Report of United Nations Industrial Development Organization (1970) accessed on December, 2012
http://www.unido.org//fileadmin/user_media/Publications/Research_and_statistics/Branch_publications/Research_and_Policy/Files/
Report of Export Import Bank of India accessed on February, 2013 http://www.eximbankindia.in/sites/default/files/ar1213_0.pdf
Report of FICCI (2010) accessed on August, 2014
http://ficci.in/SEdocument/20271/FICCI-MANUFACTURING-SURVEY-REPORT.pdf
Report of FICCI (2013) accessed on March, 2015 http://ficci.in/SEdocument/20315/MANUFACTURING-SURVEY-REPORT-nov13.pdf
Report of FICCI (2012) accessed on December, 2015 http://ficci.in/SEdocument/20286/MANUFACTURING-SURVEY-REPORT-2012.pdf
Report of Export –Import Bank of India (2012) accessed on March, 2016 http://www.eximbankindia.in/sites/default/files/newsletter/ea-dec12
Saikia, Hemanta (2012). Capacity Utilization in Small Scale Industries of India: Some Empirical Evidences From Underdeveloped Industrial Structure, No.1, Vol.1, Summer 2012.
Seth. Vijay.K (1998). Economic Reforms and Capacity Utilization in Indian Industry Productivity, October –December, 1998.
Srinivasan, P.V, (1992). Excess capacities in Indian industries –Supply or demand constraints, Economic and Political Weekly. Nov.1992.
Uchikawa, S.(2001). Investment boom and underutilization of capacity in the 1990s. Economic and political weekly, August 25, 2001.
Vishvanathan.U and H. Mukhopadhyay (1991). On the measurement of capacity utilization: The case for the Cement industry in India, Paper presented at the Annual Conference of the Econometric Society, New Jalpaiguri .

