Pacific B usiness R eview I nternational

A Refereed Monthly International Journal of Management Indexed With THOMSON REUTERS(ESCI)
|
Rishi Vaidya Research Scholar Devi Ahilya Vishwavidyalaya, Indore Indore, Madhya Pradesh, India Contact No.:- 098276 36367 E-mail:-vaidya.rishi18@gmail.com |
Dr. Kamaljeet Bhatia Principal SDPS Women’s College of Commerce & Management Indore, Madhya Pradesh, India Contact No:- 098939 20035 E-mail:- kbhatiavitm@gmail.com |
Dr. N. K. Totala Reader Institute of Management Studies Devi Ahilya Vishwavidyalaya, Indore Indore, Madhya Pradesh, India Contact No.:- 098265 07017 E-mail:- navindratotla@gmail.com |
Reserve Bank of India plays a major role in guiding and directing banks to establish and maintain a risk management system of international standards. Banks in India have well designed systems and procedures to handle credit risk, market risk and operational risk system. The present study was conducted to find the impact of Basel II Accord on the stability of Indian public and private banks. The sample size included 26 public sector banks and 20 private sector banks. The study finds that most of the banks follow the standardised approach as per the guidelines of the Reserve Bank of India to cover the operational risk, credit risk and market risk. It has also been found that the public sector banks have gone in for further issue of equity shares to enhance their capital adequacy ratio. Several banks running on the brink of very low or sometimes even negative profitability have been permitted by the government to write-off their losses against their paid-up capital.
Keywords: Basel II, Capital, Credit Risk, Market Risk, Operational Risk
Banking is one of the most heavily regulated businesses since it is a highly leveraged (high debt-equity ratio or low capital-assets ratio) industry. In fact, it is satirical that banks, which invariably appraise their borrowers based on debt-equity ratio, themselves have a debt-equity ratio far too contrary to that of their borrowers. In simple terms, banks earn by undertaking risk on their creditors’ money rather than on that of their shareholders’. Their appetite for risk needs to be controlled, as the money involved is not that of their shareholders’. As stated by Bernanke (1983), Keeley (1990), Calomiris and Mason (2003a, b) and the global financial crisis, banks’ risk-taking behavior affects economic and financial fragility. Allen and Carletti (2010), Brunnermeir (2009), Greenlaw, et al, (2008) and Taylor (2009) provide an exhaustive overview of the causes preceding and accompanying the global financial crisis.
Basel II was envisioned to align regulatory capital requirements with the existent risk associated with banks’ assets, computed with latest risk management techniques. Basel II was proposed to increase regulatory capital for lower rating classes and, as a result, several observers expressed their concern that bank lending to emerging markets would decline (Reisen, 2001 and Griffith-Jones, 2003).
The Basel II Accord though extended the previous approach of calculating the capital requirements based on the Merton model, it introduced a new technique based on the Asymptotic Risk Factor Model (ASRFM). It takes into account the company’s situation on the market, expressed by the rating and the probability of default, describing the risk level. Basel II requires financial institutions obligor to hedging all their contracts by different amounts of capital contributions depending on the customer’s credibility. It takes into account everything that was omitted in the Basel I Accord. Due to that, the ASRFM and all models recommended by Basel II give better estimate.
According to BCBS, International Convergence of Capital Measurement and Capital Standards, A Revised Framework Comprehensive Version introduced in 2006 (also known as Basel II) is a revised version of the 1988 Basel I document. It seeks to improve risk calculation in capital measurement by introducing three prominent pillars (Figure 1).
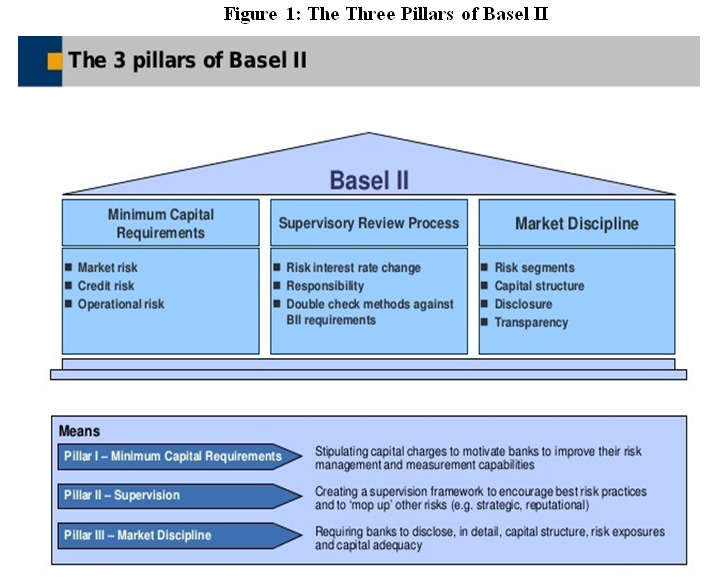
Pillar I improves the computation of regulatory capital in three significant ways. First, it uses a more granular approach to credit-risk weights; second, it provides banks (subject to the regulator’s approval) with a choice of methods for calculating risk weights for certain types of risk; and third, it incorporates operating risk into the capital requirement.
The second pillar supplements provisions of the first pillar by organizing the supervision of regulators in order to ensure the soundness of bank’s internal processes of risk evaluation. Implementation of the Pillar II is believed to be very demanding, as the new Accord proposes changing of traditional methods of supervision by shifting from rules to standards.
In the third and the last pillar disclosure requirements are used as a mean of enhancing market discipline. The logic introduced in this pillar assumes that well-informed market participants will reward risk aware management and thereby exert pressure on banks to improve their systems and not take on additional risk.
An attempt has also been made to conceptualise the issues that are covered in the present study. A review of this nature is a pre-requisite, not only for sharpening the methodology, but also for conducting the study as well as for drawing meaningful inferences from the results obtained from the present study. The purpose of this part is to understand the results of various studies already undertaken in the relevant field and to find out the research gap in the present study.
Ito & Sasaki (1998) in their study “ Impacts of the Basle Capital Standard on Japanese Banks’ Behavior ” examined how the Basel Accord influenced the 87 Japanese banks’ behavior between 1990 and 1993, a critical transition period for Japanese banks in their attempt to achieve the international standard. The results suggested that Basel Accord had a significant impact on bank’s behavior. Banks with lower capital ratio made less bank loans and they issued more subordinated debts (Tier II). During this period credit crunch existed. The risk based capital requirement had a large impact on city banks’ lending behavior, while lending behavior of trust banks’ had most affected by non performing loans.
Nag & Das (2002) in “ Credit Growth and Response to Capital Requirements: Evidence from Indian Public Sector Banks ” studied the impact of imposition of capital requirement norms on flow of credit to the business sector by the Indian public sector banks for the period 1996-2000. The study considered demand side and supply side variables as explanatory variables and credit growth was taken as dependent variable during the period under study. The study concluded that in the post reform period public sector banks did shift their portfolio in a way that reduced their capital requirements and adoption of stricter risk management practice in respect of bank lending in post reform period and its interplay with minimum capital requirements (regulatory pressure) have had a dampening effect on overall credit supply.
Van Roy (2003) in his paper “ The impact of the 1988 Basel Accord on banks’ capital ratios and credit risk-taking: an international study ” studied the impact of 1988 Basel Accord on behavior of banks of seven G-10 countries towards Capital Ratios, Portfolio risk and relationship between changes in capital and risk ratios. The data set was used for 586 commercial banks from seven G-10 countries with assets of more than $ 100 million during the period 1988-95. By using the Simultaneous Equation Model developed by Shrieves and Dahl (1992), the study found that Banks which were below the requirement of 8%, increased their capital ratios significantly in 4 countries, i.e., Canada, Japan, Sweden and the US, while some undercapitalized banking institutions in France and Italy were ineffective in raising their Capital ratios.
Yudistira (2003) in “ The Impact of Bank Capital Requirements in Indonesia ” studied the impact of capital regulation on banks’ behaviour as well as its possible effects on the economy. The study provides new evidence on the effects of bank capital requirements in Indonesia. Using monthly panel data of all banks between 1997-1999 and Fixed effects panel regression model as the chosen model his findings suggest declaration in bank credit since implementation of capital regulation. The main finding from the liabilities side of banks is that there was a strong positive relationship between bank capital and growth rate of deposits. Secondly, with regards to bank lending, it was shown that credit crunch was less apparent in the aftermath of regulatory forbearance in Indonesia. To avoid credit crunch dilemma in the future, Indonesian government and the central bank have to develop alternative markets for credit channel while keeping strict capital regulation.
Liebig et al. (2004) in their study “ How will Basel II affect bank lending to emerging markets? An analysis based on German bank level data ” examined whether the new Basel Accord will induce a change in a bank lending to emerging markets on German Banks’ foreign exposure. The study took hypothesis that lending patterns will remain unchanged if regulatory capital requirements remain below the economic capital and banks’ lending is already based on risk modeling. The data for 50 German Banks’ for the period 1996-2002 was taken and it used the VAR model. The study found that Economic capital is higher than regulatory capital under Basel II and Economic capital is a significant determinant of banks’ loan decisions, in particular for large banks as well as other similar banks. It appeared that risk modeling has already guided lending decisions. It also found that the New Basel Accord should have a limited effect on lending to emerging markets as international active banks have already based their lending decisions on unexpected loss considerations.
Sarma & Nikaido (2007) in their working paper titled “ Capital Adequacy Regime in India: An Overview ” have presented an analytical review of the capital adequacy regime and the present state of capital to risk-weighted asset ratio (CRAR) of the banking sector in India. According to them Indian banking system had performed reasonably well during the regime of Basel I, with an average CRAR of about 12 per cent, which was higher than the internationally accepted level of 8 per cent as well as India’s own minimum regulatory requirement of 9 per cent. As the revised capital adequacy norms, Basel II, were to be being implemented from March 2008, several issues which would emerge have been examined from the Indian perspective. They have concluded that under the Basel II guidelines, the credit rating agencies will play a prominent role in determining regulatory risk capital. The main concerns are the unsatisfactory performance of the credit rating industry in India, the low credit rating penetration and the high costs of credit rating.
Goyal & Agrawal (2010) in their study “ Risk Management in Indian Banks: Some Emerging Issues ” discussed the importance of risk management process and also highlighted the challenges and opportunities regarding implementation of Basel-II in Indian Banking Industry. The authors were of the opinion that risk is an opportunity as well as a threat and has different meanings for different users. The banking industry is exposed to different risks such as forex volatility risk, variable interest rate risk, market play risk, operational risks, credit risk etc. which can adversely affect its profitability and financial health. Risk management has thus emerged as a new and challenging area in banking.
Thiagarajan, Ayyappan & Ramachandran (2011) in their study “ Market Discipline, Behavior and Capital Adequacy of Public and Private Sector Banks in India ” analyzed the role of market discipline on the behavior of commercial banks with respect to their capital adequacy. The study showed that the Capital Adequacy Ratio (CAR) in the Indian Commercial Banking sector shows that the commercial banks are well capitalized and the ratio is well over the regulatory minimum requirement. The private sector banks show a higher percentage of tier I capital over the public sector banks. However the public sector banks show a higher level of tier II capital. Although the full implementation of Basel II accord by the regulatory authority (Reserve Bank of India) may have influenced the level of capital adequacy in the banking sector, we have attempted to study the role of market discipline and some key bank specific variables in the higher level of capital in the banking sector.
4.1 Objectives of the Study
Based on the above observations the main objectives of the proposed study are as follows and as feasible:
· To study the impact of Basel II Accord on the stability of Indian Banks.
· To study the impact of Basel II Accord implementation on improving the credibility of Indian Banks in the global banking system.
4.2 Sampling Design
For the purpose of the research study, the secondary data has been collected from the various research books, journals, newspapers, periodicals, articles, internet, annual reports of banks, bulletins, RBI circulars.
For the collection of secondary data, 26 public sector banks and 20 private sector banks (7 new private sector banks and 13 old private sector banks) were selected to study the impact of Basel II accord on Indian Banks.
4.3 Period of the Study
RBI issued the first draft guidelines on Basel II implementation in February 2005 in which an initial target date for Basel II compliance was set for March 2007 for all commercial banks, excluding Local Area Banks (LABs) and Regional Rural Banks (RRBs). This deadline was however postponed to March 2008 for internationally active banks and March 2009 for domestic commercial banks in RBI’s mid-year policy announcement of October 30, 2006.
Thus the study covers a period of five financial years from 2008-09 to 2012-13. The financial year starts from 1st day of April of a calendar year and ends on the 31st day of March of next year.
4.4 Limitations of the Study
· The data pertains to the public and private sector banks only hence the impact and conclusions derived may be varying with the results of the other banks.
· In a span of 10 years the Basel Accord has recommended changes through its various accords namely Basel I, Basel II and Basel III. The acceptance and application of these regulations was to be done in a particular time frame which the banks could not keep pace with hence the real impact of these regulations would be seen in the years to come.
This section depicts the growth and development of public and private sector banks of India. Arithmetic Mean (A.M) and Ranking method have been used to measure growth of following financial parameters:
. Capital
· Net Profit
· Capital Requirement for Credit Risk
· Capital Requirement for Market Risk
· Capital Requirement for Operational Risk
5.1 Capital
Table 1: Capital of Public Sector Banks (2008-09 to 2012-13)
|
S. No. |
Banks |
Capital (in ₹ Crores) |
Average |
Rank |
||||
|
2009 |
2010 |
2011 |
2012 |
2013 |
||||
|
1 |
Allahabad Bank |
446.70 |
446.70 |
476.22 |
500.03 |
500.03 |
473.93 |
14 |
|
2 |
Andhra Bank |
485.00 |
485.00 |
559.58 |
559.58 |
559.58 |
529.75 |
13 |
|
3 |
Bank of Baroda |
365.53 |
365.53 |
392.81 |
412.38 |
422.52 |
391.75 |
17 |
|
4 |
Bank of India |
525.91 |
525.91 |
547.22 |
574.52 |
596.64 |
554.04 |
12 |
|
5 |
Bank of Maharashtra |
430.52 |
430.52 |
1069.71 |
1177.59 |
1249.48 |
871.56 |
6 |
|
6 |
Canara Bank |
410.00 |
410.00 |
443.00 |
443.00 |
443.00 |
429.80 |
15 |
|
7 |
Central Bank of India |
1321.14 |
1771.14 |
2021.14 |
2353.12 |
2661.58 |
2025.62 |
2 |
|
8 |
Corporation Bank |
143.44 |
143.44 |
148.13 |
148.13 |
152.91 |
147.21 |
22 |
|
9 |
Dena Bank |
286.82 |
286.82 |
333.39 |
350.06 |
350.06 |
321.43 |
19 |
|
10 |
IDBI Bank Ltd. |
724.78 |
724.86 |
984.57 |
1278.38 |
1332.75 |
1009.07 |
5 |
|
11 |
Indian Bank |
829.77 |
829.77 |
829.77 |
829.77 |
829.77 |
829.77 |
7 |
|
12 |
Indian Overseas Bank |
544.80 |
544.80 |
618.75 |
797.00 |
924.10 |
685.89 |
8 |
|
13 |
Oriental Bank of Commerce |
250.54 |
250.54 |
291.76 |
291.76 |
291.76 |
275.27 |
21 |
|
14 |
Punjab & Sind Bank |
383.06 |
383.06 |
423.06 |
434.21 |
454.02 |
415.48 |
16 |
|
15 |
Punjab National Bank |
315.30 |
315.30 |
316.81 |
339.18 |
353.47 |
328.01 |
18 |
|
16 |
State Bank of Bikaner & Jaipur |
50.00 |
50.00 |
50.00 |
70.00 |
70.00 |
58.00 |
23 |
|
17 |
State Bank of Hyderabad |
17.25 |
20.75 |
20.75 |
20.75 |
20.75 |
20.05 |
26 |
|
18 |
State Bank of India |
634.88 |
634.88 |
635.00 |
671.04 |
684.03 |
651.97 |
9 |
|
19 |
State Bank of Mysore |
36.00 |
36.00 |
46.80 |
46.80 |
46.80 |
42.48 |
25 |
|
20 |
State Bank of Patiala |
274.75 |
294.75 |
294.75 |
294.75 |
294.75 |
290.75 |
20 |
|
21 |
State Bank of Travancore |
50.00 |
50.00 |
50.00 |
50.00 |
50.00 |
50.00 |
24 |
|
22 |
Syndicate Bank |
521.97 |
521.97 |
573.29 |
601.95 |
601.95 |
564.22 |
11 |
|
23 |
UCO Bank |
1249.36 |
1699.36 |
2450.52 |
2487.71 |
2575.63 |
2092.52 |
1 |
|
24 |
Union Bank of India |
505.12 |
505.12 |
635.33 |
661.55 |
707.79 |
602.98 |
10 |
|
25 |
United Bank of India |
1782.43 |
866.43 |
1144.42 |
1161.00 |
1174.71 |
1225.80 |
4 |
|
26 |
Vijaya Bank |
933.52 |
933.52 |
1672.67 |
1695.54 |
1695.54 |
1386.16 |
3 |
|
Average Capital (in ₹ Crores) |
519.95 |
520.24 |
654.98 |
701.92 |
732.45 |
|||
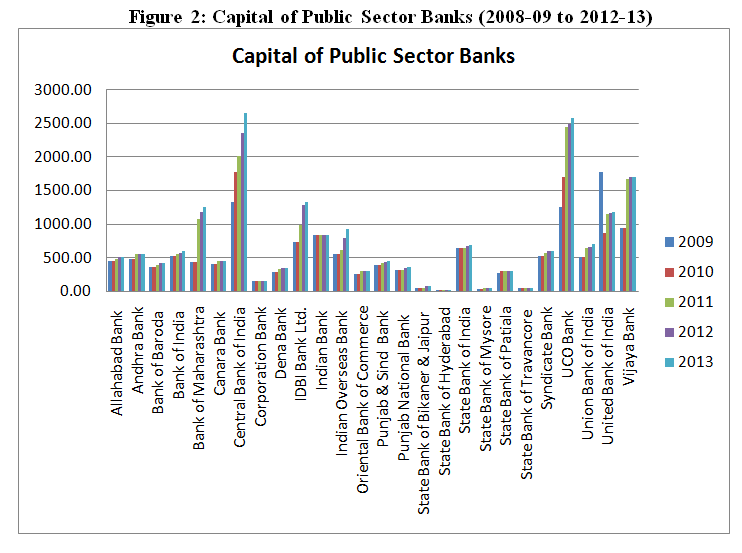
Table 1 and Figure 2 shows the capital of public sector banks for five years and also reveals the average capital. Banks with highest capital are ranked first and then the subsequent ranking is assigned. UCO Bank is the leading bank in terms of capital and State Bank of Hyderabad is the least capital holding bank. Maximum amount of average capital is ₹2092.52 Crores and minimum is ₹20.05 Crores. Central Bank of India, Vijaya Bank, United Bank of India and IDBI Bank are ranked 2nd, 3rd, 4th and 5th rank respectively in terms of average capital.
Table 2: Capital of Private Sector Banks (2008-09 to 2012-13)
|
S. No. |
Banks |
Capital (in ₹ Crores) |
Average |
Rank |
||||
|
2009 |
2010 |
2011 |
2012 |
2013 |
||||
|
1 |
Axis Bank Ltd. |
359.01 |
405.17 |
410.55 |
413.20 |
467.95 |
411.18 |
4 |
|
2 |
City Union Bank Ltd. |
32.00 |
39.96 |
40.50 |
40.82 |
47.44 |
40.15 |
18 |
|
3 |
Development Credit Bank Ltd. |
174.30 |
199.99 |
200.17 |
240.67 |
250.11 |
213.05 |
7 |
|
4 |
Dhanlaxmi Bank Ltd. |
64.12 |
64.12 |
85.14 |
85.14 |
85.14 |
76.73 |
15 |
|
5 |
HDFC Bank Ltd. |
425.38 |
457.74 |
465.23 |
469.34 |
475.88 |
458.71 |
2 |
|
6 |
ICICI Bank Ltd. |
1113.29 |
1114.89 |
1151.82 |
1152.77 |
1153.64 |
1137.28 |
1 |
|
7 |
IndusInd Bank Ltd. |
355.19 |
410.65 |
465.97 |
467.70 |
522.87 |
444.48 |
3 |
|
8 |
ING Vysya Bank Ltd. |
102.60 |
119.97 |
120.99 |
150.12 |
154.85 |
129.71 |
11 |
|
9 |
Kotak Mahindra Bank Ltd. |
345.67 |
348.14 |
368.44 |
370.34 |
373.30 |
361.18 |
5 |
|
10 |
Tamilnad Mercantile Bank Ltd. |
0.28 |
0.28 |
0.28 |
0.28 |
0.28 |
0.28 |
20 |
|
11 |
The Catholic Syrian Bank Ltd. |
18.88 |
18.93 |
31.35 |
31.42 |
41.90 |
28.49 |
19 |
|
12 |
The Federal Bank Ltd. |
171.03 |
171.03 |
171.05 |
171.05 |
171.06 |
171.04 |
9 |
|
13 |
The Jammu & Kashmir Bank Ltd. |
48.49 |
48.49 |
48.49 |
48.49 |
48.49 |
48.49 |
17 |
|
14 |
The Karnataka Bank Ltd. |
121.58 |
133.99 |
188.20 |
188.29 |
188.35 |
164.08 |
10 |
|
15 |
The Karur Vysya Bank Ltd. |
53.95 |
54.44 |
116.94 |
107.18 |
107.18 |
87.94 |
13 |
|
16 |
The Lakshmi Vilas Bank Ltd. |
48.78 |
97.51 |
97.53 |
97.53 |
97.54 |
87.78 |
14 |
|
17 |
The Nainital Bank Ltd. |
30.00 |
45.00 |
67.50 |
67.50 |
67.50 |
55.50 |
16 |
|
18 |
The Ratnakar Bank Ltd. |
104.72 |
104.72 |
214.95 |
214.95 |
252.92 |
178.45 |
8 |
|
19 |
The South Indian Bank Ltd. |
113.01 |
113.01 |
113.01 |
113.37 |
133.85 |
117.25 |
12 |
|
20 |
Yes Bank Ltd. |
296.98 |
339.67 |
347.15 |
352.99 |
358.62 |
339.08 |
6 |
|
Average Capital (in ₹ Crores) |
198.96 |
214.38 |
235.26 |
239.16 |
249.95 |
|||
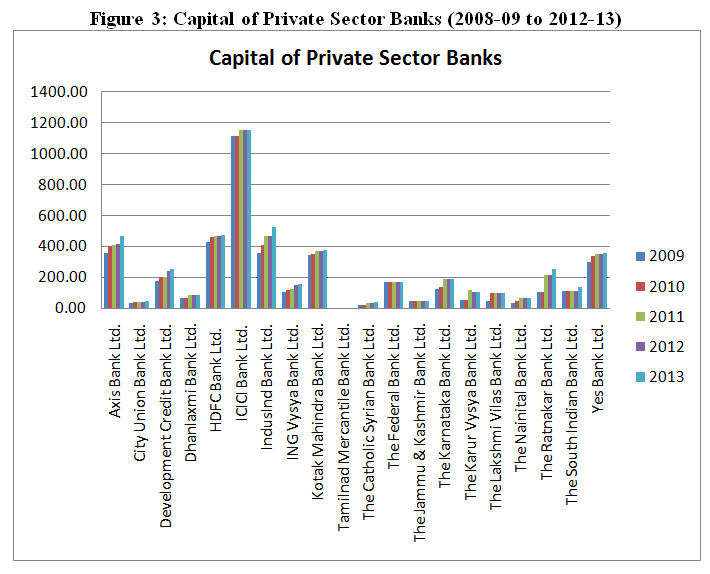
Table 2 and Figure 3 shows the capital of private sector banks for five years and also reveals the average capital. ICICI Bank is the leading bank in terms of capital and Tamilnad Mercantile Bank is the least capital holding bank. Maximum amount of average capital is ₹1137.28 Crores and minimum is ₹0.28 Crores. HDFC Bank, IndusInd Bank, Axis Bank and Kotak Mahindra Bank are ranked 2nd, 3rd, 4th and 5th rank respectively in terms of average capital.
5.2 Capital Requirement for Credit Risk
Table 3: Capital Requirement for Credit Risk of Public Sector Banks (2008-09 to 2012-13)
|
S. No. |
Banks |
Capital Requirement for Credit Risk (in ₹ Crores) |
Average |
Rank |
||||
|
2009 |
2010 |
2011 |
2012 |
2013 |
||||
|
1 |
Allahabad Bank |
4642.19 |
5694.58 |
7209.10 |
8455.26 |
10383.72 |
7276.97 |
11 |
|
2 |
Andhra Bank |
3305.26 |
4424.45 |
5650.30 |
7032.45 |
8188.67 |
5720.23 |
16 |
|
3 |
Bank of Baroda |
10214.85 |
12339.99 |
16896.99 |
20442.01 |
24008.26 |
16780.42 |
5 |
|
4 |
Bank of India |
10927.71 |
14652.81 |
18532.29 |
21325.59 |
22774.00 |
17642.48 |
4 |
|
5 |
Bank of Maharashtra |
3546.19 |
2929.42 |
3368.89 |
4157.49 |
5807.93 |
3961.98 |
19 |
|
6 |
Canara Bank |
10009.69 |
12197.58 |
13976.56 |
16623.40 |
18557.45 |
14272.94 |
7 |
|
7 |
Central Bank of India |
170490.00 |
7268.16 |
9379.28 |
11284.21 |
13855.44 |
42455.42 |
2 |
|
8 |
Corporation Bank |
4305.22 |
5549.20 |
7400.98 |
8700.87 |
9884.17 |
7168.09 |
12 |
|
9 |
Dena Bank |
2010.13 |
2309.93 |
2896.25 |
3960.84 |
4983.46 |
3232.12 |
22 |
|
10 |
IDBI Bank Ltd. |
11726.39 |
14867.48 |
15917.30 |
17416.45 |
20774.47 |
16140.42 |
6 |
|
11 |
Indian Bank |
3807.35 |
4829.73 |
5886.28 |
6843.41 |
7557.69 |
5784.89 |
15 |
|
12 |
Indian Overseas Bank |
6176.91 |
6232.28 |
8202.73 |
10588.56 |
12412.54 |
8722.60 |
9 |
|
13 |
Oriental Bank of Commerce |
5813.21 |
6813.78 |
7777.39 |
9262.69 |
10944.60 |
8122.33 |
10 |
|
14 |
Punjab & Sind Bank |
1440.07 |
2167.97 |
3076.91 |
3473.93 |
3918.02 |
2815.38 |
25 |
|
15 |
Punjab National Bank |
12025.00 |
15180.27 |
19747.03 |
22805.17 |
25102.24 |
18971.94 |
3 |
|
16 |
State Bank of Bikaner & Jaipur |
2073.57 |
2445.78 |
3140.45 |
3673.69 |
4418.04 |
3150.31 |
23 |
|
17 |
State Bank of Hyderabad |
NA |
4262.78 |
NA |
NA |
6982.79 |
5622.79 |
17 |
|
18 |
State Bank of India |
64023.00 |
71539.00 |
83877.64 |
88074.34 |
103607.70 |
82224.34 |
1 |
|
19 |
State Bank of Mysore |
1858.45 |
2289.23 |
2562.62 |
3175.80 |
3588.52 |
2694.92 |
26 |
|
20 |
State Bank of Patiala |
3428.19 |
3813.90 |
4172.13 |
4797.94 |
5675.88 |
4377.61 |
18 |
|
21 |
State Bank of Travancore |
2186.59 |
2578.93 |
3169.68 |
3492.22 |
4177.92 |
3121.07 |
24 |
|
22 |
Syndicate Bank |
5193.72 |
5800.32 |
6504.89 |
7946.24 |
9058.75 |
6900.78 |
13 |
|
23 |
UCO Bank |
4517.92 |
5387.16 |
6402.01 |
7750.73 |
7867.50 |
6385.06 |
14 |
|
24 |
Union Bank of India |
7239.96 |
9084.24 |
11356.78 |
13492.62 |
16203.06 |
11475.33 |
8 |
|
25 |
United Bank of India |
2584.88 |
3149.22 |
3908.89 |
4470.36 |
4835.15 |
3789.70 |
20 |
|
26 |
Vijaya Bank |
2723.04 |
3082.96 |
3554.70 |
4097.54 |
4738.90 |
3639.43 |
21 |
|
Average Capital Requirement for Credit Risk (in ₹ Crores) |
14250.78 |
8880.43 |
10982.72 |
12533.75 |
14242.57 |
|||
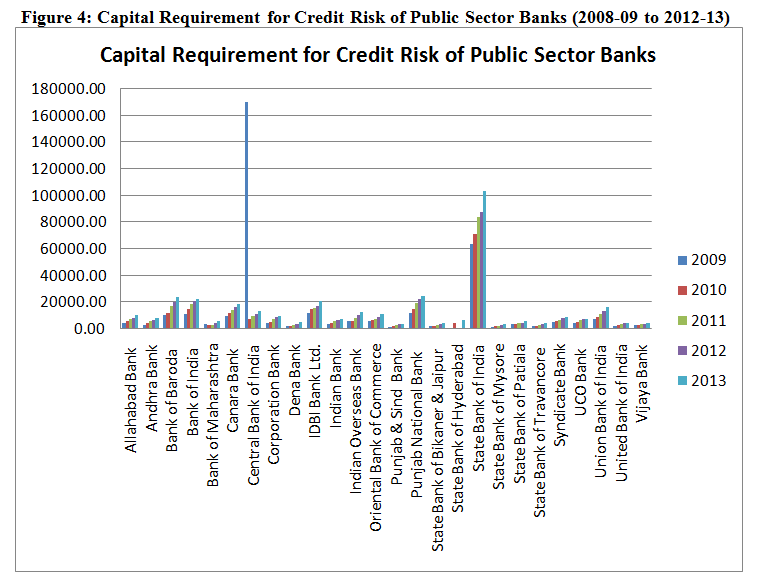
Table 3 and Figure 4 shows the capital requirement for credit risk of public sector banks for five years and also reveals the average capital required. Banks with highest capital are ranked first and then the subsequent ranking is assigned. State Bank of India is the leading bank in terms of capital requirement for credit risk and State Bank of Mysore is the least capital holding bank. Maximum amount of average capital required is ₹82224.34 Crores and minimum is ₹2694.92 Crores. Central Bank of India, Punjab National Bank, Bank of India and Bank of Baroda are ranked 2nd, 3rd, 4th and 5th rank respectively in terms of average capital requirement for credit risk.
Table 4: Capital Requirement for Credit Risk of Private Sector Banks (2008-09 to 2012-13)
|
S. No. |
Banks |
Capital Requirement for Credit Risk (in ₹ Crores) |
Average |
Rank |
||||
|
2009 |
2010 |
2011 |
2012 |
2013 |
||||
|
1 |
Axis Bank Ltd. |
8398.51 |
11040.47 |
15350.25 |
17815.22 |
19785.25 |
14477.94 |
3 |
|
2 |
City Union Bank Ltd. |
454.92 |
523.86 |
674.09 |
851.60 |
978.53 |
696.60 |
14 |
|
3 |
Development Credit Bank Ltd. |
390.34 |
384.02 |
405.81 |
473.88 |
600.34 |
450.88 |
17 |
|
4 |
Dhanlaxmi Bank Ltd. |
235.16 |
394.39 |
720.99 |
722.60 |
618.42 |
538.31 |
16 |
|
5 |
HDFC Bank Ltd. |
10739.71 |
12280.57 |
15262.09 |
19760.36 |
24681.82 |
16544.91 |
2 |
|
6 |
ICICI Bank Ltd. |
32814.00 |
26281.00 |
29656.00 |
33919.00 |
37718.00 |
32077.60 |
1 |
|
7 |
IndusInd Bank Ltd. |
1548.44 |
1819.46 |
2476.29 |
3146.66 |
4164.34 |
2631.04 |
7 |
|
8 |
ING Vysya Bank Ltd. |
1792.30 |
1646.50 |
2142.78 |
2753.89 |
3363.89 |
2339.87 |
10 |
|
9 |
Kotak Mahindra Bank Ltd. |
2438.30 |
3415.54 |
4606.99 |
6101.46 |
7328.74 |
4778.21 |
4 |
|
10 |
Tamilnad Mercantile Bank Ltd. |
446.09 |
560.32 |
705.39 |
880.53 |
1058.79 |
730.22 |
13 |
|
11 |
The Catholic Syrian Bank Ltd. |
279.63 |
303.15 |
401.35 |
441.16 |
476.62 |
380.38 |
18 |
|
12 |
The Federal Bank Ltd. |
1845.49 |
2202.44 |
2589.15 |
2737.85 |
3371.49 |
2549.28 |
8 |
|
13 |
The Jammu & Kashmir Bank Ltd. |
1467.62 |
1765.11 |
2360.20 |
2798.72 |
3382.84 |
2354.90 |
9 |
|
14 |
The Karnataka Bank Ltd. |
1156.18 |
1437.79 |
1726.18 |
1917.93 |
2160.00 |
1679.62 |
11 |
|
15 |
The Karur Vysya Bank Ltd. |
NA |
10596.51 |
1285.29 |
1557.25 |
1717.08 |
3789.03 |
5 |
|
16 |
The Lakshmi Vilas Bank Ltd. |
345.36 |
466.47 |
587.43 |
762.08 |
754.83 |
583.23 |
15 |
|
17 |
The Nainital Bank Ltd. |
96.39 |
108.14 |
133.31 |
159.87 |
180.60 |
135.66 |
20 |
|
18 |
The Ratnakar Bank Ltd. |
61.31 |
81.95 |
153.17 |
361.16 |
653.93 |
262.30 |
19 |
|
19 |
The South Indian Bank Ltd. |
726.72 |
901.70 |
1161.65 |
1359.44 |
1855.14 |
1200.93 |
12 |
|
20 |
Yes Bank Ltd. |
1509.69 |
2114.17 |
3802.76 |
4414.25 |
5534.70 |
3475.11 |
6 |
|
Average Capital Requirement for Credit Risk (in ₹ Crores) |
3512.96 |
3916.18 |
4310.06 |
5146.75 |
6019.27 |
|||
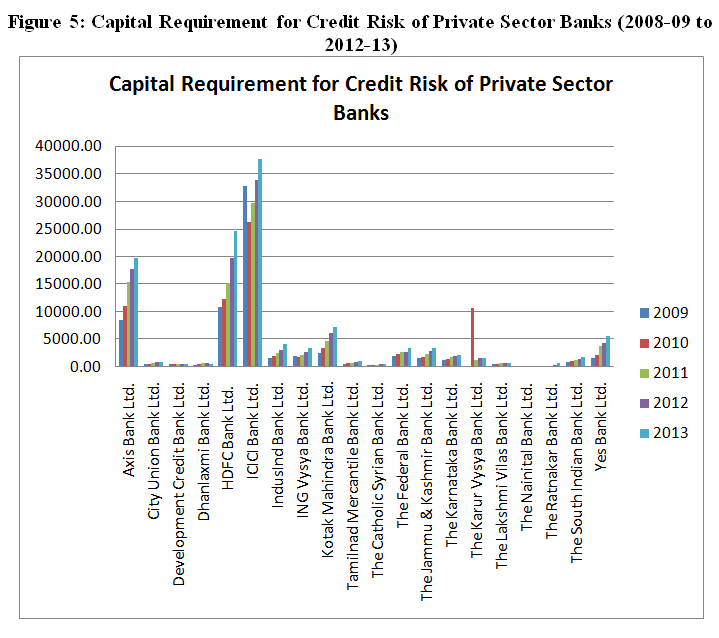
Table 4 and Figure 5 shows the capital requirement for credit risk of private sector banks for five years and also reveals the average capital required. ICICI Bank is the leading bank in terms of capital requirement for credit risk and Nainital Bank is the least capital holding bank. Maximum amount of average capital required is ₹32077.60 Crores and minimum is ₹135.66 Crores. HDFC Bank, Axis Bank, Kotak Mahindra Bank and Karur Vysya Bank are ranked 2nd, 3rd, 4th and 5th rank respectively in terms of average capital requirement for credit risk.
5.3 Capital Requirement for Market Risk
Table 5: Capital Requirement for Market Risk of Public Sector Banks (2008-09 to 2012-13)
|
S. No. |
Banks |
Capital Requirement for Market Risk (in ₹ Crores) |
Average |
Rank |
||||
|
2009 |
2010 |
2011 |
2012 |
2013 |
||||
|
1 |
Allahabad Bank |
805.65 |
665.94 |
460.18 |
517.35 |
726.48 |
635.12 |
9 |
|
2 |
Andhra Bank |
210.50 |
135.45 |
157.62 |
117.55 |
402.64 |
204.75 |
19 |
|
3 |
Bank of Baroda |
805.62 |
859.44 |
973.33 |
1098.35 |
1781.57 |
1103.66 |
4 |
|
4 |
Bank of India |
843.67 |
1325.98 |
1571.77 |
1237.32 |
962.34 |
1188.22 |
3 |
|
5 |
Bank of Maharashtra |
121.05 |
168.99 |
152.02 |
215.49 |
214.46 |
174.40 |
21 |
|
6 |
Canara Bank |
490.51 |
522.25 |
663.77 |
1153.94 |
1937.34 |
953.56 |
6 |
|
7 |
Central Bank of India |
466.45 |
628.03 |
619.33 |
704.51 |
1274.66 |
738.60 |
7 |
|
8 |
Corporation Bank |
566.03 |
431.45 |
333.16 |
360.57 |
601.59 |
458.56 |
13 |
|
9 |
Dena Bank |
102.95 |
126.61 |
96.17 |
169.16 |
499.51 |
198.88 |
20 |
|
10 |
IDBI Bank Ltd. |
898.76 |
1175.04 |
1197.30 |
1243.63 |
1764.58 |
1255.86 |
2 |
|
11 |
Indian Bank |
293.58 |
424.27 |
343.76 |
265.28 |
525.76 |
370.53 |
15 |
|
12 |
Indian Overseas Bank |
451.32 |
394.42 |
663.32 |
637.34 |
728.03 |
574.89 |
10 |
|
13 |
Oriental Bank of Commerce |
368.79 |
354.41 |
487.06 |
595.84 |
581.48 |
477.52 |
12 |
|
14 |
Punjab & Sind Bank |
192.16 |
136.54 |
99.74 |
86.99 |
88.48 |
120.78 |
23 |
|
15 |
Punjab National Bank |
641.58 |
666.42 |
941.96 |
1400.00 |
1760.06 |
1082.00 |
5 |
|
16 |
State Bank of Bikaner & Jaipur |
62.91 |
66.63 |
46.35 |
46.23 |
96.41 |
63.71 |
26 |
|
17 |
State Bank of Hyderabad |
NA |
186.79 |
NA |
NA |
291.24 |
239.02 |
18 |
|
18 |
State Bank of India |
3766.93 |
5068.00 |
5185.51 |
4377.00 |
6390.13 |
4957.51 |
1 |
|
19 |
State Bank of Mysore |
104.45 |
57.70 |
60.14 |
46.52 |
67.12 |
67.19 |
25 |
|
20 |
State Bank of Patiala |
135.63 |
149.84 |
122.38 |
191.89 |
238.75 |
167.70 |
22 |
|
21 |
State Bank of Travancore |
77.83 |
73.69 |
80.07 |
106.71 |
241.59 |
115.98 |
24 |
|
22 |
Syndicate Bank |
355.76 |
346.85 |
473.06 |
316.10 |
364.52 |
371.26 |
14 |
|
23 |
UCO Bank |
401.14 |
665.21 |
601.95 |
502.58 |
584.47 |
551.07 |
11 |
|
24 |
Union Bank of India |
830.00 |
601.81 |
502.59 |
688.92 |
992.14 |
723.09 |
8 |
|
25 |
United Bank of India |
222.32 |
405.79 |
246.08 |
263.33 |
387.37 |
304.98 |
16 |
|
26 |
Vijaya Bank |
250.03 |
193.82 |
258.42 |
223.32 |
318.59 |
248.84 |
17 |
|
Average Capital Requirement for Market Risk (in ₹ Crores) |
538.62 |
608.90 |
653.48 |
662.64 |
916.20 |
|||
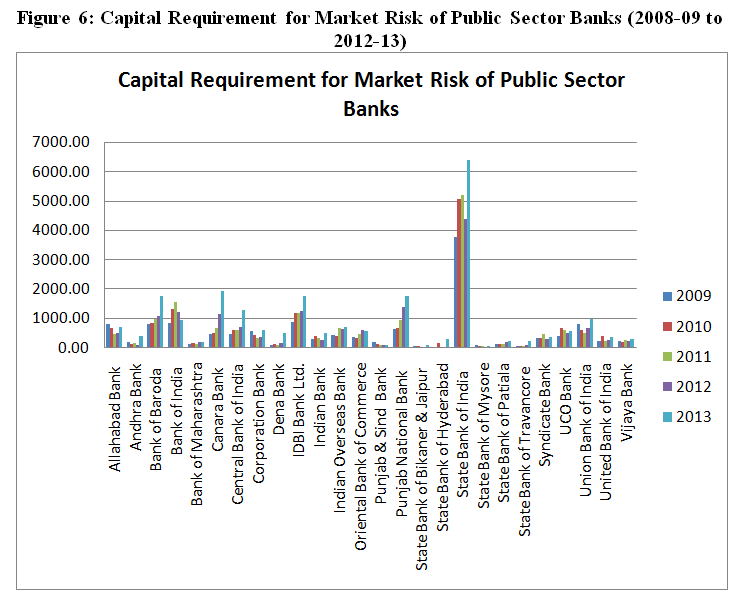
Table 5 and Figure 6 shows the capital requirement for market risk of public sector banks for five years and also reveals the average capital required. State Bank of India is the leading bank in terms of capital requirement for market risk and State Bank of Bikaner & Jaipur is the least capital holding bank. Maximum amount of average capital required is ₹4957.51 Crores and minimum is ₹63.71 Crores. IDBI Bank, Bank of India, Bank of Baroda and Punjab National Bank are ranked 2nd, 3rd, 4th and 5th rank respectively in terms of average capital requirement for market risk.
Table 6: Capital Requirement for Market Risk of Private Sector Banks (2008-09 to 2012-13)
|
S. No. |
Banks |
Capital Requirement for Market Risk (in ₹ Crores) |
Average |
Rank |
||||
|
2009 |
2010 |
2011 |
2012 |
2013 |
||||
|
1 |
Axis Bank Ltd. |
1050.90 |
1008.72 |
1378.66 |
1749.29 |
1841.51 |
1405.82 |
2 |
|
2 |
City Union Bank Ltd. |
16.13 |
17.93 |
21.07 |
23.44 |
23.54 |
20.42 |
18 |
|
3 |
Development Credit Bank Ltd. |
4.74 |
4.77 |
5.37 |
5.45 |
15.26 |
7.12 |
20 |
|
4 |
Dhanlaxmi Bank Ltd. |
5.19 |
5.85 |
23.59 |
20.39 |
66.62 |
24.33 |
17 |
|
5 |
HDFC Bank Ltd. |
562.73 |
589.27 |
928.12 |
459.56 |
1373.29 |
782.59 |
3 |
|
6 |
ICICI Bank Ltd. |
4613.00 |
3270.00 |
3402.00 |
3196.00 |
3246.00 |
3545.40 |
1 |
|
7 |
IndusInd Bank Ltd. |
30.98 |
34.65 |
71.44 |
71.76 |
211.09 |
83.98 |
11 |
|
8 |
ING Vysya Bank Ltd. |
77.61 |
60.09 |
51.61 |
117.95 |
207.60 |
102.97 |
10 |
|
9 |
Kotak Mahindra Bank Ltd. |
229.05 |
332.50 |
579.23 |
599.24 |
948.04 |
537.61 |
4 |
|
10 |
Tamilnad Mercantile Bank Ltd. |
66.40 |
50.20 |
36.07 |
44.79 |
51.35 |
49.76 |
12 |
|
11 |
The Catholic Syrian Bank Ltd. |
6.60 |
7.65 |
9.87 |
8.78 |
7.80 |
8.14 |
19 |
|
12 |
The Federal Bank Ltd. |
121.06 |
99.91 |
109.23 |
166.34 |
233.73 |
146.05 |
7 |
|
13 |
The Jammu & Kashmir Bank Ltd. |
85.27 |
149.05 |
198.39 |
208.11 |
269.95 |
182.15 |
6 |
|
14 |
The Karnataka Bank Ltd. |
84.01 |
101.11 |
102.60 |
107.93 |
128.07 |
104.74 |
9 |
|
15 |
The Karur Vysya Bank Ltd. |
NA |
93.52 |
77.48 |
158.23 |
201.85 |
132.77 |
8 |
|
16 |
The Lakshmi Vilas Bank Ltd. |
18.67 |
40.80 |
38.44 |
53.01 |
55.05 |
41.19 |
15 |
|
17 |
The Nainital Bank Ltd. |
17.11 |
20.77 |
26.01 |
37.61 |
46.00 |
29.50 |
16 |
|
18 |
The Ratnakar Bank Ltd. |
3.05 |
3.11 |
9.73 |
63.90 |
163.66 |
48.69 |
13 |
|
19 |
The South Indian Bank Ltd. |
43.94 |
34.91 |
54.78 |
44.33 |
63.75 |
48.34 |
14 |
|
20 |
Yes Bank Ltd. |
89.97 |
89.92 |
357.06 |
563.24 |
878.30 |
395.70 |
5 |
|
Average Capital Requirement for Market Risk (in ₹ Crores) |
375.07 |
300.74 |
374.04 |
384.97 |
501.62 |
|||
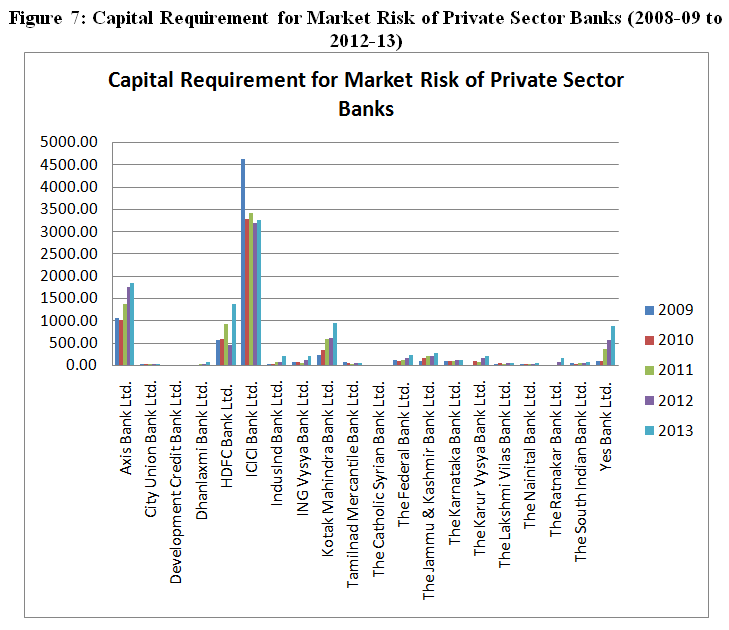
Table 6 and Figure 7 shows the capital requirement for market risk of private sector banks for five years and also reveals the average capital required. ICICI Bank is the leading bank in terms of capital requirement for market risk and Development Credit Bank is the least capital holding bank. Maximum amount of average capital required is ₹3545.40 Crores and minimum is ₹7.12 Crores. Axis Bank, HDFC Bank, Kotak Mahindra Bank and Yes Bank are ranked 2nd, 3rd, 4th and 5th rank respectively in terms of average capital requirement for market risk.
5.4 Capital Requirement for Operational Risk
Table 7: Capital Requirement for Operational Risk of Public Sector Banks (2008-09 to 2012-13)
|
S. No. |
Banks |
Capital Requirement for Operational Risk (in ₹ Crores) |
Average |
Rank |
||||
|
2009 |
2010 |
2011 |
2012 |
2013 |
||||
|
1 |
Allahabad Bank |
332.39 |
486.40 |
624.95 |
799.16 |
905.62 |
629.70 |
7 |
|
2 |
Andhra Bank |
272.00 |
304.66 |
362.32 |
466.69 |
585.74 |
398.28 |
17 |
|
3 |
Bank of Baroda |
708.77 |
848.80 |
1019.81 |
1295.68 |
1638.27 |
1102.27 |
4 |
|
4 |
Bank of India |
884.00 |
1079.12 |
1318.73 |
1496.52 |
1684.00 |
1292.47 |
3 |
|
5 |
Bank of Maharashtra |
190.46 |
222.73 |
280.01 |
356.03 |
452.16 |
300.28 |
18 |
|
6 |
Canara Bank |
759.77 |
836.27 |
971.92 |
1201.45 |
1406.52 |
1035.19 |
5 |
|
7 |
Central Bank of India |
388.49 |
412.01 |
497.07 |
685.35 |
859.13 |
568.41 |
10 |
|
8 |
Corporation Bank |
271.95 |
304.95 |
369.14 |
473.18 |
581.86 |
400.22 |
16 |
|
9 |
Dena Bank |
159.47 |
186.57 |
209.57 |
266.17 |
327.95 |
229.95 |
25 |
|
10 |
IDBI Bank Ltd. |
334.11 |
334.11 |
478.78 |
686.37 |
887.45 |
544.16 |
11 |
|
11 |
Indian Bank |
341.59 |
406.11 |
498.21 |
616.42 |
723.70 |
517.21 |
12 |
|
12 |
Indian Overseas Bank |
446.85 |
511.42 |
573.24 |
670.67 |
810.88 |
602.61 |
8 |
|
13 |
Oriental Bank of Commerce |
362.03 |
439.71 |
584.29 |
717.82 |
844.73 |
589.72 |
9 |
|
14 |
Punjab & Sind Bank |
174.39 |
197.25 |
241.56 |
272.10 |
297.27 |
236.51 |
24 |
|
15 |
Punjab National Bank |
1165.60 |
1165.60 |
1699.37 |
2064.27 |
2421.93 |
1703.35 |
2 |
|
16 |
State Bank of Bikaner & Jaipur |
201.95 |
226.67 |
246.61 |
295.27 |
353.26 |
264.75 |
21 |
|
17 |
State Bank of Hyderabad |
NA |
322.92 |
NA |
NA |
647.05 |
484.99 |
13 |
|
18 |
State Bank of India |
4972.00 |
5541.00 |
6451.90 |
7918.10 |
9581.05 |
6892.81 |
1 |
|
19 |
State Bank of Mysore |
155.47 |
170.92 |
200.45 |
245.35 |
289.40 |
212.32 |
26 |
|
20 |
State Bank of Patiala |
213.92 |
233.79 |
271.82 |
329.66 |
391.35 |
288.11 |
19 |
|
21 |
State Bank of Travancore |
200.79 |
226.91 |
254.17 |
298.02 |
332.36 |
262.45 |
22 |
|
22 |
Syndicate Bank |
359.48 |
383.23 |
422.82 |
542.36 |
662.14 |
474.01 |
14 |
|
23 |
UCO Bank |
312.89 |
343.11 |
400.60 |
526.25 |
642.07 |
444.98 |
15 |
|
24 |
Union Bank of India |
514.60 |
627.73 |
749.56 |
954.45 |
1158.12 |
800.89 |
6 |
|
25 |
United Bank of India |
214.40 |
217.69 |
239.49 |
310.99 |
396.07 |
275.73 |
20 |
|
26 |
Vijaya Bank |
194.72 |
209.60 |
246.90 |
302.58 |
345.81 |
259.92 |
23 |
|
Average Capital Requirement for Operational Risk (in ₹ Crores) |
565.28 |
624.59 |
768.53 |
951.64 |
1124.07 |
|||
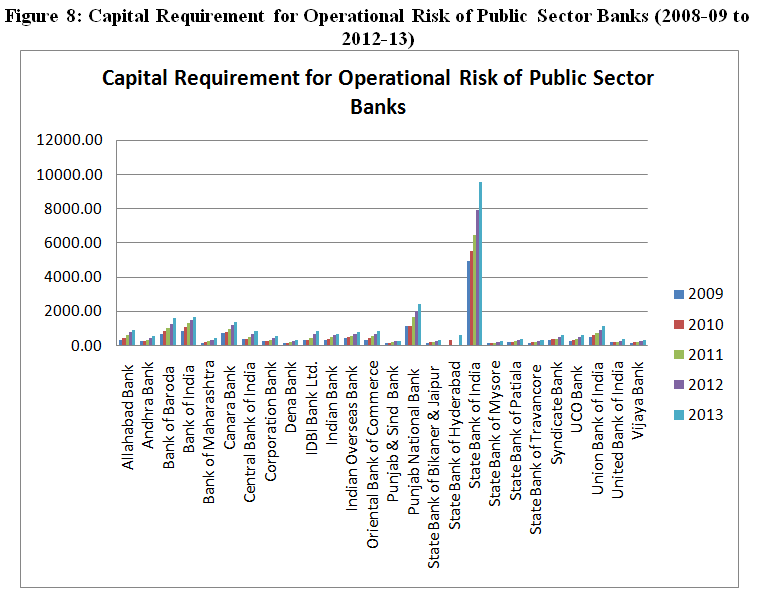
Table 7 and Figure 8 shows the capital requirement for operational risk of public sector banks for five years and also reveals the average capital required. Banks with highest capital are ranked first and then the subsequent ranking is assigned. State Bank of India is the leading bank in terms of capital requirement for operational risk and State Bank of Mysore is the least capital holding bank. Punjab National Bank, Bank of India, Bank of Baroda and Canara Bank are ranked 2nd, 3rd, 4th and 5th rank respectively in terms of average capital requirement for operational risk.
Table 8: Capital Requirement for Operational Risk of Private Sector Banks (2008-09 to 2012-13)
|
S. No. |
Banks |
Capital Requirement for Operational Risk (in ₹ Crores) |
Average |
Rank |
||||
|
2009 |
2010 |
2011 |
2012 |
2013 |
||||
|
1 |
Axis Bank Ltd. |
431.46 |
656.09 |
961.72 |
1289.52 |
1625.23 |
992.80 |
3 |
|
2 |
City Union Bank Ltd. |
34.30 |
41.65 |
51.37 |
65.82 |
83.18 |
55.26 |
14 |
|
3 |
Development Credit Bank Ltd. |
9.27 |
9.67 |
40.78 |
41.83 |
50.66 |
30.44 |
17 |
|
4 |
Dhanlaxmi Bank Ltd. |
0.30 |
23.22 |
28.16 |
41.70 |
51.17 |
28.91 |
18 |
|
5 |
HDFC Bank Ltd. |
806.11 |
1175.01 |
1514.23 |
1892.68 |
2256.46 |
1528.90 |
2 |
|
6 |
ICICI Bank Ltd. |
2114.00 |
2459.00 |
2625.00 |
2619.00 |
2749.00 |
2513.20 |
1 |
|
7 |
IndusInd Bank Ltd. |
98.53 |
142.05 |
216.71 |
309.86 |
420.29 |
237.49 |
6 |
|
8 |
ING Vysya Bank Ltd. |
110.04 |
139.96 |
175.57 |
212.21 |
246.44 |
176.84 |
9 |
|
9 |
Kotak Mahindra Bank Ltd. |
476.00 |
578.73 |
627.67 |
727.24 |
823.03 |
646.53 |
4 |
|
10 |
Tamilnad Mercantile Bank Ltd. |
55.33 |
65.34 |
85.94 |
107.02 |
134.40 |
89.61 |
13 |
|
11 |
The Catholic Syrian Bank Ltd. |
30.87 |
31.24 |
36.00 |
43.92 |
55.02 |
39.41 |
16 |
|
12 |
The Federal Bank Ltd. |
141.74 |
185.66 |
229.51 |
277.59 |
315.15 |
229.93 |
7 |
|
13 |
The Jammu & Kashmir Bank Ltd. |
135.78 |
187.87 |
176.90 |
276.51 |
339.38 |
223.29 |
8 |
|
14 |
The Karnataka Bank Ltd. |
89.18 |
98.70 |
101.02 |
111.03 |
127.37 |
105.46 |
12 |
|
15 |
The Karur Vysya Bank Ltd. |
NA |
867.58 |
94.57 |
120.76 |
154.21 |
309.28 |
5 |
|
16 |
The Lakshmi Vilas Bank Ltd. |
25.47 |
30.41 |
39.05 |
53.13 |
66.53 |
42.92 |
15 |
|
17 |
The Nainital Bank Ltd. |
12.83 |
14.62 |
16.90 |
19.88 |
23.23 |
17.49 |
19 |
|
18 |
The Ratnakar Bank Ltd. |
8.64 |
8.64 |
10.02 |
20.70 |
35.62 |
16.72 |
20 |
|
19 |
The South Indian Bank Ltd. |
86.61 |
86.61 |
101.76 |
125.14 |
154.01 |
110.83 |
11 |
|
20 |
Yes Bank Ltd. |
60.76 |
92.03 |
154.50 |
220.77 |
310.24 |
167.66 |
10 |
|
Average Capital Requirement for Operational Risk (in ₹ Crores) |
248.80 |
344.70 |
364.37 |
428.82 |
501.03 |
|||
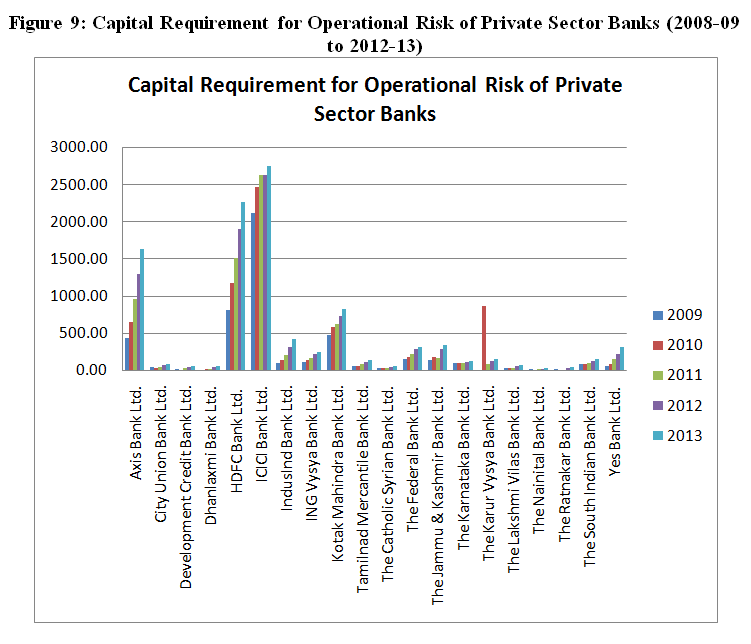
Table 8 and Figure 9 shows the capital requirement for operational risk of private sector banks for five years and also reveals the average capital required. ICICI Bank is the leading bank in terms of capital requirement for operational risk and Ratnakar Bank is the least capital holding bank. Maximum amount of average capital required is ₹2513.20 Crores and minimum is ₹16.72 Crores. HDFC Bank, Axis Bank, Kotak Mahindra Bank and Karur Vysya Bank are ranked 2nd, 3rd, 4th and 5th rank respectively in terms of average capital requirement for operational risk.
Most of the banks follow the standardised approach as per the guidelines of the Reserve Bank of India to cover the operational risk, credit risk and market risk; being it a relatively new field, they are not yet using the more advanced tools, for lack of experience as well as resources - both financial and manpower. However, in the long-term they are inclined to use more sophisticated and advanced tools too; Pillar II of Basel II accord in terms of preparedness and implementation seems to be have no strong hold on the ground, there are a number of laggards both conceptual and perceptional, as well as adequacy of resources and pressure of meeting the deadlines - the building blocks of the Pillar II are being stacked hastily without giving them a concrete basis on which they can strongly hold the weight of the changing banking scenario of tomorrow.
It has also been found that the public sector banks have gone in for further issue of equity shares to enhance their capital adequacy ratio. Several banks running on the brink of very low or sometimes even negative profitability have been permitted by the government to write-off their losses against their paid-up capital. This has further worsened their capital adequacy position. Inspite of all this and some bailout packages by the government, all the banks today have reached the stipulated ratio of 9% CRAR or even more. The main reason for this is also the internally generated funds by way of increased profits and augmentation of their reserves and surplus. In any cases due to further issue of equity shares capital, the shareholding of the government in the public sector banks also stands reduced.
· Allen, F., & Carletti, E. (2010). An overview of the crisis: Causes, consequences, and solutions. International Review of Finance , 10(1), 1-26.
· Brunnermeier, M. (2009). Deciphering the liquidity and credit crunch 2007-08. Journal of Economic Perspectives , 23(1), 77-100.
· Bernanke, B. (1983). Nonmonetary effects of the financial crisis in the propagation of the great depression. The American Economic Review , 73(3), 257-276.
· Calomiris, C., & Mason, J. (2003a). Consequences of U.S. bank distress during the depression. The American Economic Review , 93(3), 937-947.
· Calomiris, C., & Mason, J. (2003b). Fundamentals, panics and bank distress during the depression. The American Economic Review , 93(5), 1615-1647.
· Goyal, K. A., & Agrawal, S. (2010). Risk management in Indian banks: Some emerging issues. International Journal of Economics and Research , 1(1), 102-109.
· Ito, T., & Sasaki, Y. N. (1998). Impacts of the Basle capital standard on Japanese banks’ behavior . Working Paper No. 6730, National Bureau of Economic Research: Cambridge.
· Keeley, M. (1990). Deposit insurance, risk, and market power in banking. The American Economic Review , 80(5), 1183-1200.
· Liebig, T., Porath, D., Weder di Mauro, B., & Wedow, M. (2004). How will Basel II affect bank lending to emerging markets? An analysis based on German bank level data . Discussion Paper Series 2: Banking and Financial Supervision No. 05/2004, Deutsche Bundesbank: Frankfurt am Main.
· Nag, A. K., & Das, A. (2002). Credit growth and response to capital requirements: Evidence from Indian public sector banks. Economic and Political Weekly , 37(32), 3361-3368.
Sarma, M., & Nikaido, Y. (2007). Capital adequacy regime in India: An overview . Working Paper No. 196, Indian Council for Research on International Economic Relations: New Delhi. Retrieved from http://icrier.org/pdf/Working_Paper_196.pdf, accessed on 24 th December 2015. Taylor, J. (2009).
. The financial crisis and the policy responses: An empirical analysis of what went wrong Working Paper No. 14631, National Bureau of Economic Research: Cambridge.
· Thiagarajan, S., Ayyappan, S., & Ramachandran, A. (2011). Market discipline, behavior and capital adequacy of public and private sector banks in India. European Journal of Social Sciences , 23(1), 109-115. Van Roy, P. (2003).
The impact of the 1988 Basel accord on banks’ capital ratios and credit risk-taking: An international study . European Center for Advanced Research in Economics and Statistics (ECARES), Université Libre de Bruxelles: Brussels.
· Yudistira, D. (2003). The impact of bank capital requirements in Indonesia . Economics Working Paper Archive at WUSTL, 12. Retrieved from http://econwpa.repec.org/eps/fin/papers/0212/0212002.pdf, accessed on 18 th May 2016.