Pacific B usiness R eview I nternational

A Refereed Monthly International Journal of Management Indexed With THOMSON REUTERS(ESCI)
|
Dr. Subrata Roy Assistant Professor Department of Commerce Rabindra Mahavidyalaya Champadanga, Hooghly, West Bengal, India, 712401 Contact No.:- (+91) 9432653985 E-mail:- subrata1_roy@yahoo.com |
The study is design to examine the impact of basic requirements, efficiency enhancers and innovation and sophistication factors on global competitiveness index (GCI) on East Asia and Pacific region countries. Thus, matrix approach is used and regression model is also applied to compare the result. Philippines and Cambodia are not efficient to manage innovation and sophistication factor to make the nations more competitiveness in terms of productivity and prosperity because their coefficients are negative. Only five countries are significantly efficient to deal with three drivers to make the nations more competitiveness. The coefficients of three sub-indices of the remaining countries are positive except for innovation and sophistication of Philippines and Cambodia and the evidence is same which is obtained from regression analysis. Limited numbers of papers have focused on various definitions of GCI and identified factors for formulating GCI. Few studies have examined the impact of some specific factors on GCI. But this study is new one in the sense that it exclusively examines the impact of all the pillars categorised in three sub-indices (Basic requirements, Efficiency enhancers and Innovation & Sophistication) on Global Competitiveness Index which is expected to add value in the literature of global competitiveness.
Keywords: GCI, WEF, Matrix, Index, Factor, Efficiency, Innovation, Regression, Pillars, Region
Gel Classification: C1 C10
Competitiveness is one of the most central preoccupations for both advanced and developing countries (Porter, 1990) and the policy makers express serious concerns about it (Lall 2001). It is the set of institutions, policies, and factors that determine the level of productivity of an economy, which in turn sets the level of prosperity that a country can achieve. The original idea of Klaus Schwab (1979) about Global Competitiveness Index (GCI) is developed by Xavier Sala-i-Martin and published first in the year 2005 in collaboration with World Economic Forum (WEF). The GCI unites 114 indicators during the year 2016 and 2017 that capture concepts which matter for productivity and long-term prosperity. These components are grouped into 12 pillars of competitiveness such as (1) institutions, (2) infrastructure, (3) macroeconomic environment, (4) health and primary education, (5) higher education and training, (6) goods market efficiency, (7) labour market efficiency, (8) financial market development, (9) technological readiness, (10) market size, (11) business sophistication, and (12) innovation and each of them measures a different aspect of it. Again, these 12 pillars are categorized into three sub-indices such as basic requirements (1-4), efficiency enhancers (5-10), and innovation and sophistication (11-12). The three sub-indices are given different weights for the computation of GCI and divides countries based on their stages of development. GCI assumes that, in the first stage the economy is factor-driven where first four pillars under basic requirements sub-index of a country are developed. The efficiency enhancers sub-index includes those pillars which are important for countries in the efficiency-driven stage and innovation and sophistication sub-index includes those pillars which are critical to countries in the innovation-driven stage.
The present study seeks to examine the impact of three sub-indices on GCI of the East Asia-Pacific region countries. East Asia-Pacific is characterized by great diversity and includes three of the World’s ten largest economics like China, Japan and Indonesia.
The paper is organized as follows. The next section deals with details discussion about literature and research gap. Section 3 deals with objective. Data & study period is given in Section 4. Section 5 opens up the methodological part. Section 6 analyses the results and the remaining section deals with conclusion and recommendation.
Due to the increasing importance of global competitiveness in the understanding of contemporary economic and development issues, the researchers examine the relationship of the concept with various factors that influence it. It has become common to describe economic strength of an entity with respect to its competitors in the global market economy in which goods, services, people, skills, and ideas move freely across geographical borders (Saboniene 2009; Malakauskaite & Navickas 2010). According to D’Cruz in 1992 defines competitiveness is the ability of firm to design, produce and or market products superior to those offered by competitors, considering the price and non-price qualities. Some researchers (Barney & Hesterly 2001; Snieska & Draksaite 2007) observe that in changing business scenario some factors like business environment, dynamic capabilities, flexibilities, agility, speed, and adaptability are becoming more important sources of competitiveness. National competitiveness is one of the most important preoccupations for both advance and developing nations (Porter 1990) and policy makers express serious concerns about it (Lall 2001). Berger in 2008 identifies four main but very different theoretical constructs for national competitiveness and they have large divergences. According to Berger, another fifth concept of national competitiveness exists based on Porter’s diamond model and its extended version. Although the diamond model has been widely applied to examine the competitiveness of different nations. According to Smith (2010), the weak aspects of Porter’s model have been pointed out both by scholars of management and economics (Dunning 1992 & 1993; Rugman 1990 & 1991; Rugman & Verbeke 1993; Waverman 1995; Boltho 1996; Davies & Ellis 2000). Although the methodology used by World Economic Forum is very closely related to Porter’s diamond model. It defines country competitiveness as the “set of institutions, policies, and factors that determine the level of productivity of a country” (Schwab, 2016).
GCI is not free from limitations. In 2001 Lall points out several methodological, quantitative and analytical problems, and dubs the index misleading due to its arbitrary weighting of variables and use of subjective indicators. Carvalho et al., in 2012 point out high correlation among its variables, and even methodological errors and data manipulation which may lead to objectionable results (Freudenberg 2003). Van Stel in 2005 indicates two of the most serious problems with the GCI namely: (1) the index is not stable over short time periods for developed nations and (2) it is not successful in predicting short and long term economic growth because it combines so many other variables, such as entrepreneurial activity (Xia et al., 2012). However, the authors of the latest Global Competitiveness Report state that “the concept of competitiveness thus involves static and dynamic competitiveness and ......can explain an economy’s growth potential” (Schwab 2016).
GCI allows for several analysis levels when evaluating economic performance of the nations. Although, its application start with the firm level and it evaluates performance on the national, regional and global markets (see Hvidt 2013; Fagerberg 1996; Roessner, Porter, Newman & Cauffiel, 1996). In 2011, Silke explains global competitiveness to be the ability of countries to provide high levels of prosperity to their citizens. Measuring the global competitiveness entails quantifying the impact of various key factors that contribute to the creation of conditions for competitiveness. According to Helleiner in 2008, observes that global competitiveness measures the policies and factors that contribute to sustainable economic prosperity. Hertog in 2011 says that it is significantly influenced by the way in which a nation uses the resources that it has. A more realistic definition is given by Alvarez et al., in 2009 that global competitiveness is the ability of the country to compete in global trade by exporting its products and thus competitiveness is considered in relations to the productivity and the growth of the nation. In 2011 Colton remarks that the concept of global competitiveness has come out as a new paradigm in economic performance studies. It is being used to capture the awareness of the threats and challenges that are caused by competition that occurs at the global level. It also helps to evaluate the performance of the institutions, factors and policies that significantly influence a nation’s productivity levels.
Alfaki & Ahmed (2013) evaluate the relationship between global competitiveness and technological readiness in the Gulf region by focusing on the United Arabs Emirates (See also Aleksandra & Magdalena 2016). They observe that UAEs achieve immense success in technological readiness in terms of its Global Competitiveness Index (GCI). In a study by Wysokińska (2003), examines the concept of global competitiveness in terms of productivity levels and sustainable development in CEE and the countries of European Union. He observes that higher productivity leads to improved competitiveness in the global and local markets. Taner, Oncü, & Çivi (2010) also evaluates the performance of GCC nations based on international competitiveness. He concludes that the concept of global competitiveness is very multifaceted because of the wide array of indicators and factors that influence it.
In most of the existing literature, the concept of global competitiveness has been evaluated by looking at how it is influenced by specific economic parameters such as productivity levels (Wysokińska, 2003), trade balances, national economic performance (Taner et al., 2010) and technological readiness (Alfaki & Ahmed, 2013). Although these parameters and variables have been effectively used to examine the factors that influence global competitiveness.
The earlier studies basically deal with various definitions about GCI and search for different factors for formulating GCI. Some of the studies examine the impact of few factors like productivity, trade balances, economic growth and GDP etc. on GCI. The present study examines the impact of three main sub-indices such as basic requirements, efficiency enhancers and innovation & sophistication on GCI on East Asia and Pacific Region countries’/Economics based on matrix approach and comparison with regression technique. Currently, there is no such study that evaluates the impact of three sub-indices on GCI based on matrix approach.
The study is designed to examine whether Global Competitive Index (GCI) depends on the variables such as Basic Requirements (BR), Economic Enhancers (EE) and Innovation & Sophistication?
The study uses annual score of Global Competitive Index (GCI) and its three sub-indices particularly Basic Requirements (BR), Efficiency Enhancers (EE) and Innovation & Sophistication (IS). The study covers East Asia and Pacific Region countries’/Economics. According to the GCI report (2016-2017) there are 17 countries or economics provided by World Economic Forum. Here, 16 countries are considered because data of Lao PDR is not available for all the years. The study period covers from 2010-2011 to 2016-2017 and the annual score of 16 countries regarding GCI and its sub-indices is collected from the website of World Economic Forum (Secondary source).
In order to examine the impact of Basic Requirement, Efficiency enhancers and Innovation & Sophistication factors on Global Competitive Index (GCI), matrix approach is used on linear regression model. Here, GCI is the economies’ competitive performance indicator that depends on the performances of the remaining independent indicators. Before going to empirical modelling, the variables are specified as follows:
GCI is the global competitiveness index denoted by Y (Dependent Variable)
Basic requirements is the independent variable denoted by X2
Efficiency enhancers is the independent variable denoted by X 3
Innovation & Sophistication is the independent variable denoted by X4
To examine the above issue the following empirical multiple linear regression model in scalar form can be written as:
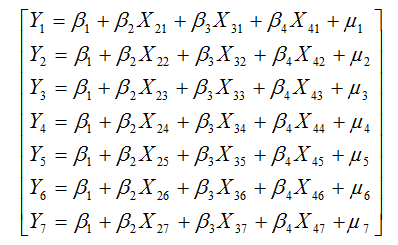
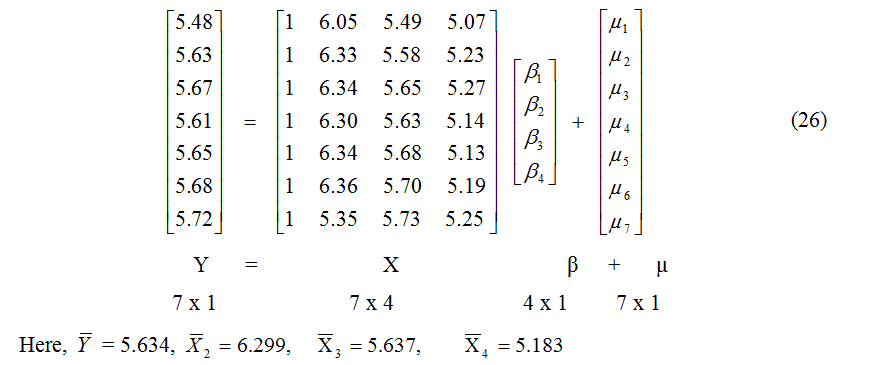
Yi = β1 + β2X2i + β3X3i + β4X4i + μ i (1)
Where, β1 indicates intercept, β2 to β 4 are the partial slope coefficients, μ is the stochastic disturbance term with 0 mean and constant standard deviation, and i means ith observation (i = 1, 2, 3,..........,n). Here, n is 7 because the study considers seven years annual data (from 2010-11 to 2016-17).
Theoretical Foundation:
Equation 1 is a set of seven simultaneous equations that can be written as under:
 (2)
(2)
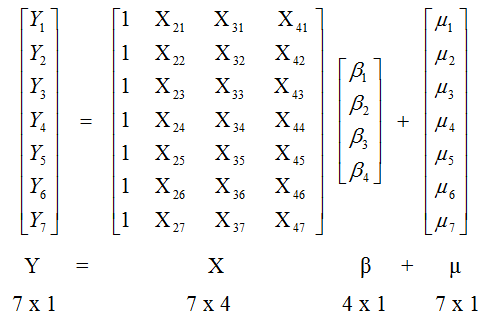
Now, the above set of equations (2) may be converted into a matrix form of (M x N) elements and can be arranged in M rows and N columns as under:
 (3)
(3)
Where, Y = 7 x 1 column vector (this matrix consists of M rows and only one column) of observations on the dependent variable Y.
X = 7 x 4 matrix that gives 28 observations on (4-1) variables such as from X2 to X4. The first column of 7 x 4 data matrix represents the intercept.
β = 4 x 1 column vector of the unknown parameters which is to be estimated.
μ = 7 x 1 column vector of residuals.
The above matrix form can be transformed into a matrix notation that can be written as under:
Y = Xβ + μ (4)
Now come to the assumptions of classical linear regression model in matrix notation.
Assumption 1:
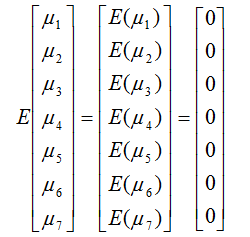
The expected value of the residuals vector μ for each elements is 0 or E(μi) = 0, for each i. Technically, the conditional mean value of μi is zero that can be shown in scalar form as:
E(μi /Xi) = 0
The above scalar form can be written in matrix notation as under:
 (5)
(5)
Where, μ and 0 are 7 x 1 column vectors, 0 being a null vector matrix.
Assumption 2:
The disturbances μi and μj are uncorrelated meaning that there is no autocorrelation. Given any two X values, Xi and Xj (i ≠ j), the correlation between any two μi and μj (i ≠ j) is zero. Symbolically, this can be written as follows:
Cov(μiμj / Xi, Xj) = E{[μi – E(μi)] / Xi}{[μj – E(μj)] / Xj} = E(μi / Xi) (μ j / Xj) = 0
Assumption 3:
The variance of μi for each Xi is constant number equal to σ2 or technically assumption of homoscedasticity. Symbolically, this can be written as follows:
Var(μi / Xi) =
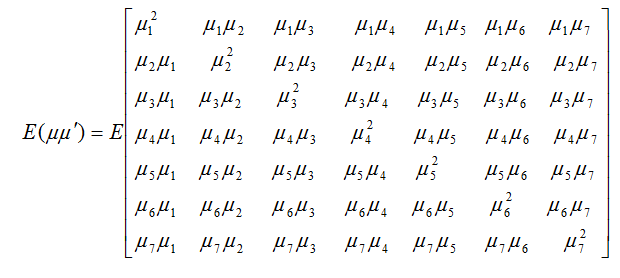
Now, assumptions 2 and assumption 3 can be written in matrix notation as under:
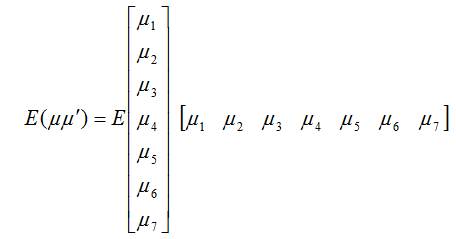 (6)
(6)
Where, is the transpose of the column vector μ that forms a row vector. Now rule of multiplication is applied to get the following matrix (n x n):
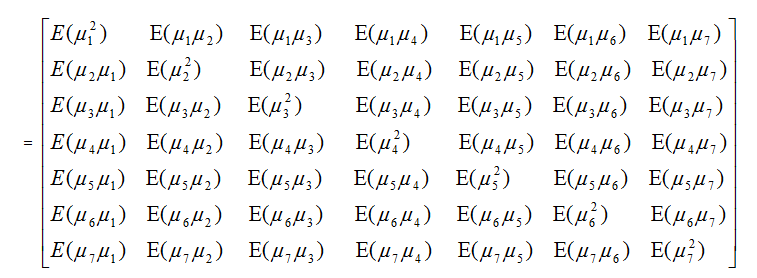 (7)
(7)
The assumptions regarding homoscedasticity and no serial correlation may be shown
by considering matrix 7 as under:
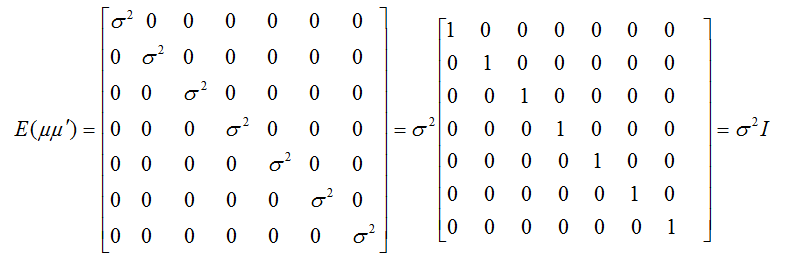 (8)
(8)
Here, I is an identity matrix (7 x 7). Matrix 7 and its representation 8 may be described as variance-covariance matrix of the residuals μ. The elements on the main diagonal of this matrix which are running from upper left corner to the lower right corner indicate variances and the elements of the main diagonal represents co-variances. This variance and covariance matrix is called symmetric matrix.
At this moment, consider the residuals of OLS. Let μ is a column vector and ú is the row vector. If a row vector is post multiplied by a column vector then it is termed as scalar which is a single (real) number or 1 x 1 matrix that can be written as under:
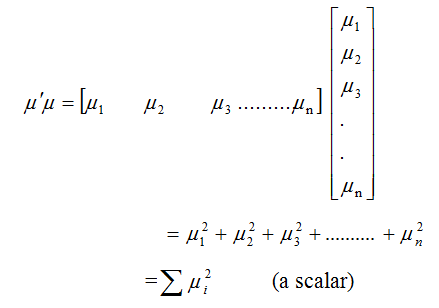 (9)
(9)
Where,
 is the residual sum of squares (RSS) which is a difference between total sum of
squares (TSS) and explained sum of squares (ESS). It may be written as under:
is the residual sum of squares (RSS) which is a difference between total sum of
squares (TSS) and explained sum of squares (ESS). It may be written as under:
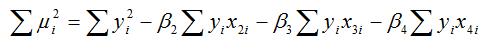 (10)
(10)
In matrix notation, the total sum of squares (TSS) can be written as under:
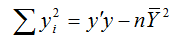 (11)
(11)
Similarly, explained sum of squares (ESS) can be written in matrix notation as under:
 = (12)
Here, is known as the correction for mean. From equation 4 ‘μ’ can be written as under:
μ = y – Xβ (13)
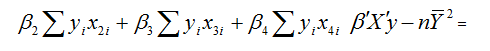
Therefore,
 (14)
(14)
According to the properties of transpose of a matrix, explicitly, (Xβ)ʹ = Xʹβʹ; and since βʹXʹy is a scalar which is equal to its transpose yʹXβ.
Here, equation 14 is the matrix representation of equation 10. In scalar notation
the OLS regression method consists of estimating β1, β2, β3
and β4 that
 is as little as possible and this can be done by differentiating equation 10 partially
with respect to β1, β 2, β3 and β4.
This process yields 4 simultaneous equations which are as under:
is as little as possible and this can be done by differentiating equation 10 partially
with respect to β1, β 2, β3 and β4.
This process yields 4 simultaneous equations which are as under:
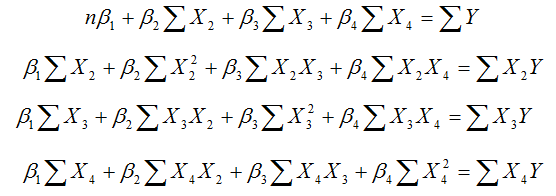 (15)
(15)
The above equations can be written in matrix notation as under:
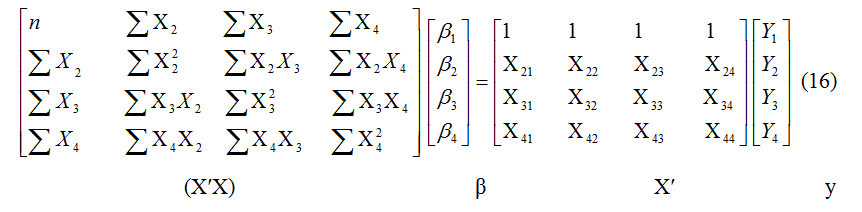
(XʹX) β Xʹ y
Or, matrix 16 closely represented as under:
(XʹX)β = Xʹy (17)
Here (XʹX) matrix has the following characteristics:
1. It gives the raw sum of squares and cross products of the X variables, one of which is the intercept term taking the value of 1 for each observation. The elements on the main diagonal give the raw sums of squares, and those on the main diagonal give the raw sums of cross products.
2. It is symmetrical since the cross product between X2 and X4 is the same as that between X4 and X 3 and also X3 and X2.
3. It is of order (4 x 4) that is 4 rows and 4 columns.
According to the matrix notation 17, (XʹX) and Xʹy are the known quantities and β is unknown. Now using matrix algebra, if the inverse of (XʹX) exists, such as (XʹX)-1, then pre-multiplying both sides matrix notation 17 by this inverse, the resulting matrix notation will be as under:
(XʹX)-1 (XʹX)β = (XʹX)-1 Xʹy (18)
But since (XʹX)-1 (XʹX) = I, an identity matrix of order 4 x 4 and thus,
Iβ = (XʹX)-1 Xʹy
β = (XʹX)-1 Xʹ y (19)
(4 x 1) (4 x 4) (4 x 7) (7 x 1)
Matrix notation 19 is the fundamental result of OLS theory.
Now the variance-covariance matrix of β can be written as under:
Var-cov (β) = {E[β – E(β)] [β – E(β)]ʹ} = E{[(XʹX)-1Xʹμ] [(XʹX)-1Xʹμ]ʹ} = E[(XʹX)-1Xʹμμʹ X(XʹX) -1] = (XʹX)-1Xʹ E(μμʹ) X(XʹX)-1 = (XʹX)-1Xʹ σ2 IX(XʹX)-1 = σ2 (XʹX)-1 (20)
Where, σ2 is the homoscedastic variance of μ, which can be computed as under:
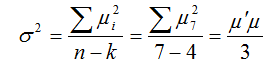 (21)
(21)
The matrix notation 20 can be shown in matrix form as under:
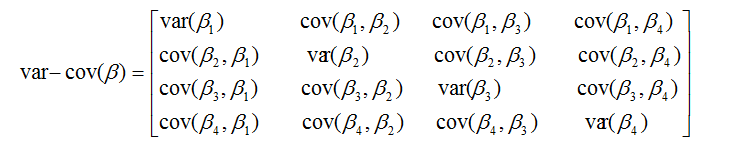 (22)
(22)
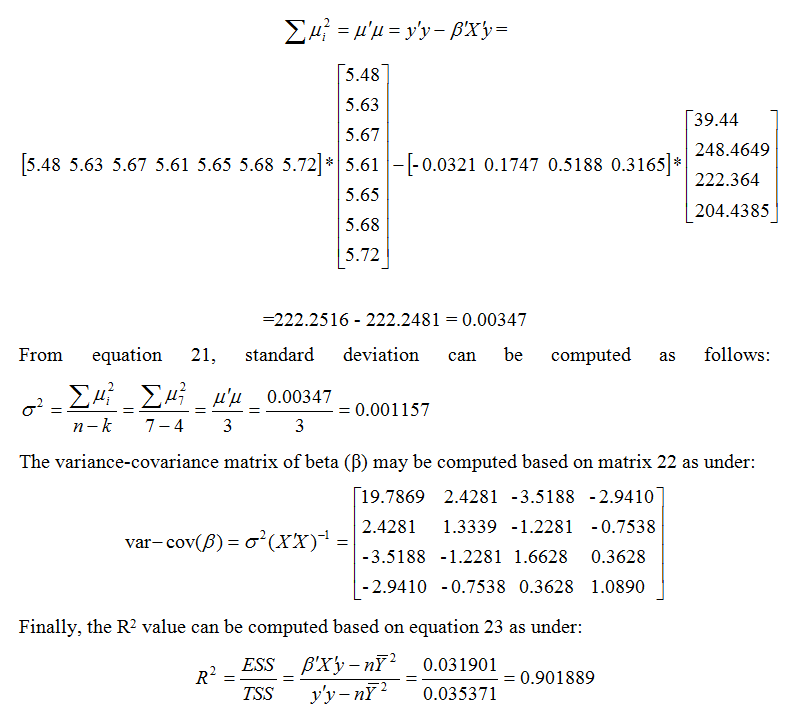
Now come to the computation of R2 which can be written as under:
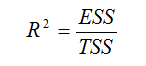 (23)
(23)
In case of four variables the R2 can be written as under:
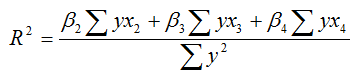
By using equations 11 and 12, equation 24 can be written as under:
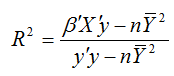 (25)
(25)
Finally, the study doesn’t apply ‘t’ test on the estimated individual coefficients (H0: β2 = β3 = β 4=0 ) obtained from the matrix approach. Here, overall significance of the estimated coefficients is tested in matrix notation by the analysis of variance technique and the F test.

It is also well known that there is a close relationship between F statistic and
R2 and thus, the value of F statistic can be computed as follows:
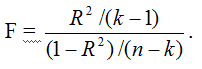
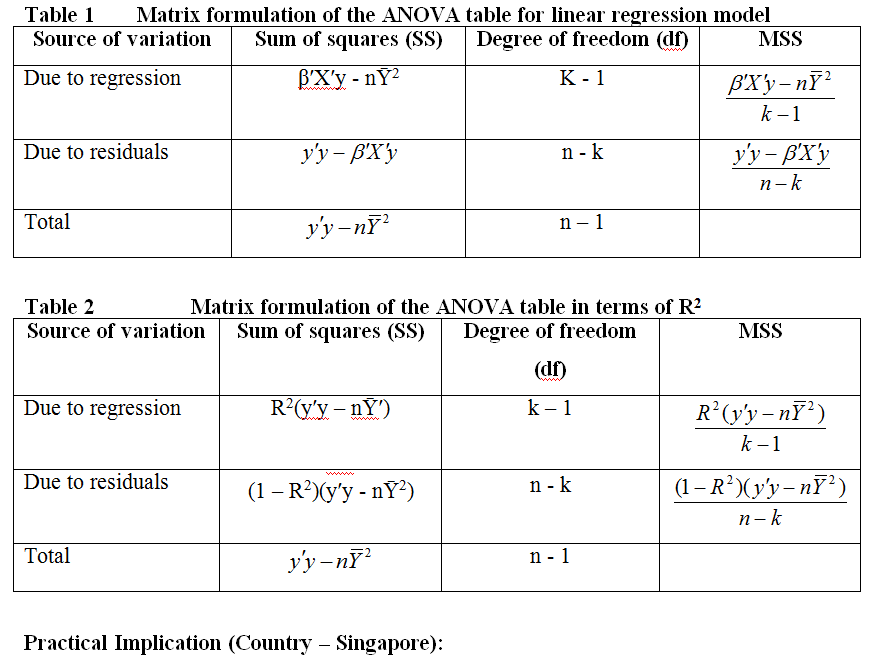
Therefore, the ANOVA table can be expressed in two ways namely as under:
Now consider the case of Singapore. The impact of GCI sub-indices on GCI can be shown by considering matrix notation 3 as under:
Similarly, The transpose of matrix of an M x N matrix X, denoted by Xʹ is an N x M matrix obtained
by interchanging the rows and columns of matrix X which can be shown as under:
The transpose of matrix of an M x N matrix X, denoted by Xʹ is an N x M matrix obtained
by interchanging the rows and columns of matrix X which can be shown as under:
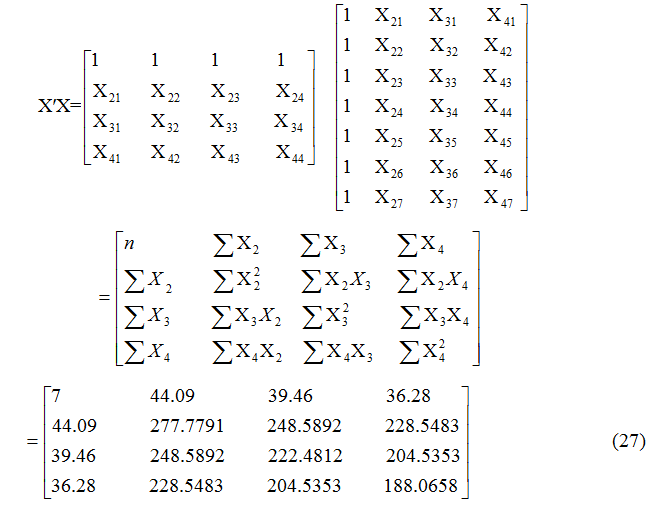
By applying the rule of matrix multiplication, we can get
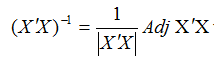
Now the study applies the rules of matrix inversion of the transpose matrix XʹX
that can be written as follows:
 where,

The inverse matrix of the transpose matrix XʹX will be as under:
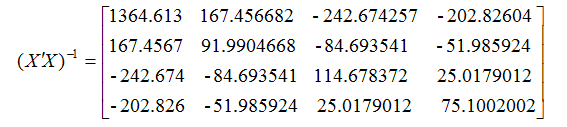 (29)
(29)
Thus, the estimated coefficients of the explanatory variables of Singapore which is mentioned in equation 19 as under:
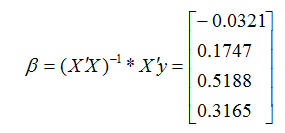 (30)
(30)
The residual sum of squares (RSS) can be computed by applying equation 9 as under:
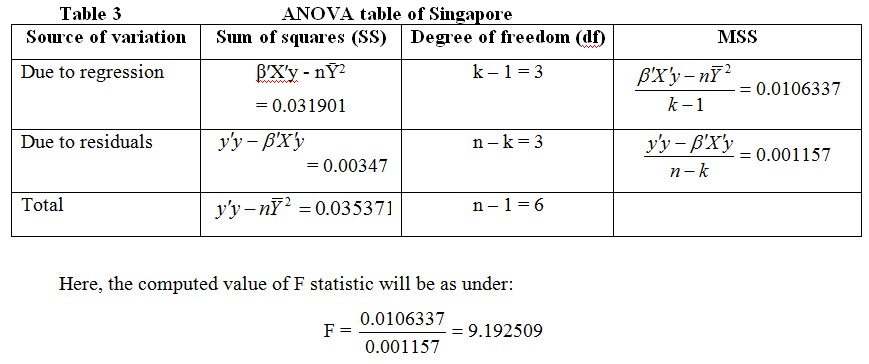
The overall significance of the null hypothesis is tested by analysis of variance technique (ANOVA) and F statistic which are discussed above. Here table one is applied to compute F statistic as under:
After that the study uses regression equation 1 for each country to estimate the coefficients and compares those coefficients with the coefficients that have been estimated from the matrix approach and finally analysed the results of the East Asia and Pacific region countries.
The impact of basic requirements, efficiency enhancers and innovation and sophistication factors of Global Competitiveness Index is given in table four. It is observed that the coefficients of basic requirements, efficiency enhancers and innovation and sophistication factors of the South Asian and Pacific region countries are positive except for Philippines and Cambodia whose coefficients of innovation and sophistication factor are found to be negative and statistically insignificant meaning that the innovation and sophistication factor is not a significant variable to explain GCI function because the probabilities values are more than five percent. Thus, these two economies are not efficient to manage their innovation driven factors (business sophistication and innovation) that makes the nations more competitive in terms of global competitiveness index. Where, the impact of three sub-indices on Global Competitiveness Index (GCI) of five countries (Japan, Taiwan, Australia, Korea Republic & Thailand) are statistically significant because their probabilities values are less than five percent meaning that those sub-indices are the significant variables to explain GCI function. Here, five countries have judiciously administered to improve all the pillars of basic requirements, efficiency enhancers and innovation and sophistication sub-indices which finally help to influence the GCI and make the regions more competitiveness in terms of their level of productivity and prosperity. On the other hand, the basic requirement factor is not a significant variable to explain GCI for Singapore. Similarly, the efficiency enhancers factor of Hong Kong SAR, New Zeland, Malaysia, Indonesia and Mangolia is not a significant variable to explain GCI and in the same way the innovation and sophistication factor of China, Brunei Darussalam, Vietnam and Mongolia is not a significant variable to explain GCI function. The basic requirements and innovation & sophistication factors are not significant in case of Malaysia and Mongolia and those countries cannot improve basic requirements (Institutions, infrastructure, macroeconomic environment, health and primary education) and innovation and sophistication (business sophistication and innovation) factors significantly to make the country more competitive. Here, the computed values of the F statistic is statistically significant meaning that the null hypothesis is rejected (β2 = β3 = β4 = 0) that means the global Competitiveness index is not linearly related to the basic requirements, efficiency enhancers and innovation and sophistication factors of the countries.
Table 4 Impact of Basic Requirements (BR), Efficiency Enhancers (EE) and Innovation & Sophistication (IS) factors on GCI
|
Country / Region |
Matrix Result |
R2 |
F-statistic |
|||
|
β1 |
β2 |
β3 |
β4 |
|||
|
Singapore |
-0.032 |
0.175 |
0.519* (0.000) |
0.317* (0.0000) |
0.901 |
9.1925* (0.0000) |
|
Japan |
-0.112 |
0.175* (0.0000) |
0.542* (0.0000) |
0.305* (0.0000) |
0.999 |
1166.557* (0.0000) |
|
Hong Kong SAR |
0.011 |
0.247* (0.0000) |
0.429 |
0.319* (0.0000) |
0.995 |
224.4354* (0.0000) |
|
New Zeland |
-0.107 |
0.340* (0.0000) |
0.163 |
0.529* (0.0000) |
0.999 |
9412.984* (0.0000) |
|
Taiwan |
-0.053 |
0.188* (0.0000) |
0.528* (0.0000) |
0.296* (0.0000) |
0.993 |
150.429* (0.0000) |
|
Australia |
-0.093 |
0.358* (0.0000) |
0.387* (0.0000) |
0.251* (0.0000) |
0.992 |
140.2636* (0.0000) |
|
Malaysia |
0.048 |
0.417* (0.0000) |
0.501 |
0.071 |
0.988 |
86.8846* (0.0000) |
|
Korea, Republic |
-0.009 |
0.218* (0.0000) |
0.516* (0.0000) |
0.264* (0.0000) |
0.999 |
1915.369* (0.0000) |
|
China |
0.234 |
0.385* (0.0000) |
0.477* (0.0000) |
0.089 |
0.999 |
1393.062* (0.0000) |
|
Thailand |
0.056 |
0.436* (0.0000) |
0.449* (0.0000) |
0.098* (0.0000) |
0.999 |
4149.893* (0.0000) |
|
Indonesia |
1.224* (0.0000) |
0.218* (0.0000) |
0.094 |
0.442* (0.0000) |
0.997 |
495.8243* (0.0000) |
|
Philippines |
0.047 |
0.342* (0.0000) |
0.675* (0.0000) |
-0.032 |
0.999 |
2101.191* (0.0000) |
|
Brunei Darussalam |
-1.491 |
0.461* (0.0000) |
0.748* (0.0000) |
0.208 |
0.994 |
168.1606* (0.0000) |
|
Vietnam |
0.321 |
0.558* (0.0000) |
0.312* (0.000) |
0.055 |
0.996 |
303.3026* (0.0000) |
|
Cambodia |
-0.273* (0.0000) |
0.587* (0.0000) |
0.490* (0.000) |
-0.007 |
0.999 |
5092.908* (0.0000) |
|
Mongolia |
1.131* (0.0000) |
0.397* (0.0000) |
0.030 |
0.317 |
0.944 |
17.18165* (0.0000) |
*significant at 5% level
Source: Authors’ own calculation
The study examines the impact of basic requirements, efficiency enhancers and innovation and sophistication factors on global competitiveness index. It is observed from the above discussion that five countries are significantly competitive in terms of the three sub-indices as compared to the other East Asia-Pacific region countries based on the result derived from the matrix approach. Estimated F statistic of the countries indicates that the global competitiveness index is not linearly related to the three factors based on matrix approach. A country will be more competitive in terms of productivity and prosperity only when it can prudently improve all the aspects like basic requirements, efficiency enhancers and innovation and sophistication factors. Thus, matrix approach has the great advantage over the linear regression model. It provides a compact method of handling regression models involving any number of variables and by applying this technique any type of complex problem can be solved without applying regression technique and hence, this technique can be used to solve any type of economic problem.