Pacific B usiness R eview I nternational

A Refereed Monthly International Journal of Management Indexed With THOMSON REUTERS(ESCI)
|
Siamak Saba M.A Graduated Department of Industrial Engineering Iran University of Science and Technology, Tehran, Iran. |
The brand's special value, with the nature of the features and credits that can increase or decrease the added value created by product or service, is an important indicator in obtaining feedback from marketing activities on the brand. In this research, the relationship between precious sales promotion and brand equity dimensions in the garment industry in the country has been investigated. The present research is applied in terms of purpose and based on the data gathering method, the research is descriptive and in terms of data analysis method, it is considered as correlation and structural equations. The required information was collected using a questionnaire from 107 samples of the statistical population including all customers of the brand (male clothing manufacturer) in Tehran and then analyzed using the LISREL software. The results of this research indicate that there is a positive and significant relationship between sales promotions and brand equity and its four dimensions (perception of quality, brand image, brand awareness and brand loyalty). The results of this research can help managers and marketers to make future plans for brand development through precious tools as brand advertising.
Keywords: Brand Equity, Brand Image, Brand Awareness, Price Promotions, Men's Clothing.
Developing customer relationships for the success of organizations in a time when the customer and his satisfaction are the first words in the economic markets is the most important aspect of the activities of today's companies (Nazari-Shirkouhi et al., 2015; Nazari-Shirkouhi and Keramati, 2017). Brand is one of the most important intangible assets of organizations and the development of the relationship between customer and brand is one of the most important strategies of organizations that bring them effective results (Ponte et al., 2015).
There is no real value within the product or service (So et al., 2017). But that value is in the minds of the potential and actual customers, and this is the brand that associates this value in their minds (Wallpach et al., 2017). In today's materialist world, consumers seek to make sense of consumption. In this regard, this is the brand that narrates a story about product buyers, puts its consumption in a ladder of intangible values and creates meaning (So et al., 2016). So,surprisingly all types of organizations and individuals tend to be managed as a brand (Kapferer, 2008). Most companies and organizations have realized that brand is one of the most important assets (Aaker, 1997). In fact, brand is more than a product. What distinguishes a branded product from a product without brandandvalue it, is the total customer’s perceptions and feelings about the characteristics and performance, the underlying reason and perceived characteristics of company related to brand(Keller , 2008). Generally, it can be argued that brand building is one of the most powerful methods for differentiation for organizations, and differentiation is one of the key strategies of competitive positioning (Jiang & Zhang, 2016).
Sales promotions are used as one of the main and most widely used tools ofmixed marketing, including businesses (Scotti et al., 2016), especially in men's clothing. Clothing industry due to the nature of prestige in the choice (Farhadloo et al., 2016)from the end consumer and the importance of the correct illustration of the product in the customer's mind, needs carefully design of marketing strategies, especially the design of sales promotion, in such a way that the dimensions of the product brand, due to its strategic importance from the perspective of the customer, is completely considered (Centeno & Wang, 2016). Therefore, the study of the type of effect of each of the components of used marketing tools (sales promotions, brand value) in these strategies on one another can be considered as the main subject is the leading treatise. Today, with a relatively good record in the garment (clothing) industry, men have a good market share for this product in Iran. However, price promotions mechanisms continue to be used by this industry to increase sales its products at specific times, and the lack of communication between them in the use of price promotions and brand value management may, in the long run, be detrimental to customer loyalty, value creating in customers, growing and maintaining of market share, an appropriate emotional relationship with customers and even with potential customers and leads to their loss (Hadadian et al., 2016).
Considering the various results in the research and literature of the subject on the type of effect and even the probability of the effectiveness of the use of price promotions on the brand value, and given the high impact of brand value components on customer buying behavior in the clothing market due to the nature of the goods as well as the probability of positive returns from using sales promotion to create liquidity in men's clothing companies and even the clothing industry in the Iranian market , the need for the study of the relationship between these two dimensions of marketing areas in order to try to obtain marketing policy recommendations and localize them in this business is very necessary in the country (Iran).
Therefore, in this research, we study the relationship between the use of sales promotions and brand value of the product from the perspective of the customer in this product and in the Iranian market. As a result, the effect of this relationship on brand value and the creation of brand affective relationship with the customer from the perspective of the customer will be addressed. Finally, we try to make strategic recommendations and policies in marketing this product in the Iranian market, focusing on the right balance in the use of marketing tools to promote the sale and management of brand value from the perspective of the customer.
In the following, we examine the relationship between sales promotions and brand equity dimensions, first brand concepts and brand management issues are discussed, and then proceed with sales promotions. Then the research methodology is presented. In the next section, the findings and outputs of the software are discussed in detail. Finally, conclusions and suggestions are presented.
2.1 Brand and brand management
The brand name of the companies is considered as large capital for them, which can bring competitive advantage to organizations if they have the appropriate impact (Hooshangi et al., 2016). Each brand has features that can affect people's loyalty on it (Voorhees et al., 2015). The brand's cognitive attributes are defined as the quality of service and the effect that the brand retains on the minds (Murali et al., 2016), and the impressive feature also comes from the prominent features, such as the characteristics of a company, that can affect brand design, and on the other hand, if they are properly identified and defined, can lead to brand loyalty (Manhas & Tukamushaba, 2015). In the past, the brand was only seen as part of the new product design process. Therefore, the attitude towards this concept is a series of tactics (not a strategy) and the methods of creating it aren’t similar (Jiang, H., Zhang, 2016). In fact, the traditional mentality considered focusing on the newest product (and most advertising) in the sense of focusing on the brand (Du Preez & Bendixen, 2015). Today, brands are emerging as a starting point for the distinction between competitive propositions, which plays a vital role in the success of organizations. Therefore, brand management is considered as a strategic (not tactical) process (Wallpach et al., 2017).
The international marketing dictionary states that a brand is a specific name for a product with a personality and visual identity given by the manufacturer to the product (Yadin, 2002). The American marketing association defines brand (from the legal dimension) as follows: a set of signs that distinguish the source of product or service production and distinguish it from other competitors (Keller, 2006; Kotler & Keller 2006). According to this definition the main value of the brand is in the seller, while the root of this value is the mind of the customer and the brand is more than a sign for him (Schultz & Barnes, 1999). This definition, because it is highly product-centric, most managers see the brand as a concept that will create awareness, recognition, and prominence in the market (Keller, 2006). In essence, this definition focuses on visual characteristics (as a source of differentiation) (Wood, 2000).
From the point of view of the customers, the brand can be defined as the totality of the experiences that the customer gains in relation to a brand (Ghodeswar, 2008). In this regard, Clare states that the brand is a mixture of psychological and mental signs in the consumer, which adds imagined value of the product or service (Keller, 1999), and these signs should be unique, highlighted and desirable (Xu, & Li, 2016). What is commonly seen in these definitions is that brand for companies is a property that can be used as a different value in the minds of customers. In fact, one can assume that the strong visualization and image of the organization is the most effective way of differentiation (Fazli & Amin Afshar, 2014).
2.2 Brand equity
The scholars have had different perceptions of the meaning of brand equity. Some of them have defined it as brand’s value added to product, brand loyalty, brand recognition, brand awareness, perceived quality, added utility, behavioral changes due to brand recognition, etc. (Aaker & joachimsthaler, 2000). Some Scholars have restricted the use of the term brand equity as the concept of evaluating the mental concepts of the customer, while others consider it to be behavioral concepts. In other words, in the marketing literature, the brand value is categorized into two categories that include customer perceptions (such as brand awareness, and perceived quality) and those that include customer behavior (such as brand loyalty and ...) (Shams, 2007).
Acer (1997) considers brand equity to be a set of brand-specific features and credits that increase or decrease the value created by the product. He divides these features into five groups: loyalty, brand awareness, perceived quality, brand image and other characteristics (registered sign, monopoly score, etc) (Upshaw, 1995).
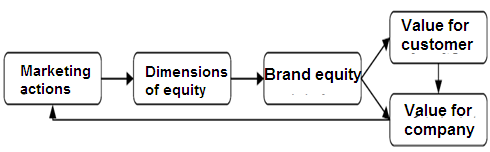 Figure-1: Conceptual Framework of Brand Equity from the Perspective of Acer
Yu et al. 2000, quoted by Shams, have defined brand equity as the difference and distinction between consumer choice between commodities with a strong brand and a commodity with the same characteristics but without brand (Ponte et al., 2015). Researchers argue that brand equity include factors such as brand awareness, customer loyalty to brand, assumed (imagined) quality and registered badge and sign (Tuan, 2015). The rest factors point to the brand's ability to differentiate itself from other competitors. It is important, of course, that the roots of all these activities are the recognition of consumers of the brand (Al-Hawari, 2015). In other words, the recognition of consumers towards a brand causes different responses to marketing activities about the brand.
Some other scholars look from the financial aspect to the brand, and look at the brand equity in the prevailing net financial value (Upshaw, 1995). The official definition of marketing science from brand equity is a set of concepts and behaviors related to customers, channel members and companies that give the brand more profitability, while this is not possible without the brand (Voorhees et al., 2015). Brand equity is critical to the customer, especially new customers, and is therefore crucial to the organization (So et al., 2017). The main goal of companies is to increase customer relationships by creating value for both sides (Fazli and Hooshangi, 2014). Factors that can create value include satisfaction, loyalty-related behaviors and fame. Though most companies consider value creation in the development of financial resources and the success of obtaining monetary resources (Centeno & Wang, 2016),but in fact, what is the real value for companies and will create value for them steadily is to communicate with customers and identify the emotions, feeling, and attributes that they are then identified with the brand, based on which they can make the brand best known to customers.
2.3 Brand loyalty
Loyalty is a concept that there is a large variety in its definition and evaluation (Dawes et al., 2015). Researchers believe that loyalty to a brand reflects the positive and desirable features of a brand and shows the customer’s re-intention to buy from the same brand (Lee et al., 2015). Loyal and consent (satisfied) customers are identified through a repeat shopping pattern of a brand (Ponte et al., 2015). Preserving the customer (client) and attracting his/her loyalty is considered essential to the continuation of business (Shirazi et al., 2013). According to Oliver, customer loyalty means having a deep commitment to re-purchasing and continuous purchase a preferred product (Ahmadi et al., 2014).So, loyal customers are critical to success and competitive advantage. Brand loyalty has the potential for changing consumer behavior that affects future marketing activities of companies (Krystallis, A., Chrysochou, 2014). Based on what has been said so far, it can be argued that trust will be the source of customer satisfaction and loyalty to the brand. Such a loyalty, which will bring many benefits to companies including increased sales, profitability, reduced company sensitivity to market changes and becoming customer-orientated (Jiang, & Zhang, 2016).
According to what is explained and the variables that were attempted to be described, the researcher examined the influence and role of sales promotions and brand equity dimensions in a men's clothing manufacturing company with a well-known brand and a familiar name within Iran that has its customers and is a matter of interest among people, developed a conceptual model and proposes hypotheses based on it.
Hypothesis 1: There is a significant and positive relationship between brand price promotion and quality perception.
Hypothesis 2: There is a significant and positive relationship between brand price promotions and brand loyalty.
Hypothesis 3: There is a significant and positive relationship between brand price promotions and brand awareness.
Hypothesis 4: There is a significant and positive relationship between brand price promotions and brand image.
Hypothesis 5: There is a significant and positive relationship between brand price promotions and brand equity.
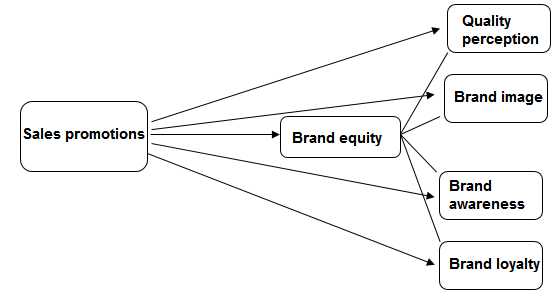 Figure-2: Conceptual Model of Research
The present study in terms of purpose is a descriptive one and regarding the method of data collection, it is considered as a survey (non-experimental) research. Also, based on method of data analysis, this research is a correlation type and, in particular, structural equations and factor verification. The statistical population of the study consisted of men's classic men's clothing customers. However, due to the operational necessity and limiting the scope of the research in order to validate it, the statistical population of this research has been considered the customers of clothing in Tehran (clients referred to four branches of Tehran). The population of this research, in terms of the number of individuals, is considered to be an unlimited population. Also, regardless of the distribution of community (society), the distribution of the mean and the total sample, based on the central limit theorem, will have normal distribution. Regarding whether the research data is quantitative or qualitative, various methods are used to estimate the sample size. According to various researchers, the Cochran formula in unlimited societies can be a suitable method for estimating sample size. According to calculations, the sample size was 107 questionnaires that researcher distributed 121 questionnaire and consequently analyzed them.
One of the most important aspects of any research is the suitability and appropriateness of measuring tools (Hooshangi et al., 2017), because the data and information necessary for analysis and obtaining final results are obtained through measuring tool. In this research, in addition to the researcher's mastering on the subject studied, the questionnaire has been reviewed by a number of professors and experts. After reviewing their points of view, it was corrected, and finally the questionnaire was adjusted and based on this, the validity of the measurement tool was achieved through content validity method.
The above concept refers to the extent to which the measuring tool yields the same results under the same conditions. In other words, this concept implies that the used items (questions) to measure a scale are related to each other. In this research, Cronbach's alpha method was used because it is one of the best methods for measuring the level of internal coordination of measuring instruments (Fazli and Amin Afshar, 2016). In this research, 30 questionnaires were collected as a pre-test and analyzed by SPSS software. The Cronbach's alpha of the whole questionnaire was calculated to be 0.953, indicating that the used questionnaire was reliable or, in other words, has the necessary reliability. The concept of reliability is intended to indicate that the measuring tool how much examine (measure) the desired characteristic (Sakaran, 2005). In the present study, for the purpose of measuring the validity of the questionnaire, two categories of content and structure validity were considered, and in this regard, apparent validity and factor validity (factor analysis) were investigated.
Content validity depends on the questions forming questionnaire and answers to the question whether its measurement tool adequately measure the concept (Fazli et al., 2013). In this research, this kind of validity was examined by some of the most professed masters in the field of marketing and engineering management. The apparent validity states that, according to the opinion of the experts, the tool measures what is to be measured or not. In this research, with the use of high-grade professors, this kind of validity has also been considered. Factor analysis is known as a technique for reducing the number of variables to a small number of factors that describe the highest variance. Also, this technique is used to express hypotheses with respect to random mechanisms or to screen variables for later analyzes. In fact, it can be stated that factor analysis attempts to identify the basic variables or factors (latent variables) in order to explain the correlation pattern between the observed variables.
Since the Likert spectrum (scale) is a quantitative spectrum with a distance scale, therefore, statistical analyzes are applied, given the quantitative assumption of the data. In the current research, the data were analyzed using descriptive statistics and inferential statistics. Therefore, in descriptive analysis, frequency distribution table, central indices, dispersion indices, distribution and related graphs have been used. In inferential analysis correlation test was used to measure the significance, type and intensity of correlation between variables. Also, structural equation techniques (confirmatory path analysis) have been used to measure the causal relationship between variables and goodness of fit indicators for a conceptual model has been investigated.
This section of the study was designed to analyze the data obtained from the statistical sample, so that in two parts, the data were analyzed. In the first section, which includes descriptive statistics, the frequency, percent, tables and graphs, central and dispersion parameters, and in the second part, using Lisrele software structural equation modeling were addressed.
The descriptive statistics of the research are presented in the table below.
Table-1: Descriptive characteristics of the study participants
|
Age |
Education |
||||||
|
Variable |
Frequency |
Percentage |
Cumulative percentage |
Variable |
Frequency |
Percentage |
Cumulative percentage |
|
From 20 to 25 years |
18 |
14.9 |
14.9 |
Secondary school |
5 |
4.1 |
4.1 |
|
Between 25 and 30 years |
45 |
37.2 |
52.1 |
High school |
28 |
23.1 |
27.3 |
|
30 t0 35 years |
32 |
26.4 |
78.5 |
Associate degree |
26 |
21.5 |
48.8 |
|
35 t0 40 years |
13 |
10.7 |
89.3 |
Undergraduate |
47 |
38.8 |
87.6 |
|
40-45 years |
7 |
5.8 |
95.0 |
Post-graduate |
15 |
12.4 |
100 |
|
45-50 years |
5 |
4.1 |
99.0 |
||||
|
55-60 years |
1 |
0.8 |
100 |
||||
|
Gender |
|||||||
|
Variable |
Frequency |
Percentage |
Cumulative percentage |
||||
|
Male |
109 |
90.1 |
90.1 |
||||
|
Female |
12 |
9.9 |
100 |
||||
5.1 Results of structural equations
The results of Bartlett's test shows that the value of Kaiser-Meyer-Olkin (KMO) test for sampling adequacy is 869%, and this value is significant at the alpha level of 5%. As a result, it can be said that the amount of variance in the data can be explained by factors (indices) that is, in fact, it shows that the functionality of the data is verified and the proposed indicators (indices) examine the functionality.
Table-2: Bartlett's (KMO)
|
KMO Sampling adequacy |
Degree of freedom |
Chi square |
Significance level |
|
0.869 |
630 |
2768.39 |
0.001 |
Table-3: Path coefficient of the conceptual model of factors
|
Latent variables |
Observed variables |
t |
Significance level |
Non-standard factor loads |
Standard error |
standardized factor loads |
R2 |
|
Price promotions |
Question 1 |
2.92 |
0.001 |
7.44 |
0.98 |
0.29 |
0.076 |
|
Question 2 |
8.08 |
0.001 |
0.55 |
0.10 |
0.71 |
0.57 |
|
|
Question 3 |
9.39 |
0.001 |
0.37 |
0.09 |
0.79 |
0.72 |
|
|
Question 4 |
5.60 |
0.001 |
0.58 |
0.79 |
0.52 |
0.23 |
|
|
Question 5 |
3.92 |
0.001 |
0.65 |
0.87 |
0.38 |
0.13 |
|
|
Question 6 |
4.24 |
0.001 |
0.86 |
0.12 |
0.41 |
0.15 |
|
|
Question 7 |
3.82 |
0.001 |
0.86 |
0.11 |
0.37 |
0.10 |
|
|
Quality perception |
Question 8 |
7.45 |
0.001 |
0.53 |
0.07 |
0.64 |
0.38 |
|
Question 9 |
5.60 |
0.001 |
0.50 |
0.068 |
0.58 |
0.32 |
|
|
|
Question 10 |
6.18 |
0.001 |
0.35 |
0.048 |
0.65 |
0.41 |
|
Question 11 |
6.23 |
0.001 |
0.40 |
0.056 |
0.66 |
0.44 |
|
|
Question 12 |
5.53 |
0.001 |
0.58 |
0.079 |
0.57 |
0.33 |
|
|
Question 13 |
2.57 |
0.001 |
2.08 |
1.05 |
0.25 |
0.060 |
|
|
Question 14 |
4.27 |
0.001 |
0.41 |
0.060 |
0.65 |
0.039 |
|
|
Question 15 |
6.79 |
0.001 |
0.26 |
0.039 |
0.73 |
0.54 |
|
|
Brand loyalty |
Question 16 |
7.18 |
0.001 |
0.36 |
0.053 |
0.78 |
0.60 |
|
Question 17 |
8.61 |
0.001 |
0.56 |
0.07 |
0.74 |
0.55 |
|
|
Question 18 |
7.13 |
0.001 |
0.30 |
0.046 |
0.73 |
0.66 |
|
|
Question 19 |
9.73 |
0.001 |
0.25 |
0.039 |
0.82 |
0.67 |
|
|
Question 20 |
10.39 |
0.001 |
0.21 |
0.036 |
0.87 |
0.74 |
|
|
Question 21 |
4.18 |
0.001 |
0.86 |
0. 11 |
0.39 |
0.14 |
|
|
Question 22 |
9.48 |
0.001 |
0.32 |
0.048 |
0.80 |
0.63 |
|
|
Brand awareness |
Question 23 |
7.45 |
0.001 |
0.63 |
0.085 |
0.68 |
0.32 |
|
Question 24 |
7.30 |
0.001 |
0.64 |
0.088 |
0.89 |
0.71 |
|
|
Question 25 |
6.29 |
0.001 |
0.60 |
0.082 |
0.84 |
0.43 |
|
|
Question 26 |
2.01 |
0.121 |
1.25 |
0.16 |
0.20 |
0.0014 |
|
|
Brand image |
Question 27 |
6.11 |
0.001 |
0.24 |
0.040 |
0.87 |
0.70 |
|
Question 28 |
6.96 |
0.001 |
0.40 |
0.057 |
0.83 |
0.54 |
|
|
Question 29 |
6.38 |
0.001 |
0.28 |
0.044 |
0.87 |
0.67 |
|
|
Question 30 |
7.47 |
0.001 |
0.44 |
0.059 |
0.59 |
0.31 |
|
|
Question31 |
7.18 |
0.001 |
0.33 |
0.46 |
0.72 |
0.46 |
|
|
Brand equity |
Question 32 |
6.52 |
0.001 |
0.23 |
0.035 |
0.84 |
0.70 |
|
Question 33 |
12.12 |
0.001 |
0.21 |
0.35 |
0.87 |
0.76 |
|
|
Question 34 |
12.15 |
0.001 |
0.15 |
0.026 |
0.87 |
0.78 |
|
|
Question 35 |
10.46 |
0.001 |
0.26 |
0.38 |
0.79 |
0.63 |
|
|
Question36 |
9.53 |
0.001 |
0.36 |
0.051 |
0.74 |
0.55 |
In this section, for the number of variables observed, measurement equations are presented, each equation includes the path coefficient between the observed and latent variables, the measurement error of observed variable, along with its significance test based on the characteristic t, and also, the value of R2that is the determination coefficient (explained variance) by the latent variable. The results of the confirmatory factor model show that all variables are correlated with sales promotions, and the R2 value represents the predictive value of the factors as seen. In the price promotional factor, the factor of people positive views towards price promotions and the overall favor of price promotions for the brand have the highest predictive power in price promotions, because the R2 value in the people positive view compared to the price promotions is 72% and in the factor of overall favor of price promotions for the R2 brand is 57%. In the factor of quality perception, the probability that to be considered as reliable, have the highest predictive power, since its R 2 value is 44%. In the brand loyalty factor, the price factor has the highest predictive power since the R2 value is 74%, and then in the offer to others factor and the re-purchase of it has a high predictive power, since each of them has R2, 66% and 67%, respectively. In brand awareness factor, the second factor, brand logo recognition, has the highest predictive power of brand awareness and its R 2 is 70%. In the brand image, the factor has a strong personality has the highest predictive power and the R2 value is 70%, and then in the factor of produces a power image has R2 value of 67%. In the factor of brand equity, the factor that indicates that the brand is an attractive one, has the highest predictive power and the R 2 value is 78%, and then in the factors of creativity and goodness each has R2, 76% and 70 %, respectively.
The following model relates to thirty five factors for measuring brand indices within the framework of six factors that using Lisrel's conceptual model, it was estimated that between price promotions with quality perception, the standardized load factor is 0.25 with brand loyalty equal to 0.46, with brand awareness is 0.14, with a brand image is 0.36 and with brand equity is 0.41. As a result, it can be said that brand equity and brand loyalty have the highest predictive power than other variables. Also, according to presented T values , among brand promotions with brand equity of 3.92, the quality perception of 3.11, brand loyalty of 4.91, brand awareness of 1.39, and the brand image of 4.33, which as a result it can be stated that the relationship between price promotions and brand awareness is not confirmed by Lisrel based on the amount of T. The chi square test shows the difference between the observed and expected covariance matrix, and according to the above model, the chi square value for this model with a degree of freedom of 549 is 19.61, which is not statistically significant because its significance level is relatively high P = 0.0821, it can be concluded that the Chi-square test confirms the exact fitting of the model with the observed data because, when the value of the chi-square is close to zero, it shows that there is little difference between observed and expected covariance. In fact when chi skewer is close to zero, the level of probability (p-value) is higher than 0.05 and this result indicates good fitting in the model.
The model also can be examined through the GFI. GFI is the most reliable indicator for model fitness (fitting). GFI is a measure of the relative value of variances and covariance that is explained commonly by the model and this indicator (index) is similar to R2 in the multivariate regression. Indeed, the GFI's comparative index is fluctuating between zero and one and the larger this indicator, the better the fitness (fitting), and considering that in the above model the GFI value is 0.92, it can be judged that the model has acceptable fitness (fitting). The available value of the root mean square error of approximation (RMSEA) is 0.126, which indicates that the model has a good fit (fitness). The residual root mean square index of RMR is 1.09 and is relatively small, which indicates a slight error of the model, and acceptable fitness. Also fitting was evaluated in terms of multiple fitness characteristics and showed that the AGFI indices are 88% and the PGFI index is 86%, which indicates that the model has good fitness.
 Figure-3 Confirmatory factor analysis diagram with six latent variables and
35 observed variables with standardized load factors
Figure-3 Confirmatory factor analysis diagram with six latent variables and
35 observed variables with standardized load factors
|
AA:Price sales promotions BB: Quality perception CC: Brand loyalty DD: Brand awareness EE:Brand image FF: Brand equity |
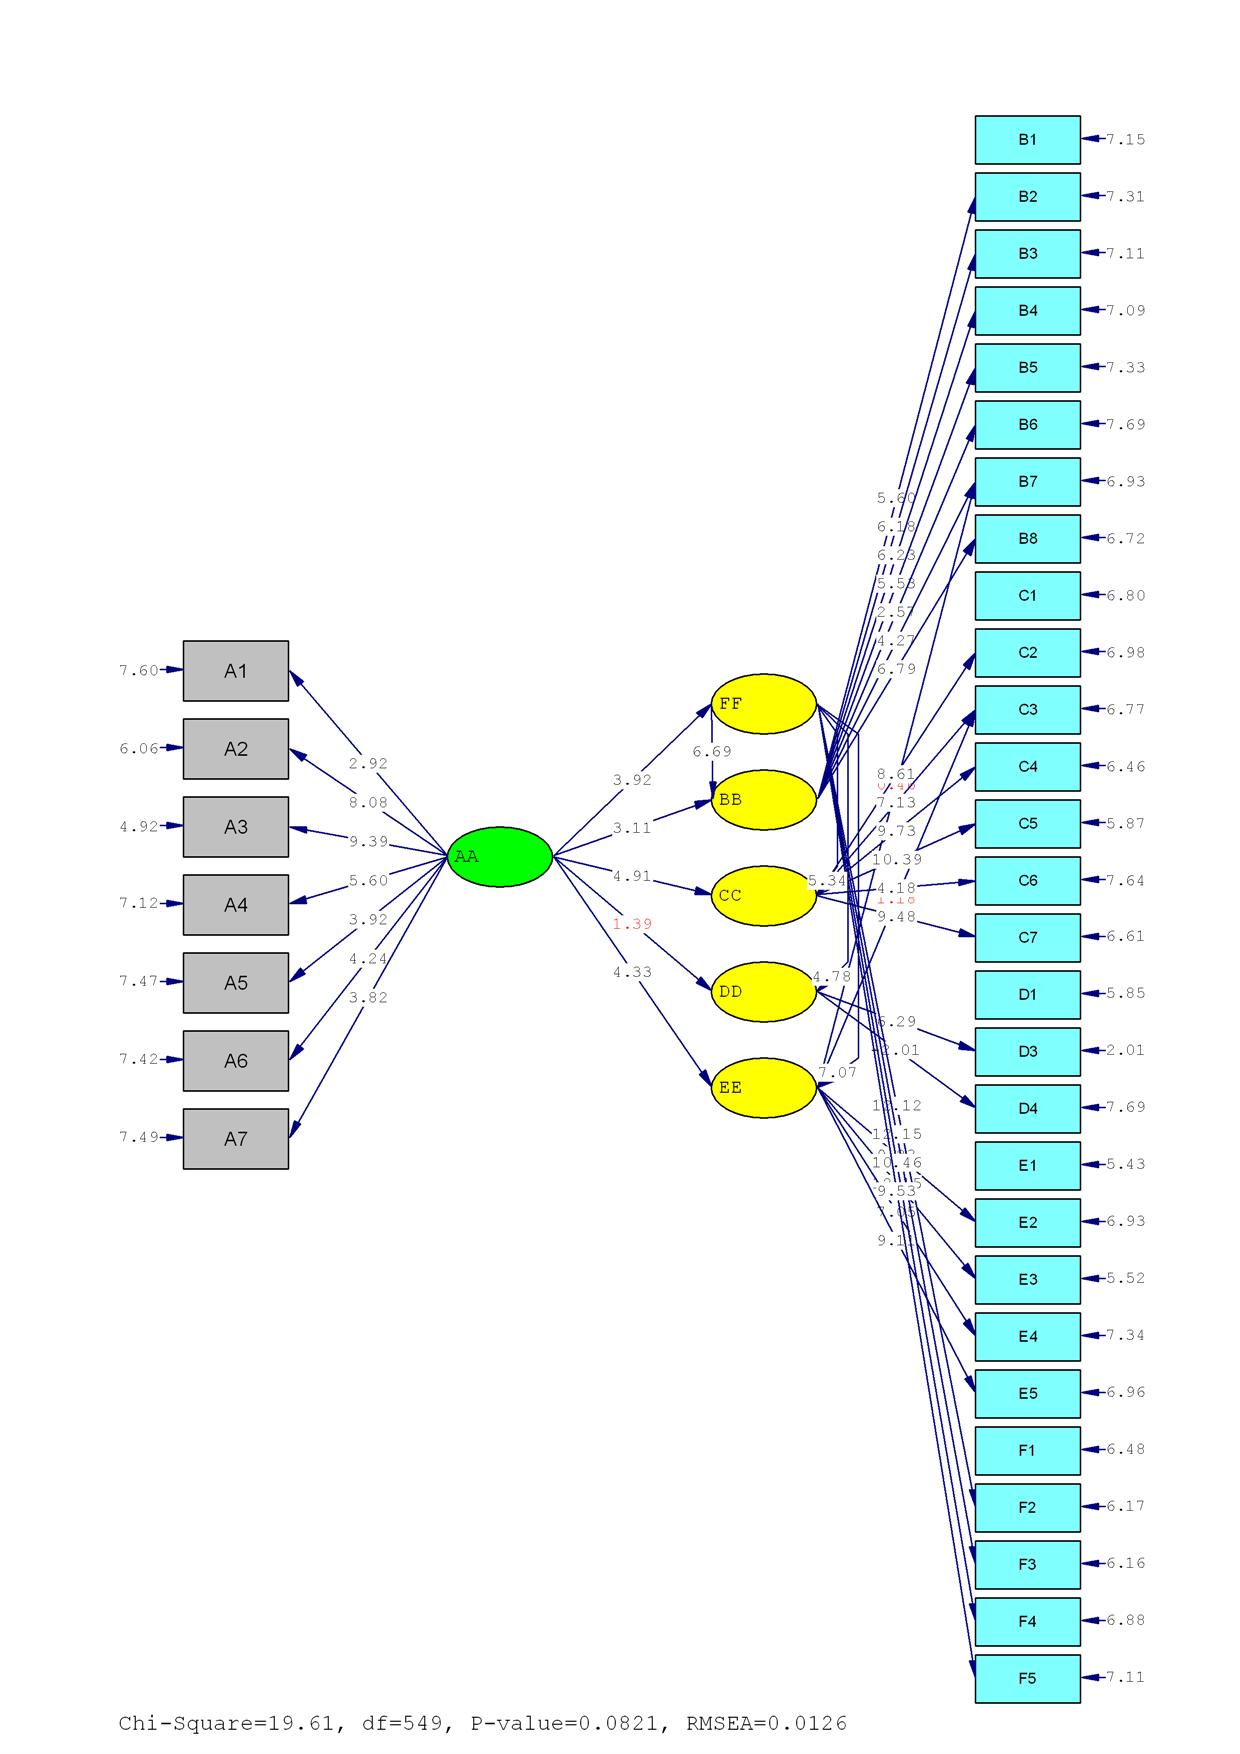 Figure-4 T diagram with six latent variables and 35 observed variables with
values of T
Figure-4 T diagram with six latent variables and 35 observed variables with
values of T
Investigating the research hypotheses that was done using the software showed that only the third hypothesis, which measures the relationship between brand promotions and brand awareness, has not been confirmed in the structural equation model. The other hypotheses confirm the positive and significant relationship between the studied variables of research. The results of the path coefficient of conceptual model are presented in Table 2.
Table-3: Path coefficient of the conceptual model of the latent variables Sales promotions
|
Price sale promotions |
|||
|
Standardized factor loads |
T |
Significance level |
|
|
Brand equity |
0.41 |
3.92 |
0.001 |
|
Quality perception |
0.25 |
3.11 |
0.001 |
|
Brand loyalty |
0.46 |
4.91 |
0.001 |
|
Brand awareness |
0.14 |
1.39 |
0.009 |
|
Brand image |
0.36 |
4.33 |
0.001 |
In this research, the main purpose of the research was to investigate the relationship between sales promotions and brand equity dimensions, which based on which it was attempted five hypotheses based on the existence of a positive and significant relationship between price promotions and brand equity dimensions to be considered. Then, by structural equation modeling and regression analysis, we tried to evaluate these hypotheses. According to Pearson correlation and structural equation modeling, the results confirm the model's validation based on the structural equation model which confirms the existence of relationships between variables in the presented form, as well as confirmation of each of the hypotheses of the research.
In the assumption of the existence of a positive and significant relationship between sales promotions and quality perception, given the frequent use of price promotions among product manufacturers to increase and upgrade sales and even inventory control. Most of the assumption is that price promotions can have a negative effect on quality perception from a customer's perspective. Of course, this assumption (hypothesis) in Ramos’s research in 2008 represents the relationship and the negative impact of price promotions on the quality perception. However, in the present study, the positive relationship between these two components and the positive effect of price promotions was confirmed, and a closer examination of this differentiation in the results can be due to a lack of classification of customers in this research and, in particular, non-separation of price promotions into periodic and public discounted gifts and discounts and loyalty gifts for customers in this research. It seems that price promotions based on customer loyalty, which is a powerful and influential new marketing technique, can have a positive effect on increasing brand equity and even improving customer quality perceptions, while periodic and public promotions can lead to negative outcomes for customer perceptions due to the assumption of mere sales targets or inventory controls (Wallpach et al., 2017).
In the hypothesis of the existence of a positive and significant relationship in price promotions on customer loyalty, as stated in the Ramos’s(2008) study, this hypothesis was confirmed, and in examining the reasons for this relationship, also according to the literature on customer re-purchasing and the use of sales promotion techniques in customer loyalty and theoretical background of this hypothesis is pretty considerable. But in this research, considering the use of marketing programs that are influenced by price promotions in customer loyalty, the reasons for the positive and significant of this factor on customer loyalty can be analyzed. In the hypothesis (assumption) of a positive and significant relationship between price promotion and brand awareness as well as brand image, including theoretical foundations, the relationship between the mouth-to-mouth advertising of the customers and the change of perception of the brand as the next effect after implementing price promotions on the brand (Hudson et al., 215) can be referred which clearly can be effective in increasing brand awareness, as well as the presentation of promotional gifts offered in the form of exquisite sales gifts based on customer loyalty, can be effective in promoting the customer's mental image of the brand (Manhas, P. ,Tukamushaba 2015).
In the hypothesis (assumption) of the existence of a positive and significant relationship between brand promotions and brand equity as is outlined in the research by Ramos (2008), this research confirms this hypothesis (assumption) that the positive impact of this factor on all aspects of brand equity can confirm this relationship. In this research, considering the outlines of the marketing plans and the conditions of the present research, we were able to partly analyze the relationship between the price promotions and brand equity and its dimensions in the classic men's clothing market and the cultural conditions of our beloved country (Iran), and we hope that the results if this research, together with future research, can be used as a basis for planning and implementing marketing plans in this industry and in the market of our beloved country (Iran), whether by marketing experts or, on the other hand, loving ones active in this field.
Considering the underpinned role of by brand equity in the long-term marketing activities of companies, especially clothing companies (due to the prestigious nature of the product), the need to consider this in designing the marketing strategies of companies active in this field seems twofold, and since in designing marketing plans, the need to identify the point of equilibrium in sales plans and brand promotion programs requires the proper recognition of the factors affecting these programs, according to the results of this study, , several recommendations in future marketing plans are presented as following:
1- Focusing on the classification of customers and, consequently, designing sales promotion programs tailored to the needs of each class in a specific way.
2- Designing price promotions focusing on value added gifts in sales promotional programs in the upper classes of customers.
3- Focus on discounted price promotions in the lower classes of customers based on customer loyalty programs.
4- Focus on discount sales promotional programs based on customer loyalty programs.
5- Non-frequent use of discount promotional programs at time intervals with close intervals.
REFERENCES:
Aaker, D. A., & joachimsthaler, E. (2000). Brand Leadership. London: free Press.
Aaker, J. (1997). “Dimensions of Brand Personality”, Journal of Marketing Research, 34 (3), 347-356.
Ahmadi, P., Jafarzadeh Kenari, M., Bakhshi Zadeh, A. (2014). A look at brand identity and its impact on brand loyalty and brand equity (Case Study, Dairy Products and Meat Products). Quarterly Journal of Business Research, 71, 93-65.
Al-hawari, M., (2015). How the personality of retail bank customers interferes with the relationship between service quality and loyalty. International Journal of Bank Marketing, 33(1), 41-57 http://dx.doi.org/10.1108/IJBM-09-2013-0096 .
Centeno, D., Wang, J., (2016). Celebrities as human brands: An inquiry on stakeholder-actor co-creation of brand identities. Journal of Business Research, http://dx.doi.org/10.1016/j.jbusres.2016.10.024 .
Dawes, J., Meyer-Waarden, L., Driesener, C., (2015). .Has brand loyalty declined? A longitudinal analysis of repeat purchase behavior in the UK and the USA. Journal of Business Research, 68, 425–432.
Du Preez, R., Bendixen, M. (2015). The impact of internal brand management on employee job satisfaction, brand commitment and intention to stay. International Journal of Bank Marketing. 33(1), 78 – 91.
Farhadloo, M., Patterson, R., Rolland, E., (2016). Modeling customer satisfaction from unstructured data using a Bayesian approach. Decision Support Systems. http://dx.doi.org/10.1016/j.dss.2016.06.010 .
Fazli, S. Hooshangi, M. Hosseini, S.A (2014). The relationship between relational capital and buyer performance. International Research Journal of Applied and Basic Sciences. 4 (12): 4337-4341
Fazli, S., Amin Afshar, Z. (2016). Investigating the Direct Role of Supply Chain Drivers and the Moderating Role of Organizational Culture in Improving Supply Chain Performance (Case Study: Manufacturing Companies of Qazvin Province). Journal of Industrial Management Studies. 14(41), 109-134.
Ghodeswar, B. M. (2008). Building brand identity in competitive markets: a conceptual model. Journal of Product & Brand Management, 17 (1), 4-12.
Haddadian, A., Kazemi, A., Feiz Mohammadi, F., (2016). Investigating the effect of customer identification with brand on loyalty due to service quality, trust and perceived value: (Case study: Homay Five Star Hotel in Mashhad)
Hooshangi, M. Fazli, S. Mirhosseini, S.S. (2016). The mediation role of buyer’s satisfaction in relationship between structural capitals with performance. Int. J. Logistics Systems and Management, 23(3), 329- 342.
Hooshangi, M., Salehi Sadaghiani, J., Astaneh, M.R. and Amin Afshar, Z. (2017).The mediation role of supply chain integration in relationship between employee commitment with organizational performance. International Journal Business Information Systems, 24(2), pp.210–226.
Hudson, S., Roth, M., Madden, T., Hudson, R., (2015). The effects of social media on emotions, brand relationship quality, and word of mouth: An empirical study of music festival attendees. Tourism Management 47, 68-76.
Jiang, H., Zhang, Y., (2016). An investigation of service quality, customer satisfaction and loyalty in China's airline market”, Journal of Air Transport Management, 57, 80-88.
Kapferer, J.-N. (2008). the new strategic brand management: creating and sustaining brand equity long term (4th ed.). London, England: Kogan Page.
Keller, K.L. (1999). Managing brands for long time: Brand reinforcement and revitalization strategies. California Management Review, 41 (3), 102- 124.
Keller, K.L. (2006). Building strong brand: Three models for developing and implementing brand plans. University of Minnesota.
Keller, K.L. (2008). Strategic Brand Management - building, Measurig, and Managing Brand Equity (Third ed.). United States: PEARSON - Prentice Hall.
Kotler, P., & Keller, K. L. (2006). Marketing management (12 ed.). New Delhi: Prentice-Hall of India.
Krystallis, A., Chrysochou, P., (2014). The effects of service brand dimensions on brand loyalty. Journal of Retailing and Consumer Services 21 (2014) 139–147.
Lee, D., Moon, J., Kim, Y., J., Yi, M. Y., (2015). Antecedents and consequences of mobile phone usability: Linking simplicity and interactivity to satisfaction, trust, and brand loyalty. Information & Management, 52, 295–304
Manhas, P., Tukamushaba, E., (2015). Understanding service experience and its impact on brand image in hospitality sector. International Journal of Hospitality Management, 45, 77–87.
Murali, S., Pugazhendhi, S., Muralidharan, C., (2016). Modeling and Investigating the relationship of after sales service quality with customer satisfaction, retention and loyalty – A case study of home appliances business. Journal of Retailing and Consumer Services 30, 67–83.
Nazari-Shirkouhi, S., & Keramati, A. (2017). Modeling customer satisfaction with new product design using a flexible fuzzy regression-data envelopment analysis algorithm. Applied Mathematical Modelling, 50, 755-771.
Nazari-Shirkouhi, S., Keramati, A., & Rezaie, K. (2015). Investigating the effects of customer relationship management and supplier relationship management on new product development. Tehnički vjesnik, 22(1), 191-200.
Ponte, E., Carvajal-Trujillo, E., Escobar-Rodríguez, T., (2015). Influence of trust and perceived value on the intention to purchase t ravel on line: Integrating the effects of assurance on trust antecedents. Tourism Management, 47, 286-302.
Sakaran, A. (2005). Research Methods in Management (Third Edition), (M. Shirazi, Translator) Tehran: Institute for Management and Planning Education and Research.
Sani, M., Salvation, S., (2016), Investigating the Effect of Employer Brand Attraction on Elite Employment Trend (Case Study: Subsidiaries of the Ministry of Petroleum). Journal of Business Management Scientific and Research, Faculty of Management, Tehran University, 8(1), 228-205.
Sarmed, Z., Bazargan, A., and Hejazi, A. (2007). Research Methods in Behavioral Sciences (Twelfth Edition) Tehran: Agah Publication.
Schultz, D.E & Barnes, B.H. (1999), Strategic Brand Communication Campaigns, (5th Ed), NTC Contemporary.
Scotti, D., Dresner, M., Martini, G., (2016). Baggage fees, operational performance and customer satisfaction in the US air transport industry. Journal of Air Transport Management, 55, 139-146.
Shams, R (2004). Investigating the relationship between selected marketing elements and the brand equity features of cell phones among the youth age group in Tehran. Graduate Dissertation, Tehran University.
Shirazi, A., Zaynvrdrrstani, H. And Karimi Mazidi, A. R (2014). Investigating the Effect of Brand Identity on Customer Loyalty: From the Viewpoint of Social Identity. Iranian Journal of Management Studies, 6 (2), 153-178.
So, K. K. F., King, C., Sparks, B. A., & Wang, Y. (2016). The role of customer engagement in building consumer loyalty to tourism brands. Journal of Travel Research, 55(1), 64 e78.
So, K., King, C., Hudson, S., Meng, F., (2017). The missing link in building customer brand identification: The role of brand attractiveness. Tourism Management. 59, 640 -651.
Tuan, N., (2015). The Impact of Ethical Sales Behavior on Customer Loyalty: A Case from Vietnam. International Journal of Business and Management; 10(3).
Upshaw, L. B. (1995). Building brand identity: A strategy for success in hostile marketplace. John wiley & sons, Inc.
Urde, M. (1999). Brand orientation: A mindset for building brands into strategic resources. Journal of Marketing Management, (15), 117-133.
Voorhees, C. M., White, R. C., McCall, M., & Randhawa, P. (2015). Fool's gold? Assessing the impact of the value of airline loyalty programs on brand equity perceptions and share of wallet. Cornell Hospitality Quarterly, 56(2), 202 -212.
Wallpach, S., Voyer, B., Kastanakis, M., Mühlbacher, H., (2017). Co-creating stakeholder and brand identities: Introduction to the special section”, Journal of Business Research 70 (2017) 395 –398.
Wood, L. (2000). Brands and brand equity: definition and management. Management Decision, 38 (9), 662-669.
Xu, X., Li, Y., (2016). The antecedents of customer satisfaction and dissatisfaction toward various types of hotels: A text mining approach. International Journal of Hospitality Management, 55, 57–69.
Yadin, D. (2002). The international dictionary of marketing. London, United Kingdom: Kogan Page.
Zehrer, A., Raich, F., (2016). The impact of perceived crowding on customer satisfaction. Journal of Hospitality and Tourism Management, 29, 88-98.