Pacific B usiness R eview I nternational

A Refereed Monthly International Journal of Management Indexed With THOMSON REUTERS(ESCI)
|
Vinaytosh Mishra Assistant Professor Quantitative Techniques and Operations Management Area FORE School of Management, New Delhi, India |
The triangle of equity, efficiency, and thecost has been the predominant topic of the discussion among health economists and health policy analysts for decades. The cost of healthcare is the principle of health equity and obstructs the healthcare inclusion in developing countries like India, where seventy-five percent of the population is not covered by any state sponsored health insurance. There have been efforts for healthcare inclusion in recent years, but it is too little too late. In case of achronic disease like diabetes, the life time cost of the care is too high to adhere to the medication regimen. The efficient use of resources can help making healthcare available at reduced cost. This paper represents efficiency analysis of a diabetic clinic over the measurement period of three months. We have used Data Envelopment Analysis (DEA) models as the efficiency measurement tool. The model uses the average number of physicians and allied health professional as input while an average number of patient served (with same service level) as output. Theresult indicates that the efficiency of diabetes clinic is 0.937 and it still has thescope of improvement. The paper further discusses the reason for thegap and recommends managerial implication of the analysis.
Keyword : Data Envelopment Analysis, Efficiency, Diabetes Clinic, Healthcare
India has progressed on many financial indicators but poverty is still real context of India. Around one fifth of the Indians, still live below poverty line and earn paltry $1.9 per day. India has one of the largest private health sectors in the world with over 80 per cent of ambulatory care being supported through out-of-pocket expenses (Gangolli et al, 2005). This situation makes it critical to provide state run healthcare in India. The healthcare in developing country like India, should be low cost to keep treatment in reach of the poor. At the same time the healthcare should not be wasteful to cost tax payers money (Balarajan et al, 2011). The triangle of equity, efficiency and cost has been the much discussed topic for the health policy analysts for decades. How does one best reconcile the tension between the corners of ensuring equity with efficiency and control total costs without putting much burden on government exchequer? (Bevan et al, 2010). The government spending on healthcare has been paltry as percentage of GDP, when we compare it with other developing and developed countries. India spends only 5% annual gross domestic product (GDP) on health care (Prinja et al, 2012).The country has one of the largest private health sectors in the world with over 80 per cent of ambulatory care being supported through out-of-pocket expenses (Duggal, 2007). The government has put ceiling on healthcare cost in many medical treatment areas from time to time. This situation makes it necessary for the private organizations to provide the service in efficient manner.
The healthcare should add value to its consumers. The value is defined as outcomes relative to costs and it encompasses efficiency. Cost reduction without regard to the outcomes achieved is dangerous and self-defeating, leading to false “savings” and potentially limiting effective care (Porter, 2010). Some of the recourse suggested by the researchers is optimization of service (Smith‐Daniels et al, 1999), differential pricing (Fisher III, 2007), and optimization of supply chain (Farahani & Elahipanah, 2008). To achieve the efficiency we need to measure it, with respect to efforts being taken to improve it (Zimmerman, 1993). This study takes an attempt to measure the efficiency of a diabetes clinic with respect to similar healthcare organization.
Equity is the state of being fair, hence closely related to justice (Braveman, 2003). The exorbitant cost of healthcare is considered against the principle of equity. Some researchers see it as sacrifices of the service provider and rewards for the patient. The studies observe that no organization can neglect either revenue expansion or cost reduction for being profitable. In India healthcare efficiency can solve the problem of cost as well as inclusion (Rust el al ,2002). Unless healthcare policy makers tackle the problem of escalating healthcare costs, a decreasing proportion of the citizens in developing countries will be able to afford high-quality healthcare.A continuous and relentless pursuits of innovations for efficiency is necessary in healthcare delivery (Koning et al,2005). The industrialization of healthcare offers a viable alternative that can provide better economy, greater efficiency, and better service.
Being effective is about doing the right things, while being efficient is about doing things right. Effectiveness relates the input or the output to the final objectives to be achieved. The outcome is often linked to welfare or growth objectives and therefore may be influenced by environmental factors. These environmental factors include regulatory framework, competitive framework, socio-economic background, climate, economic development, functioning of the public administration. The effectiveness is more difficult to assess than efficiency, since the outcome is influenced by many political choice (Mandl et al, 2008).
Figure 1: Conceptual framework of efficiency and effectiveness
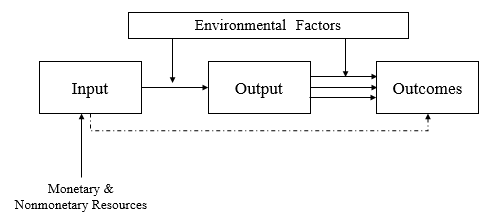
The analysis of efficiency and effectiveness is about the relationships between inputs and outputs. It is imperative to find out means to increase the output by simply increasing the efficiency, without absorbing further resources in healthcare (Farrell,1957). Private organizations have objective to maximize the shareholder value but same is not true in case of healthcare organizations. The measurement of efficiency in public sector and sectors like healthcare & education have been a conceptual challenge. The need to measure organizational performance along with its various dimensions has led to the development of a large number of parametric and non-parametric performance indicators (Karlaftis,2004).
An organization’s efficiency is defined as the ratio of the sum of its weighted outputs to the sum of weighted inputs (Thanassoulis et al,2008). The idea of an organization’s efficiency and effectiveness was first coined about hundred year ago (Barnard,1938). Barnard defined effectiveness in terms of organizational goal attainment and efficiency in terms of satisfaction and cooperation of organizational participants. Another school of thought relating to scientific management describes efficiency in term of goal attainment (Thompson,1967).
Efficiency can be defined as capability to avoid wasting of resources and time in producing a desired service or product. In industrial engineering, it is a measure of the extent to which input is well used for an intended output. The efficiency of healthcare system can be considered as achieving same service level at reduced costs or higher quality at lower cost (MA, 1994). The evaluation of healthcare delivery can take two types of studies. The first type of study evaluates factors like burden of disease, cost of illness, and health care utilization, and may be descriptive in nature.The other type is normative health economics studies, which provide helpful information to health care policy makers seeking to increase the efficiency of health care delivery (Schlander, 2010).
Types of Efficiency
The idea of efficiency includes to an optimal situation; the maximum output for a given level of input or the minimum input for a given level of output. The various type of efficiency defined in literatures are as below (Ishizaka & Nemery, 2013).
1. Technical Efficiency: In which both output and inputs are measured in physical term (Pestana Barros ,2004)
2. Cost Efficiency: Identical to technical efficiency, except that cost information about input is added.
3. Revenue Efficiency: Identical to technical efficiency, except that price information about output is added.
4. Profit Efficiency: In this case cost information of input as well as price information of output both added in the model.
Efficiency in Healthcare
In healthcare literature, efficiency is defined as achieving given effect with least cost or with a given amount of resources achieving the greatest result (Thompson,1967). Thus, assessment of efficiency requires measurement of resources as well as system outcomes. In healthcare economics literature efficiency of a hospitals is frequently defined in terms of their occupancy rate. Caeteris paribus, a hospital is more efficient,if it utilizes its facilities more, which may be termed as occupancy rate (Rushing, 1974). There have been a larger number of studies about occupancy rates in hospitals, most concerned with the relationship between hospital size and occupancy (Davis,1969; Hefty,1969; Jonsson,1975).The probable determinants of efficiency between profit and non-profit hospitals may be different because first one is primarily an economically oriented organization while the other one is not. In profit-making organizations, economic outcomes and criteria exert greater influence on decision making (Rushing,1974).
The health maximization models fail to reflect the public aversion towards inequalities in health outcomes. This aversion could be incorporated into resource allocation decisions by using an appropriately specified social welfare function(SWF). Inclusion of SWF would enable researchers to capture both efficiency and equity considerations (Wagstaff,1991).There are plenty of recent literatures on economic evaluation of health care programmes but little attention has been paid to the theoretical foundations of cost-effectiveness and cost utility analyses (Birch & Gafni, 1992).This study analyses the efficiency of a private diabetes clinic. The outcome analyzed here is number of patients served by the clinic.
There are two type of efficiency analysis methods. The parametric methods involving the stochastic frontier production function and the non-parametric methods involving the data envelopment analysis(Jarzębowski,2013). While parametric method uses production, cost, profit and revenue functions for defining and estimating frequency the nonparametric methodology involves mainly the use of linear programming techniques (Ajibefun, 2008). The researches has used the both methods in isolation, while joint use can improve the accuracy of both, although some methodological difficulties can arise (Zamorano & Cervera,2001).
Parametric Methods
In deterministic parametric frontier function all observations are restricted to be below or on the function when calculating the parameters. This section discusses theHomothetic form with a Cobb-Douglas kernel function allowing in a simple way variable returns to scale (Forsund,1992):
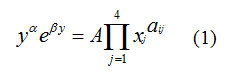
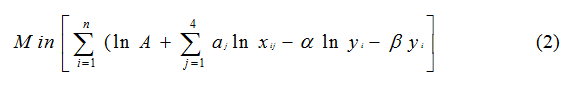
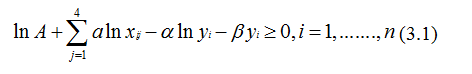
The logarithmic form of the above mentioned function is linear in the parameters. The reason of fittingbest practice frontiers is that the function should show the observed units as efficient as possible (Farrell,1957; Afriat,1972). This can be achieved by minimizing the sum of deviations from the frontier (Aigner & Chu,1968). The frontier function in above equation can be established by solving the following linear programmingproblem (Hjahnarsson,1996).
Subject to
Linear homogeneity of the kernel function:
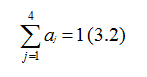 (3.2)
(3.2)
 (3.3)
(3.3)
In this method, the Optimal scale is of special interest. The scale elasticity function is given by following equation:
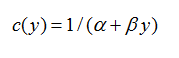 (4)
(4)
Non-Parametric Methods
A non-parametric method doesn’t require specification of a functional form. Unlike parametric method discussed in earlier section (such as ordinary least square, maximum likelihood estimation or stochastic frontier analysis), in this method inputs and outputs are used to compute a hull representing the efficiency frontier (Charnes et al,1978).More than four thousand research articles about Data Envelopment Analysis (DEA) have been published in scientific journals till year 2007 (Emrouznejad,2008).The literature suggest that DEA is a widely accepted method for analysis of the efficiency. This research work uses DEA for analyzing the efficiency of the diabetic clinic.
Data Envelopment Analysis
Data Envelopment Analysis (DEA) is used to measure the performance of an organization (called decision making units, DMUs) using multiple inputs and outputs. What distinguishes DEA from other optimization methods is that weight assigned to input and outputs are not assigned by users and calculated by the model itself.DEA is suitable for private as well as public sector organizations hence was selected as method of choice for analyzing the efficiency of the diabetes clinic in this paper.
In DEA, each DMU’s score is calculated relative to an efficient frontier. The DMU’s placed on the efficient frontier (A,B,D)have an efficiency score of 1. The DMU’s placed beneath the efficient frontier (C, E, F) have efficiency score less than one. Since no DMU can have efficiency more than 1 hence it is impossible to locate a DMU above the efficient frontier (Fig 2).
Figure 2: Efficient Frontier in DEA
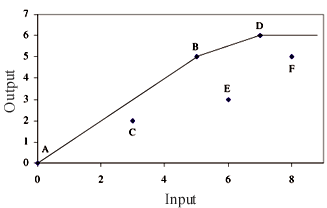
The efficiency calculated using DEA is a relative measure, hence even a DMU assigned 100% efficiency have further scope of improvement in their productivity. There are basically two types of DEA Models giving two different types of frontiers. One model assumes constant returns to scale (CRS model) applicable when all DMUs are operating at an optimal scale, which is an ambitious assumption to take. Second model assumes variable returns to scale (VRS model) and is applicable for most of the real-life scenarios (Ishizaka & Nemery,2013).
DEA is a benchmarking technique and provide efficiency score about a DMU’s capacity to improve on input or output depending on the orientation. A DEA model can be input-oriented or output-oriented. The input orientation attempts to minimize input for a given level of output while output orientation strives to maximize output for a given level of input. In private healthcare organization,the decision maker doesn’t have control over the number of patients served hence the output orientation is better suited for this situation. For output like profit margin we don’t have control over output but we can maintain the same level of quality by standardizing the process of delivery, hence again the orientation suitable for the problem is output orientation.
Constant Returns to Scale
This model is appropriate when every DMU operates at optimal scale. The efficiency is defined as the maximum of a ratio of weighted output to weighted inputs subject to the condition that the similar ratios for every DMU be less than or equal to unity(Charnes et al,1978). If s is the number of output, m be the number of inputs and TEk will be technical efficiency of DMU k for k=1,2 …, n.
Then
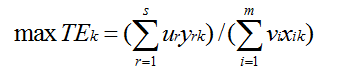 (5)
(5)
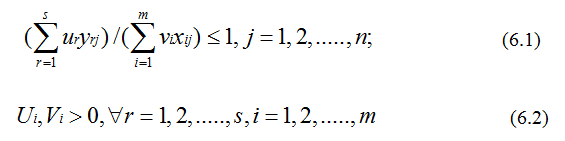
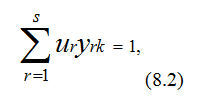
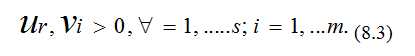
Where is the quantity of output r produced by DMU k, is the quantity of input i consumed by DMU k, is the weight of output r, and is the weight of input i. The technical efficiency of DMUk is maximized under two constraints:
Subject to,
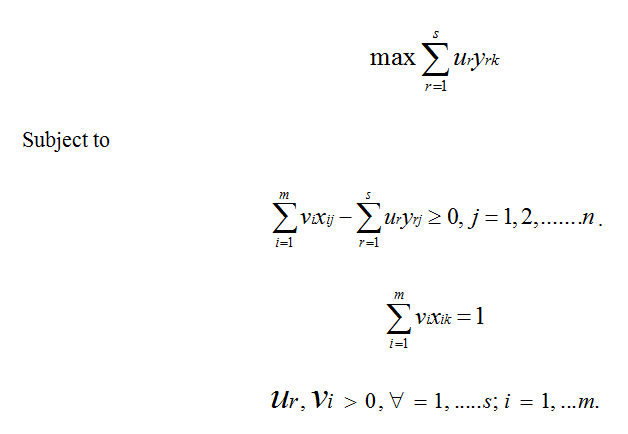
As discussed earlier in output orientation model we minimise the input as following:
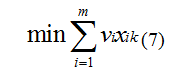 (7)
(7)
Subject to,
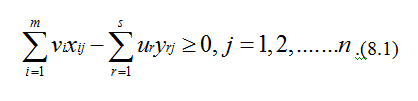
Similarly, for input -oriented model we solve the objective function which maximizes the weighted sum of the outputs.
Variable Returns to Scale
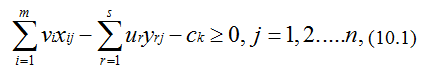
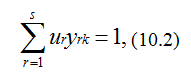
The VRS model is appropriate for variable return of scale and all DMUs not operating at the optimal scale (Banker et al ,1984). The objective function which we try to minimize in case of VRS output oriented model includes a measure of returns to scale on variable axis, Ck , for the DMU k :
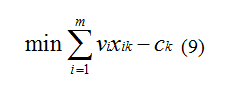 (9)
(9)
Subject to,
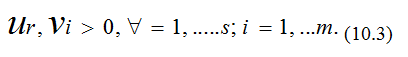
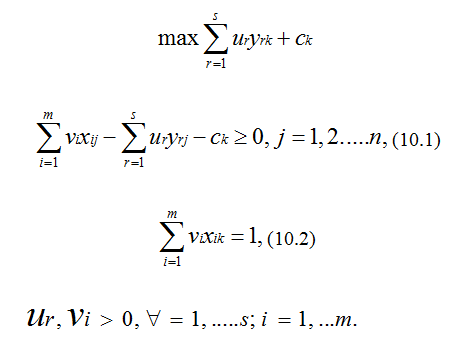
For VRS input-oriented model we can write the objective function as:
Case Study
This section discusses the use of DEA for measuring the efficiency of a private diabetes clinic. In case of private healthcare provider, it is appropriate the assume that the all DMUs are not performing at optimum level. The clinic doesn’t have control over the outputs like number of patients served and profit margin of business hence the problem of measuring the efficiency falls under VRS model with output orientation. This paper analyses the efficiency of the diabetic clinic with respect to seven other clinics. The data was collected using data collection form through the medical record department of the diabetes clinic and the companies operating at same scale. The input variable for the study are number of physician, physician assistant /nurse, receptionist and outreach staffs, while the output being the average number of patients served during the last three months.
Table 1: The Input and Output Data of Diabetes Clinic
|
Period |
Physician |
PA/Nurse |
Receptionist |
Outreach Staff |
Patient Served |
|
DMU1 |
2 |
4 |
2 |
5 |
2250 |
|
DMU2 |
1 |
3 |
2 |
5 |
2100 |
|
DMU3 |
2 |
6 |
2 |
5 |
3000 |
|
DMU4 |
2 |
3 |
2 |
8 |
2800 |
|
DMU5 |
3 |
5 |
3 |
12 |
3000 |
|
DMU6 |
2 |
4 |
2 |
6 |
2800 |
|
DMU7 |
2 |
4 |
2 |
6 |
2600 |
|
DMU8 |
1 |
3 |
2 |
8 |
2400 |
The healthcare providers included in the study are small scale hospitals run by two to three doctors. The hospitals having capacity more than twenty beds are excluded from the study. The organization participating is the study are located in urban area of Varanasi. The paper uses Win4DEAP software for DEA Analysis of the diabetes clinic (Draper& Smith,1998).
The result of the DEA Model is discussed in this section of the paper:
Figure 3: Technical efficiency (CRSTE) decomposed into pure technical efficiency
(VRSTE) and scale efficiency (SE)
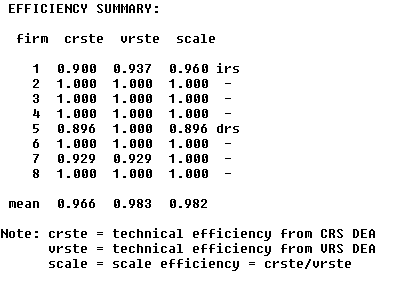
On average, clinics efficiency scores are:
· 96.6 % for CRSTE: The clinics can reduce their input by 3.5 % while serving the same number of patients.
· 98.3% for VRSTE: A better clinic would be able to reduce the inputs by 1.7%.
· 98.2% for SE: By adjusting their scale clinics can reduce their inputs by 1.8%.
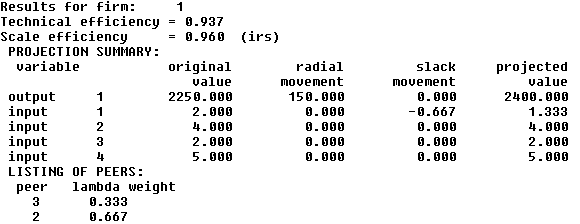
The diabetes clinic referred as firm 1 (Figure 4) has pure efficiency score of 93.7 and a scale efficiency of 96.0%. It is facing an increasing return on scale (IRS). By improving the operation of the clinic, 6.3% of input could be saved. By adjusting the clinic of its optimal size, 4% of input could be saved.The diabetes clinic faces an increasing return to scale that means it is yet to reach its optimal size.
Figure 4: Result table for the diabetes clinic
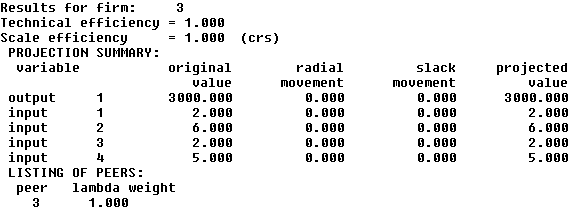
The firm 3 (Figure 5) has a pure efficiency score as well as scale efficiency score is 100%. The firm 3 is facing constant return to scale (CRS). This shows that this clinic is well managed. It can neither improve its pure efficiency nor can save input by adjusting scale. This clinic is using more number of physician assistants and nurses, hence able to utilize their physicians better.
Figure 5: Result table for the third clinic
DEA is a benchmarking technique providing information about a DMU’s capacity to improve output or input. It is advisable to involve the managers of the DMU from very beginning of the process to improve the acceptability of the results. The results of the research recommend that by improving the operation of the clinic, 6.3% of input could be saved while adjusting the scale, 4% of input could be saved. This doesn’t mean that the recommendation should be strictly implemented but it should open a door for constructive discussion about the efficiency score. The diabetes clinic faces an increasing return to scale that means it is yet to reach its optimal size. In order to reduce its average total cost, it has to increase its size. The possible area of growth is the number of physician assistants/nurses because a firm having higher number of physician assistants/nurses have performed better in this study. The efficiency score is not the only criteria to access a DMU’s performance it also depends on management’s objectives. The criteria’s like effectiveness, social welfare and equity should also be considered alongside efficiency for analyzing the performance of a healthcare organization like diabetes clinic.
Acknowledgement
The Infrastructural support provided by FORE School of Management, New Delhi is greatly appreciated.
Afriat, S.N., 1972. Efficiency estimation of production functions. International Economic Review, pp.568-598.
Aigner, D.J. and Chu, S.F., 1968. On estimating the industry production function. The American Economic Review, 58(4), pp.826-839.
Ajibefun, I.A., 2008. An evaluation of parametric and non-parametric methods of technical efficiency measurement: application to small scale food crop production in Nigeria. Journal of Agriculture and Social Sciences.
Balarajan, Y., Selvaraj, S. and Subramanian, S.V., 2011. Health care and equity in India. The Lancet, 377(9764), pp.505-515.
Banker, R.D., Charnes, A. and Cooper, W.W., 1984. Some models for estimating technical and scale inefficiencies in data envelopment analysis. Management science, 30(9), pp.1078-1092.
Bevan, G., Helderman, J.K. and Wilsford, D., 2010. Changing choices in health care: implications for equity, efficiency, and cost. Health Economics, Policy and Law, 5(03), pp.251-267.
Birch, S. and Gafni, A., 1992. Cost effectiveness/utility analyses: Do current decision rules lead us to where we want to be? Journal of health economics, 11(3), pp.279-296.
Braveman, P.A., 2003. Monitoring equity in health and healthcare: a conceptual framework. Journal of health, population and nutrition, pp.181-192.
Charnes, A., Cooper, W.W. and Rhodes, E., 1978. Measuring the efficiency of decision making units. European journal of operational research, 2(6), pp.429-444.
Davis, K.P., 1969. A theory of economic behavior in non-profit, private hospitals (Doctoral dissertation, Rice University).
De Koning, H., Does, R.J.M.M. and De Mast, J., 2005. Lean Six Sigma. Kwaliteit in bedrijf, 21(8), pp.10-13.
Draper, N.R. and Smith, H., 1998. Applied Regression Analysis. Wiley-Interscience. New York, pp.505-553.
Duggal, R., 2007. Poverty & health: criticality of public financing. Indian Journal of Medical Research, 126(4), p.309.
Emrouznejad, A., Parker, B.R. and Tavares, G., 2008. Evaluation of research in efficiency and productivity: A survey and analysis of the first 30 years of scholarly literature in DEA. Socio-economic planning sciences, 42(3), pp.151-157.
Farahani, R.Z. and Elahipanah, M., 2008. A genetic algorithm to optimize the total cost and service level for just-in-time distribution in a supply chain. International Journal of Production Economics, 111(2), pp.229-243.
Farrell, M.J., 1957. The measurement of productive efficiency. Journal of the Royal Statistical Society. Series A (General), 120(3), pp.253-290.
Fisher III, W.W., 2007. When should we permit differential pricing of information? UCLA L. Rev., 55, p.1.
Forsund, F.R., 1992. A comparison of parametric and non-parametric efficiency measures: The case of Norwegian ferries. In International Applications of Productivity and Efficiency Analysis (pp. 21-39). Springer Netherlands.
Gangolli, L.V., Duggal, R. and Shukla, A., 2005. Review of healthcare in India. Mumbai: Centre for Enquiry into Health and Allied Themes.
Hefty, T.R., 1969. Returns to scale in hospitals: a critical review of recent research. Health services research, 4(4), p.267.
Hjalmarsson, L., Kumbhakar, S.C. and Heshmati, A., 1996. DEA, DFA and SFA: a comparison. Journal of Productivity Analysis, 7(2), pp.303-327.
Ishizaka, A. and Nemery, P., 2013. Multi-criteria decision analysis: methods and software. John Wiley & Sons.
Jonsson, E. and Neuhauser, D., 1975. Hospital staffing ratios in the United States and Sweden. Inquiry, 12(2), pp.128-137.
Jarzębowski, S., 2013. Parametric and Non-Parametric Efficiency Measurement–The Comparison of Results. MetodyIlościowe w BadaniachEkonomicznych, 14(1), pp.170-179.
Karlaftis, M.G., 2004. A DEA approach for evaluating the efficiency and effectiveness of urban transit systems. European Journal of Operational Research, 152(2), pp.354-364.
Ma, C.T.A., 1994. Health care payment systems: cost and quality incentives. Journal of Economics & Management Strategy, 3(1), pp.93-112.
Mandl, U., Dierx, A. and Ilzkovitz, F., 2008. The effectiveness and efficiency of public spending (No. 301). Directorate General Economic and Financial Affairs (DG ECFIN), European Commission.
Murillo-Zamorano, L.R. and Vega-Cervera, J.A., 2001. The use of parametric and non-parametric frontier methods to measure the productive efficiency in the industrial sector: A comparative study. International Journal of Production Economics, 69(3), pp.265-275.
Pestana Barros, C., 2004. Measuring performance in defense-sector companies in a small NATO member country. Journal of Economic Studies, 31(2), pp.112-128.
Porter, M.E., 2010. What is value in health care? New England Journal of Medicine, 363(26), pp.2477-2481
Prinja, S., Bahuguna, P., Pinto, A.D., Sharma, A., Bharaj, G., Kumar, V., Tripathy, J.P., Kaur, M. and Kumar, R., 2012. The cost of universal health care in India: a model based estimate. PLoS One, 7(1), p.e30362.
Rushing, W., 1974. Differences in profit and nonprofit organizations: A study of effectiveness and efficiency in general short-stay hospitals. Administrative Science Quarterly, pp.474-484.
Rust, R.T., Moorman, C. and Dickson, P.R., 2002. Getting return on quality: revenue expansion, cost reduction, or both? Journal of marketing, 66(4), pp.7-24.
Schlander, M., 2010. Measures of efficiency in healthcare: QALMs about QALYs? ZeitschriftfürEvidenz, Fortbildung und QualitätimGesundheitswesen, 104(3), pp.214-226.
Smith‐Daniels, V.L., Schweikhart, S.B. and Smith‐Daniels, D.E., 1988. Capacity management in health care services: Review and future research directions. Decision Sciences, 19(4), pp.889-919.
Thompson, J.D., 1967. Organizations in action: Social science bases of administrative theory. Transaction publishers.
Thanassoulis, E., Portela, M.C. and Despic, O., 2008. Data envelopment analysis: the mathematical programming approach to efficiency analysis. The measurement of productive efficiency and productivity growth, pp.251-420.
Wagstaff, A., 1991. QALYs and the equity-efficiency trade-off. Journal of health economics, 10(1), pp.21-41.
Zimmerman, R., 1993. Issues of classification in environmental equity: how we manage is how we measure. Fordham Urb. LJ, 21, p.633.