Pacific B usiness R eview I nternational

A Refereed Monthly International Journal of Management Indexed With THOMSON REUTERS(ESCI)
|
Dr. Preeti Mehra Assistant Professor Lovely Professional University E-mail:- Preeti.23746@lpu.co.in |
Dr. Raghbir Singh Ex Professor Department of University Business School Guru Nanak Dev University, Amritsar |
This study offers and validates a comprehensive approach to explain thelevel of awareness and usage of micro packs have been studied and with an objective to identify the most popular brands, a profile of the most recollected brands has been prepared. In order to attain these objectives a sample of 500 respondents belonging to three cities of Punjab; Jalandhar, Amritsar and Ludhiana and Union territory of Chandigarh was drawn. Judgment sampling was adopted for selecting the respondents. It was however; found that a majority of respondents were aware of the availability of most brands of micro packs in different product categories. However, there is a relatively lesser awareness regarding the availability of micro packs of health care category as compared to the other product categories. Most of the consumers who are aware of the existence of micro packs of products were actually using them as well. The analysis has shown that micro packs of all the products were used more by the respondents of lower income categories in comparison to the higher income categories
Key Words: FMCGs, Availabilty, Brand Recollection
“The stratagem of Micro packs is a ingenious way of marketing consumer goods in developing countries, where myriad customers might only be able to buy, for instance one sachet of a shampoo rather than a whole bottle” (Krishnan, 2006). All customers acquire sachets for some purpose or another; a tiny sachet of cream or toothpaste, for a one time use especially while travelling, or a small pack of a jam, juice or a pack of biscuits for judging a new flavour, a one time use sachet of a dishwasher or detergent meant for a small amount of washing. Available in the form of one time use sachets or small; plastic and glass bottles and are usually priced around `0.50–10 (Gupta & Mehra, 2012). Micro-packs are primarily targeted at lower income groups, travellers and children (Chakravarty, 2004) and are accessible in small nukkad shops as well as big retail outlets.
The model of micro packaging was first adopted by the paan walas. Gauging the positive responses of the consumers, companies briskly launched micro packs of household care, personal care and food and beverages (Mehra, Singh, 2017). Small packs are fancied for various reasons. The freshness of food or beverages is retained; thus requiring no need to store the contents of the pack at all (Gupta, Mehra, 2010 b). In case of health care products as well as food and beverages it also averts the dangers of expired compositions.
Small packs also mean reduced expenses (Kamath, 2009). An assortment of products can also be endeavored at the same expenditure (Mehra, Singh, 2016 b).
One hand where innovators divulgein micro-packs because they are able to try new and latest variants of food and beverages and other products, others prefer them because of the effortlessness in carrying, storing and handling these packs (Gupta, Mehra, 2010 a). Micro-packs of food and beverages and healthcare products are equally fancied among consumers irrespective to their income strata (Mehra, Singh, 2016 a).
The subjective characteristics of a micro-pack are given more importance before making a purchase. Unblemished reputation of a brand, company/brand image, its past performance coupled with winning advertisements and convincing sales efforts by the retailers are the factors that are considered most while buying micro-packs. Objective characteristics such as the attributes of the available micro-packs have also been reflected as crucial while making a procurement decision (Mehra, Singh, 2016 a).
In these advancing markets, it is imperative to have an edge over your competitors. Exteriors of the retail stores play a significant role in building consumer’s perception towards a brand. The conditions, in which a brand is displayed has an influences on perceptions. Displays stimulate customer responses and subsequently lead to purchases (Mehra, Singh, 2016 a)
Micro packs are seen as an omen of success (Gupta, Mehra, 2006). Therefore, marketers have been passionately adopting this strategy across all product categories.
Micro packing is a novel concept and hardly any investigational study has been conducted concerning the awareness and brand recollection of micro packs. Therefore, we have reviewed some studies based on consumer behavior towards small packs in general.
It is proposed by certain researchers that consumer psychology needs to be explored in light of the distinguishing considerations while dealing with a brand selection decision. The governing influence of demographic characteristics like stage in the life cycle, role in family decision-making, income needs to be explored. Factors like packaging and labeling which assists in the consumer while, making a purchase needs also need to be investigated. A good understanding and efficient use of this information could help a company to design its marketing approaches on marketing and brand communications.
Raju and Sheth (1974) explained four key types of buying behaviors; habitual, exploratory, impulsive and belief based behaviors. The study attempted to fit these four types of behaviors into the bigger framework of the absolute purchase behavior of a consumer. Four types of mechanisms were defined in the study; Behavior that was governed by curiosity, Behavior that was governed by belief, Behavior that was governed by habit and Behavior that was governed by situation and it was elaborated that these were connected consecutively in the purchase process. In different stages of choice behavior, any one of these happened to be dominant. The study concluded that the explanation of the logical decision-making process facilitated the consumer to move to the next stage of the purchase cycle in which the habit controlled choice behavior governed his choice behavior. Repetition of the cycle followed, but for an advanced set of wants, needs and desires. Srivastava (1981) outlined that choice is a function of product traits and customer individualities. The study examined that viewpoints based on products and customers were beneficial but might not be sufficient for the marketer. Customers and products do not survive in a vacuum. Both exist in a setting. It was pointed out that products may be perceived as fulfilling customer wants that may have been prompted by internal factors such as needs, drives and external factors such as group norms and communal influence. The study suggested that association of cultural and demographics factors areaffecting the buying behaviors of consumers and could be used by the companies to plan their marketing efforts. Uma and Sasikala (2014) conducted a study on consumers’ perception and buying behavior towards selected products. The study was carried out in various districts of Madurai in Tamil Nadu. The authors emphasized that the decision making process began with need identification and ended with satisfaction. By understanding the consumers’ perception, a marketer can understand how his product or service is viewed. It was also stressed that the study of consumer behavior was significant as it enabled a marketer to comprehend and predict their buying behavior. Swoboda (2001) conducted a study to determine the expectation level consumers have from convenience oriented purchases and the extent to which stores fulfilled these expectations. The study elaborated that the term convenience does not only signify features that customers should experience with a product but also that it was easy to prepare, carry and was available in small quantities. It was also mentioned that research carried in early eighties established links between convenience and families with working ladies. The study applied conjoint and cluster analysis and concluded that convenience shoppers tended to be male, aged lower than 34, self employed, educated, relatively affluent and mostly lived in a single or double person household. Moreover, they had a positive attitude towards convenience, preferred shopping every week, spend a good proportion of their income on food, planned their purchases in advance and were not price sensitive. Weeks (2012) described in his study that consumers were very careful about their spending and out of various strategies that were being employed by the marketers; the offering of small pack had been the best. The study concluded that small packs not only provided the benefit of low cost but also generated the belief that consumption is a measured experience, which meant that a product in a sachet could not be overused, as the quantity would be limited. Silveira and Marreiros (2014) undertook a study to understand the consequences of the shopper marketing approach on marketing and brand communication, centering on point-of-purchase (POP) communication actions and strategies. The authors conducted a qualitative study in which primary data were collected from fourteen shopper-marketing experts, with the help of a snowball sampling technique. The authors explained that the shopper marketing approach was based on the assumption that marketing should tackle and satisfy other needs besides those of the end consumer, and aim at providing consumer a gratifying experience. The results confirmed that one of the biggest aims of shopper marketing was to influence a consumer on the moment of truth. The authors concluded that visual elements in point of purchase (POP) were considered as significant by the consumers and noted them as important in influencing purchase decisions.
Lepiston (1985) examined the development stages that adults experienced as they went up the life cycle. The study suggested that the age perspective could be helpful while understanding various aspects of consumer behavior. As consumers witness age changes, the ways firms market to them also need to be changed. The study emphasized that priorities, criteria for product selection and product use are not constant over the life span of a person. The author concluded that a recognizable benefit of understanding the ageing process and the changing preferences would help the marketer in developing the capability to market with more understanding and intelligence. Barles et al. (2013) conducted a study to analyze which partner has the greatest effect on household grocery purchases. The study was carried out on 300 co-habiting couples. It was termed by the authors that there existed a strong tendency amongst the couples towards joint buying decisions. It was concluded that men and women have different perceptions of the purchase of some products. Where men like to take decisions regarding purchase of products such as stereos and life insurance, women prefer playing a specialized role in the purchase of grocery and house cleaning products. Heath and Curry (1994) observed that consumers might acquire income from different sources and then spend it on different things. The study observed that consumers tended to allocate a particular budget to an expense and then monitored that expense. Spending money on one category lowered the chances of spending more on it in the future. The study aimed at finding out the differences in spending when income was obtained from the decrease in the price rather than increase in the cash income. It was, however, found that consumers were probable to purchase superior quality or complementary goods when an upsurge in income was consequential from a price reduction rather than a rise in money income.
Nancarrow et al. (1998) emphasized that proper understanding of consumer psychological processes and an efficient use of marketing research techniques could help a company to design its food packing and labeling strategies effectively. The authors pointed out that understanding consumer psychological processes would surely give a company an edge over other companies. The study also stressed on the importance of perceptual processes of consumers while seeking information about a pack design and labeling. Shine et al. (1997) emphasized that as the modern consumer was becoming more and more health conscious, their interest in nutrition labeling was also increasing. The authors were also of the opinion that nutrition labeling was a major factor influencing their purchase decisions especially while purchasing food products. It was apparent in the survey conducted by the authors that consumers wanted to read the nutritional labeling, as they wanted to avoid negative nutrients. The authors concluded that the concept of nutritional labeling must be paid importance by food product companies. Deliya (2012) attempted to understand consumer behavior towards FMCG products. He observed that in the modern markets, which were highly competitive, good packaging acquired great significance. It provided a consumer with relevant information and induced him to take positive buying decisions. The author emphasized that a well-designed pack was powerful than advertising as it had a direct impact on the mental perception of the consumers. Estiri et al. (2010) conducted a study on a sample of 175 respondents to examine therelationship between packaging of food products and consumer behavior. The study evaluated packaging elements and studied its effect on the behavior of a consumer. The behavior during three phases was observed that is, before purchase, during the purchase, and after purchase. It was observed by the authors that before a purchase, buyers paid consideration to the packing elements of a specific product, when they felt the need for information collection. The study concluded that while making a purchase, buyers paid attention to instructions mentioned on the food package and image elements like colour, texture and shape of package. After the purchase, a package played two key roles that lead to satisfaction or dissatisfaction. If the package delivered the desired condition for keeping the product it lead to satisfaction. If the performance of the product was lower than their expectation it lead to dissatisfaction. Silayoi and Speece (2004) analyzed the role of packaging in consumer purchase decision- making. They assumed that packaging was a critical factor because it was able to establish communication between the company and the consumer. They also pointed out that a good package enabled a consumer to perceive the quality of a product. They established that visual elements such as graphics, colour, size and shape of the package; and informational elements such as information about the usage and contents of the commodity mentioned on the package helped a consumer in taking a purchase decision. Mahajan et al. (2013) conducted focus group interviews to study the role of packaging and packaging design for improving the sales attractiveness of a product in Chandigarh. They made an attempt to understand the significance of packaging elements on the consumer while selecting a product for purchase. The consumer buying behavior was taken as a dependent variable on packaging elements like colour, printed information, material buying behavior, brand image, background image, innovation and package shape and size, which were considered as independent variables. The authors concluded that as a result of escalating self-service and changes in lifestyles a consumer’s interest in the package of a product was increasing. They were paying more attention to different elements of a package. A package was performing the role of a stimulator and leading to impulsive buying behavior. Ahmed et al. (2014) focused on the role of packaging on the behavior of consumer. They felt that the success of a brand in the market depends on two types of variables; dependent and independent. The authors assumed that packaging was an important factor that influenced the purchase decision of a consumer. They, therefore, suggested that good packaging was a pre-requisite for a brand’s success. Poor packaging of a product may lead to the failure of a product in the market.
The foregoing review of literature exemplifies that attentiveness regarding the availability of small packs, their tangible usage and preferences towards various brands remains a less thoroughly explored area and hardly any comprehensive study has been conducted so far to abridge the gaps in the existing literature. More explicitly, research is required to answer simple yet apt questions related to ‘Are consumers aware of the existence and availability of micro packs in distinctive product categories?’ ‘Do they actually buy the micro packs they are aware of’? And ‘What brands do they actually prefer in each product category’? Hence, in this regard, this study is designed to fulfill the needs of marketers as well as the academicians.
This paper explores the level of consumer awareness regarding availability of micro packs of products offered under Personal Care, Household Care, Food and Beverages and Health Care Categories. The respondents who were aware of micro packs, were further asked to select amongst the micro packs that they were aware of, the products that they have been actually buying and using. Finally a profile of the most recollected brands has been prepared.
The specific objectives of the study are:
1. To explore consumer’s awareness regarding availability of micro packs of the selected FMCG product categories and to investigate if they are actually using them.
2. To explore the reminiscence of micro packs in the specified product categories.
The sample of the study was planned as 500respondents belonging to three cities of Punjab: Amritsar and Ludhiana and Jalandhar and Union territory of Chandigarh. These cities were chosen to represent the three geographical regions of Punjab - Amritsar representing Majha region, Ludhiana representing Malwa and Jalandhar representing Doaba region. Capital city being more cosmopolitan was chosen. The sample was selected with the help of judgment sampling. However, efforts were made to include the respondents belonging to various demographic characteristics. Data were collected through a structured, pre-tested and non-disguised questionnaire.
For the present study income variable has been considered for analysis, as income seems to be important in determining consumers’ preferences towards small packs. The four income categories considered for analysis are: I1 (respondents having monthly income below Rs. 20000); I 2 (Respondents having monthly income between Rs. 20000 and Rs. 40000); I3 (income between Rs. 40000 and Rs. 60000); and I 4 (income above Rs. 60000). The data have been analyzed using chi-squares, percentages and graphical representations.
Analysis and Interpretation
1 : Awareness of micro packs of different product categories
In order to ascertain the awareness of respondents about micro packs, they were questioned about the same and it was revealed that all the respondents surveyed were aware of the presence of micro packs in the market. In order to determine their awareness on micro packs of various types of products, four product categories were identified: ‘Personal Care Products Category’ (which includes products like shampoo, facial cream, bathing soap, toothpaste, talcum powder, and hair oil); ‘Food and Beverages Products Category’ (which covers eatables like biscuits, instant noodles, candies/ chocolates, chips, tea leaves, coffee, jams and sauces); ‘Household Care Products Category’ (which includes detergents and dish wash) and ‘Health Care Products category’ (which covers ointments and tablets). The respondents were questioned about their awareness regarding the products under four categories.
To examine whether there is no association between income earned and awareness for a product category the following null hypothesis has been tested.
HO-1: There is no association between income earned and their awareness for different products belonging to personal care category.
Table 1.a represents the income-wise responses of respondents regarding the awareness of availability of micro packs in personal care products category.
INSERT TABLE 1.a HERE
A glance at Table 1.a reveals that in the Personal Care Products Category, more than 74 per cent of the respondents are aware of the availability of all the products in micro packs. Income-wise analysis of the table reveals that respondents belonging to income categories I1 (lowest income) and I4 (highest income)are relatively more aware of the availability of micro packs of ‘Talcum powder’. Availability of products such as ‘Shampoo’ and ‘Hair Oil’ in micro packs is well known to the respondents of all income categories whereas products such as ‘Bathing Soap’, ‘Toothpaste’, and ‘Talcum Powder’ are proportionately more well known to the respondents belonging to the lower income category I 1.
The results of the Chi-square test show that the hypothesis- “There is no association between income earned and their awareness for different products”- cannot be retained. The Chi-square is greater than the table value with 15 degrees of freedom at 5 per cent level of significance.
HO-2: There is no association between income earned and their awareness for different products belonging to food and beverages category.
Table 1.b represents the income-wise responses of respondents regarding the awareness of availability of micro packs in food and beverages products category.
INSERT TABLE 1.b here
The table highlights that in the Food and Beverages Product Category, more than 80 per cent of the respondents are aware of the availability of these products in micro packs. Respondents of the income category I4 (highest income category) are comparatively more aware of the presence of ‘Instant Noodles’ (90.7%), ‘Tea Leaves’ (89.7%) and Jams (94.8%) in micro packs.
The results of the Chi-square test show that the hypothesis- “There is no association between income earned and their awareness for different products”- cannot be retained. The Chi-square is greater than the table value with 21 degrees of freedom at 5 per cent level of significance.
HO-3: There is no association between income earned and their awareness for different products belonging to household care category.
Table 1.c presents the income-wise responses of respondents regarding the awareness about micro packs in household care products category.
INSERT TABLE 1.c here
A glance at Table 4.4.c reveals that as compared to ‘Detergents’, relatively lesser percentage of respondents is aware of the availability of ‘Dish wash’ (91.2%) in micro packs.
The results of the Chi-square test show that the hypothesis- “There is no association between income earned and their awareness for different products”- cannot be retained. The Chi-square is greater than the table value with 3 degrees of freedom at 5 per cent level of significance.
Table 1.d portrays the income-wise responses of respondents regarding the awareness about micro packs in health care products category.
INSERT TABLE 1.d here
Table 1.d shows that a most of the respondents (about 95%), irrespective of their income category, are aware of the availability of ‘Ointments and Tablets’ in micro packs.
Overall, a satisfactory picture emerged, depicting that respondents are aware of the existence and availability of most of the products in micro packs across all product categories.
2: Usage of micro packs of different product categories
Consumers prefer to purchase low-unit packs because of certain essential advantages attached to the micro packaging Consumers with low income have been adopting small packs as they provide value for money.
The respondents who were aware of micro packs, were further asked to select amongst the micro packs that they were aware of, the products that they have been actually buying and using.
To examine whether there is no association between income earned and usage level for a product category the following null hypothesis has been tested.
HO-4: There is no association between income earned and their usage for different products belonging to personal care category.
Table 2.a represents the overall as well as income-wise responses of the respondents for usage of micro packs belonging to the personal care products category.
INSERT TABLE 2.a here
A glance at Table 2.a reveals that in the case of Personal Care Products Category, out of the respondents who were aware of micro packs almost 76 per cent of them have been using these packs.
Income-wise analysis of the table reveals that most of the respondents of higher income categories I3 and I4 agree on using micro packs of ‘Facial Cream’, only 58-63 per cent of respondents belonging to lower income categories I1 and I2 agree on using the product in micro packs indicating that its usage is more popular with higher income categories. However, it is the contrary in the case with micro packs of ‘Toothpaste’ as they are highly popular with the lower income categories I1 (90.6%) and I2 (90.2%) and lesser by respondents of lower categories I3 (66.7%) and I 4 (63.5%). A trend has been observed in the study that micro packs of all the products are being used more by respondents of lower income categories in comparison to higher income categories with the exception of ‘Facial Cream’.
The results of the Chi-square test show that the hypothesis- “There is no association between income earned and their usage for different products”- cannot be retained. The Chi-square is greater than the table value with 15 degrees of freedom at 5 per cent level of significance.
HO-5: There is no association between income earned and their usage for different products belonging to food and beverages category.
Table 2.b presents the income- wise responses of respondents regarding the usage of micro packs in food and beverages products category.
INSERT TABLE 2.b here
The table highlights that in the Food and Beverages Product Category, more than 49 per cent of the respondents who are aware of micro packs are using them. Relatively lesser percentage of respondents are using ‘Tea leaves’ (49.1%) in micro packs.
Income wise analysis reveals that irrespective of the income categories, the most used micro packs in the Food and Beverages Product Category, are ‘Candies and Chocolates’ and ‘Sauces’. Surprisingly, where more than 64 per cent of the respondents from the higher income categories I3 and I4 are using micro packs of ‘Tea Leaves’.
The results of the Chi-square test show that the hypothesis- “There is no association between income earned and their usage for different products”- cannot be retained. The Chi-square is greater than the table value with 21 degrees of freedom at 5 per cent level of significance.
HO-6: There is no association between income earned and their awareness for different products belonging to household care category.
Table 2.c represents the income-wise responses of respondents regarding the usage of micro packs in household care products category.
INSERT TABLE 2.c here
A glance at Table 2.c reveals that relatively lesser percentage of respondents are using micro packs of ‘Dish wash’ (95.6%). Income-wise analysis shows that in case of both the products, the least usage of micro packs has been by the respondents belonging to highest income category I 4.
The results of the Chi-square test show that the hypothesis- “There is no association between income earned and their usage for different products”- cannot be retained. The Chi-square is greater than the table value with 3 degrees of freedom at 5 per cent level of significance.
Table 2.d exhibits the income-wise responses of respondents regarding the usage of micro packs in health care products category.
INSERT TABLE 2.d here
Table 2.d shows that less number of respondents belonging to the lower income categories I1 and I2 are using healthcare products in micro packs.
An acceptable picture emerged, illustrating that a large number of respondents are using micro packs of most of the products that they are aware of.
3: Most Recalled Brands of Micro Packs
In an attempt to identify the most popular brands, the respondents were requested to recall the brand(s), which they knew to be available in micro packs in all the four categories. The responses are analyzed in the following paragraphs.
3.a Personal Care Products Category
The responses in the personal care products category are projected graphically in Figures 1 to 6.
INSERT Figures 1-6 here
The most well known brand has been “Sunsilk”. It is under the flag of Unilever, which had launched an extensive campaign for its promotion in July 2009. The campaign led to the building of a positive feeling about the brand. In case of facial creams “Ponds Whitening” is the most recalled brand with 42 per cent of the respondents remembering it more than other brands. “Dettol” occupies a dominant position in the respondents’ mind with 26 per cent of the respondents recalling it. “Colgate” (49%) is the most recalled brand in toothpastes. In a bid to understand the rural as well as urban customer, “Colgate” has implemented special promotions that have helped to build awareness for good oral care habits and offered free scholarships to children. These activities, combined with traditional media and promotional events, have contributed to its market share worldwide.“Ponds Talcum” (34%) and “Dabur Amla” (17%) are the other most recalled brands.
3.b Food and Beverages Products Category
INSERT Figures 7-14 here
In the food and beverages products category “Tiger Biscuits”, “Maggi Noodles”, “Munch”, “Frito Lays”, “Marvel”, “Nescafe” and “Kissan” are the most recalled brands in their respective categories.
3.c Household Care Products Category
INSERT Figures 15-16 here
In the household care products category, “Nirma” is the most reminisced brand in Detergents and “Vim” in Dish Washcategory.
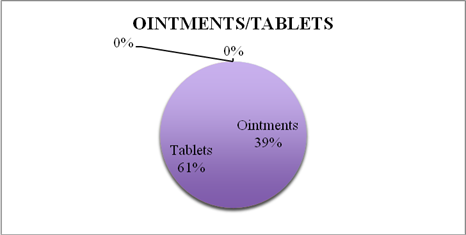
3.d Health Care Product Category
INSERT Figure 17 here
In case of health care product category, tablets are recollected by 61 per cent of the respondents. “Moov” and “Volini” are the other most recalled brands.
The analysis revealed that a majority of respondents were aware of the availability of most brands of micro packs in distinctive product categories. However, there is a relatively lesser awareness regarding the availability of micro packs of health care category as linked to the other product categories. Marketers must upfront visibility of health care micro packs specifically in the semi-urban and rural markets, as prominence is critical for awareness creation and appropriate acquisition decisions.
Most of the consumers who are aware of the presence of micro packs of products were actually using them as well. The analysis has shown that micro packs of all the products were used more by the respondents of lower income categories in comparison to the higher income categories. Micro packs can be made available in sub urban and rural areas in ‘Make Shift Markets’, ‘Weekend Bazars’ and ‘Mobile Vans’ to promote their awareness as well as usage.Products endorsing personal hygiene like ‘Hand Wash’ and ‘Hand Sanitizer’ can be made accessible in micro packs.
During survey, some of the respondents who live in single households also expressed that they do not know how to cook food or simply do not have the time. Pre-mixed products in sachets are available, but in very limited categories like soups and Chinese foods. Marketers can diversify in this category. Basic Indian food preferred by middle and lower class categories like ‘dal’, ‘instant sabzi’ and ‘flavoured curd' could also be made available.
Use of endorsements (print and electronic) and other supplements could strengthen branding at the points of sale or keeping the brand in the consumers’ mind. For this purpose, the companies must advertise in electronic media at the appropriate time slots, when the target demographics would tune in. Advertisements of micro packs of food and beverages can be done more on the channel viewed by children as well as mothers. Advertisements related to Personal care and Household care product categories packs can be advertised on travel and family channels.
Rapidly shifting lifestyles of consumer’s demand that marketers should remain in touch with the needs and perceptions of consumers. Marketing plans and strategies must be identified after the anticipation of consumer needs and aspirations.
1. Cartwright, J. (2007, June 11). Big stars have weather too. Retrieved on 13 June 2016, from://physicsweb.org/articles/news.
2. Deliya, M. (2012). Consumer Behaviour towards the New Packaging of FMCG Products, Abhinav Journal of Research in Commerce and Management , 11, 199-210.
3. Gupta, S. &Mehra, P. (2006).Micro Branding-A Bane or Boon for Customer , Marketing Masterminds , 9 (2), 44-48
4. Gupta, S. &Mehra, P. (2010 a).Micro Branding-A Key Tool of FMCG Pull Strategy, Indian Journal of Marketing , 40 (6), 18-23.
5. Gupta, S. &Mehra, P. (2010 b).An Empirical Analysis of the Factors Influencing Purchase Behaviour of Micro-Brands, Interdisciplinary Contemporary Journal of Marketing Research , 2 (6), 433-449
6. Gupta, S. & Mehra, P. (2014). Conjoint Based Model for Determining Consumer Preference for Micro Packs, Proceedings of 6th IIMA Conference on Marketing in Emerging Economies , 7-9 Jan, IIM Ahemdabad, Gujrat.
7. Heath, C. & Curry, S. (1994).Mental Accounting and Consumer Spending, Advances in Consumer Research , 21, 119-126.
8. Joshi, S. (2004, March 23). Price: The Great Leveler . Retrieved on 23 March 2017, from http://thehindubusinessline.com.
9. Krishnan, A. (2006, May 5). Brand buyouts boost homegrown FMCGs . Retrieved on23 February 2016, from http://thehindubusinessline.com.
10. McEllany, M.R. (1998). Do perceived tie pressure, life cycle stage and demographic characteristics effect the demand for convenience. European Advances in Consumer Research , 3, 155–161
11. Mehra, P. &Singh, R. (2016 a).Consumer Preferences and Purchase Decision-making for Micro-packs - An Empirical Study, Vision- The Journal of Business Perspective , 20(3), 1-13
12. Mehra, P. &Singh, R. (2016 b).Consumer Brand Preferences for Micro Packs- An Empirical Study, Arth Anvesan , 10(1), 35-40.
13. Raju, P. S., & Sheth, J. N. (1974).Sequential and Cyclic Nature of Information Processing Models in Repetitive Choice Behaviour, Advances in Consumer Research , 1, 348-58.
14. Srivastava, R. K. (1981).Usage-Situational Influences on Perception of Product Markets: Theoretical and Empirical Issues, Advances in Consumer Research , 8, 106-111.
15. Uma, K., & Sasikala, P. (2014).Study on Consumer's Perceptions and Buying Behaviour towards Selected Home Appliances Products in Madurai District, Indian Journal of applied Research , 4(4), 87-88
16. Swoboda, B. (2001).Convenience-Orientation B Consumer Preferences and Measurement with Conjoint Analysis, E-European Advances in Consumer
Research , 5, 102-106.
17. Weeks, J. (2012).Big Opportunities from Small Packets, Retrieved on 31 Aug 2012, from www.ipsos.com/content/big-opportunities-small-packets.
18. Silveira, P. & Marreiros, P (2014).Exploring Shopper Marketing Approach Implications on Brand Communication at the Point-of-Purchase: An Expert’s Opinion Qualitative Study, The Journal of Applied Business Research , 30(5), 1329-1336.
19. Lepiston, L. R. (1985).A Life Span Perspective of Consumer Behavior, Advances in Consumers Research , 12, 47-52.
20. Barles, A., Jose, M., Andres, F. &Salinas, M. (2013).Purchase Decision-Making in the Couple Conflict-Solving Tactics, International Journal of Business and Social Science , 4(6), 28-42.
21. Heath, C. and Curry, S. (1994).Mental Accounting and Consumer Spending, Advances in Consumer Research , 21, 119-126.
22. Nancarrow, C., Wright, L. T. &Brace, L. (1998).Gaining Competitive Advantage from Packaging and Labeling in Marketing Communications, British Food Journal , 100(2), 110-118.
23. Shine, A., Reilly, S.&Sullivan, K. (1997).Consumer Use of Nutrition Labels, British Food Journal , 99(8), 290-296.
24. Deliya, M. (2012).Consumer Behaviour towards the New Packaging of FMCG Products, Abhinav Journal of Research in Commerce and Management , 11(1), 199-210
25. Estiri, M., Hasangholipour, T., Yazdani, H., Nejad, H. J. & Rayej, H. (2010).Food Products Consumer Behaviors: The Role of Packaging Elements, Journal of Applied Sciences , 10(7), 535-543.
26. Silayoi, P. & Speece, M. (2004).Packaging and Purchase Decisions: An Exploratory Study on the Impact of Involvement level and Time Pressure, British Food Journal , 16(8), 607-628.
27. Mahajan, S., Vaishya, R., Gupta, A. & Dholle, V. (2013).Role of Packaging for Enhancing the Sales Appeal, Global Research Analysis , 2(7), 111-113.
28. Ahmed, R., Parmar, V. &Muhammad, A. (2014).Impact of Product Packaging on Consumer’s Buying Behavior, European Journal of Scientific Research , 120(2), 145-157.
Table 1.a
Awareness about Micro Packs of Personal Care Products Category
(Income-wise Frequency Distribution of Respondents)
|
Product |
|
Total |
I1 |
I2 |
I3 |
I4 |
|
Shampoo |
Aware (%) |
496 (99.2) |
127 (100) |
152 (97.4) |
120 (100) |
97 (100) |
|
Unaware (%) |
4 (0.8) |
0 (0) |
4 (2.6) |
0 (0) |
0 (0) |
|
|
Facial Cream |
Aware (%) |
428 (85.6) |
112 (88.2) |
130 (83.3) |
100 (83.3) |
86 (88.7) |
|
Unaware (%) |
72 (14.4) |
15 (11.8) |
26 (1.7) |
20 (16.7) |
11 (11.3) |
|
|
Bathing Soap |
Aware (%) |
441 (88.2) |
118 (92.9) |
128 (82.1) |
105 (87.5) |
90 (92.8) |
|
Unaware (%) |
59 (11.8) |
9 (7.9) |
28 (17.9) |
15 (12.5) |
7 (7.2) |
|
|
Toothpaste |
Aware (%) |
422 (84.4) |
118 (92.9) |
123 (78.8) |
96 (80) |
85 (87.6) |
|
Unaware (%) |
78 (15.6) |
9 (7.9) |
33 (21.2) |
24 (20) |
12 (12.4) |
|
|
Talcum Powder |
Aware (%) |
370 (74.0) |
104 (81.9) |
105 (67.3) |
83 (69.2) |
78 (80.4) |
|
Unaware (%) |
130 (26.0) |
23 (18.1) |
51 (32.7) |
37 (30.8) |
19 (19.6) |
|
|
Hair Oil |
Aware (%) |
486 (97.2) |
124 (97.6) |
150 (96.2) |
117 (97.5) |
95 (97.9) |
|
Unaware (%) |
14 (2.8) |
3 (2.4) |
6 (3.8) |
3 (2.5) |
2 (2.1) |
|
|
Total (N) |
500 |
127 |
156 |
120 |
97 |
|
Chi-Square value = 24.01; degree of freedom (d.f.) = 15, significant at 5 per cent level of significance.
Table 1.b
Awareness about Micro Packs of Food and Beverages Products Category
(Income-wise Frequency Distribution of Respondents)
|
Product |
|
Total |
I1 |
I2 |
I3 |
I4 |
|
Biscuits |
Aware (%) |
496 (99.2) |
127 (100) |
152 (97.4) |
120 (100) |
97 (100) |
|
Unaware (%) |
4 (0.8) |
0 (0) |
4 (2.6) |
0 (0) |
0 (0) |
|
|
Instant Noodles |
Aware (%) |
427 (85.4) |
113 (89) |
126 (80.8) |
100 (83.3) |
88 (90.7) |
|
Unaware (%) |
73 (14.6) |
14 (11) |
30 (19.2) |
20 (16.7) |
9 (9.3) |
|
|
Candies/ Chocolates |
Aware (%) |
500 (100) |
127 (100) |
156 (100) |
120 (100) |
97 (100) |
|
Unaware (%) |
0 (0) |
0 (0) |
0 (0) |
0 (0) |
0 (0) |
|
|
Chips |
Aware (%) |
478 (95.6) |
124 (97.6) |
148 (94.9) |
113 (94.2) |
93 (95.9) |
|
Unaware (%) |
22 (4.4) |
3 (2.4) |
8 (5.1) |
7 (5.8) |
4 (4.1) |
|
|
Tea Leaves |
Aware (%) |
411 (80.0) |
110 (86.6) |
120 (76.9) |
94 (78.3) |
87 (89.7) |
|
Unaware (%) |
89 (17.8) |
17 (13.4) |
36 (23.1) |
26 (21.7) |
10 (10.3) |
|
|
Coffee |
Aware (%) |
491 (98.2) |
125 (98.4) |
151 (96.8) |
119 (99.2) |
96 (99) |
|
Unaware (%) |
9 (1.8) |
2 (1.6) |
5 (3.2) |
1 (8) |
1 (1) |
|
|
Jams |
Aware (%) |
451 (90.2) |
117 (92.1) |
136 (87.2) |
106 (88.3) |
92 (94.8) |
|
Unaware (%) |
49 (9.8) |
10 (7.9) |
20 (12.8) |
14 (11.7) |
5 (5.2) |
|
|
Sauces |
Aware (%) |
498 (99.6) |
127 (100) |
154 (98.7) |
120 (100) |
97 (100) |
|
Unaware (%) |
2 (0.2) |
0 (0) |
2 (1.3) |
0 (0) |
0 (0) |
|
|
Total (N) |
500 |
127 |
156 |
120 |
97 |
|
Chi-Square value = 30; degree of freedom (d.f.) = 21, significant at 5 per cent level of significance.
Table 1.c
Awareness about Micro Packs of Household Care Products Category
(Income-wise Frequency Distribution of Respondents)
|
Product |
|
Total |
I1 |
I2 |
I3 |
I4 |
|
Detergents |
Aware (%) |
479 (95.8) |
121 (91.3) |
149 (95.5) |
115 (95.8) |
94 (96.9) |
|
Unaware (%) |
21 (4.2) |
6 (4.7) |
7 (4.5) |
5 (4.2) |
3 (3.1) |
|
|
Dish Wash |
Aware (%) |
456 (91.2) |
119 (93.7) |
141 (90.4) |
105 (87.5) |
91 (93.8) |
|
Unaware (%) |
44 (8.8) |
8 (6.3) |
15 (9.6) |
15 (12.5) |
6 (6.2) |
|
|
Total (N) |
500 |
127 |
156 |
120 |
97 |
|
Chi-Square value = 24.13; degree of freedom (d.f.) =3, significant at 5 per cent level of significance.
Table 1.d
Awareness about Micro Packs of Health Care Products Category
(Income-wise Frequency Distribution of Respondents)
|
Product |
|
Total |
I1 |
I2 |
I3 |
I4 |
|
Ointments/Tablets |
Aware (%) |
478 (95.6) |
124 (97.6) |
148 (94.9) |
113 (94.2) |
93 (95.9) |
|
Unaware (%) |
22 (4.4) |
3 (2.4) |
8 (5.1) |
7 (5.8) |
4 (4.1) |
|
|
Total (N) |
500 |
127 |
156 |
120 |
97 |
|
Table 2.a
Usage of Micro Packs of Personal Care Products Category
(Income-wise Frequency Distribution of Respondents)
|
Product |
|
Total |
I1 |
I2 |
I3 |
I4 |
|
Shampoo (N=496) |
Used (%) |
496 (100) |
127 (100) |
156 (100) |
120 (100) |
97 (100) |
|
Not Used (%) |
0 (0) |
0 (0) |
0 (0) |
0 (0) |
0 (0) |
|
|
Facial Cream (N=428) |
Used (%) |
326 (76.1) |
65 (58.0) |
82 (63.0) |
99 (99.0) |
80 (93.0) |
|
Not Used (%) |
102 (23.8) |
47 (41.9) |
48 (36.9) |
1 (1.0) |
6 (6.9) |
|
|
Bathing Soap (N=441) |
Used (%) |
432 (97.9) |
118 (100) |
127 (99.2) |
102 (97.1) |
85 (94.4) |
|
Not Used (%) |
9 (2.0) |
0 (0) |
1 (0.7) |
3 (2.8) |
5 (5.5) |
|
|
Toothpaste (N=422) |
Used (%) |
336 (79.6) |
107 (90.6) |
111 (90.2) |
64 (66.7) |
54 (63.5) |
|
Not Used (%) |
86 (20.3) |
11 (9.3) |
12 (9.7) |
32 (33.3) |
31 (36.4) |
|
|
Talcum Powder (N=370) |
Used (%) |
353 (95.4) |
103 (99.0) |
102 (97.1) |
80 (96.3) |
68 (87.1) |
|
Not Used (%) |
17 (4.5) |
1 (0.96) |
3 (2.8) |
3 (3.6) |
10 (12.8) |
|
|
Hair Oil (N=486) |
Used (%) |
472 (97.1) |
120 (96.7) |
148 (98.6) |
113 (96.5) |
91 (95.7) |
|
Not Used (%) |
14 (2.8) |
4 (3.2) |
2 (1.3) |
4 (3.4) |
4 (4.2) |
Chi-Square value = 30.0; degree of freedom (d.f.) = 15, significant at 5 per cent level of significance.
Table 2.b
Usage Micro Packs of Food and Beverages Products Category
(Income-wise Frequency Distribution of Respondents)
|
Product |
|
Total |
I1 |
I2 |
I3 |
I4 |
|
Biscuits (N=496) |
Used (%) |
474 (95.5) |
125 (98.4) |
138 (90.7) |
114 (95.0) |
97 (100) |
|
Not Used (%) |
22 (4.4) |
2 (1.5) |
14 (9.2) |
6 (5.0) |
0 (0) |
|
|
Instant Noodles (N=427) |
Used (%) |
393 (92.0) |
103 (91.1) |
118 (93.6) |
88 (88.0) |
84 (95.4) |
|
Not Used (%) |
34 (7.9) |
10 (8.8) |
8 (6.3) |
12 (12) |
4 (4.5) |
|
|
Candies/ Chocolates (N=500) |
Used (%) |
500 (100) |
127 (100) |
156 (100) |
120 (100) |
97 (100) |
|
Not Used (%) |
0 (0) |
0 (0) |
0 (0) |
0 (0) |
0 (0) |
|
|
Chips (N=478) |
Used (%) |
469 (98.1) |
124 (100) |
147 (99.3) |
110 (97.3) |
88 (94.6) |
|
Not Used (%) |
9 (1.8) |
0 (0) |
1 (0.6) |
3 (2.6) |
5 (5.3) |
|
|
Tea Leaves (N=411) |
Used (%) |
202 (49.1) |
35 (31.8) |
44 (36.6) |
67 (71.2) |
56 (64.3) |
|
Not Used (%) |
209 (50.8) |
75 (68.1) |
76 (63.3) |
27 (28.7) |
31 (35.6) |
|
|
Coffee (N=491) |
Used (%) |
469 (95.5) |
122 (97.6) |
133 (88.0) |
118 (99.1) |
96 (100) |
|
Not Used (%) |
90 (19.1) |
3 (2.4) |
18 (11.9) |
1 (0.8) |
0 (0) |
|
|
Jams (N=451) |
Used (%) |
444 (98.4) |
116 (99.1) |
134 (98.5) |
104 (98.1) |
90 (97.8) |
|
Not Used (%) |
7 (1.5) |
1 (0.8) |
2 (1.4) |
2 (1.8) |
2 (2.1) |
|
|
Sauces (N=498) |
Used (%) |
498 (100) |
127 (100) |
154 (100) |
120 (100) |
97 (100) |
|
Not Used (%) |
0 (0) |
0 (0) |
0 (0) |
0 (0) |
0 (0) |
Chi-Square value = 42.13; degree of freedom (d.f.) = 21, significant at 5 per cent level of significance.
Table 2.c
Usage of Micro Packs of Household Care Products Category
(Income-wise Frequency Distribution of Respondents)
|
Product |
|
Total |
I1 |
I2 |
I3 |
I4 |
|
Detergents (N=479) |
Used (%) |
469 (97.9) |
121 (100) |
149 (100) |
115 (100) |
84 (89.3) |
|
Not Used (%) |
10 (2.08) |
0 (0) |
0 (0) |
0 (0) |
10 (10.6) |
|
|
Dish Wash (N=456) |
Used (%) |
436 (95.6) |
119 (100) |
141 (100) |
105 (100) |
71 (78.8) |
|
Not Used (%) |
20 (4.38) |
0 (0) |
0 (0) |
0 (0) |
20 (21.9) |
Chi-Square value = 24.0; degree of freedom (d.f.) = 3, significant at 5 per cent level of significance.
Table 2.d
Usage of Micro Packs of Health Care Products Category
(Income-wise Frequency Distribution of Respondents)
|
Product |
|
Total |
I1 |
I2 |
I3 |
I4 |
|
Ointments/Tablets (N=478) |
Used (%) |
376 (78.6) |
96 (77.4) |
106 (71.6) |
92 (81.4) |
82 (88.1) |
|
Not Used (%) |
102 (21.3) |
28 (22.5) |
42 (28.3) |
21 (18.5) |
11 (11.8) |
Figure: 1: Most Recalled Shampoo Brands
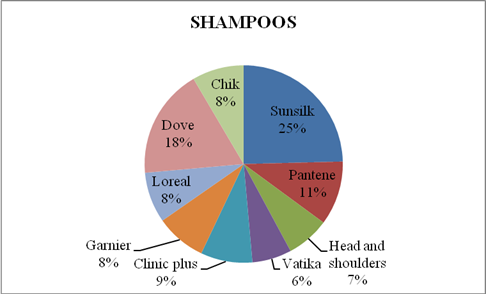
Figure 2: Most Recalled Facial Cream Brands
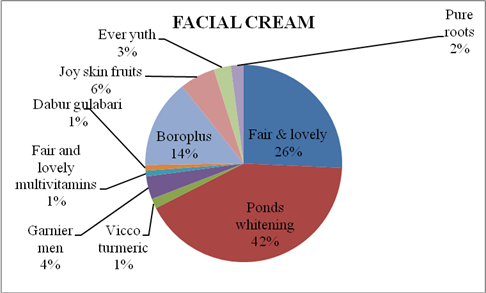
Figure 3: Most Recalled Bathing Soap Brands
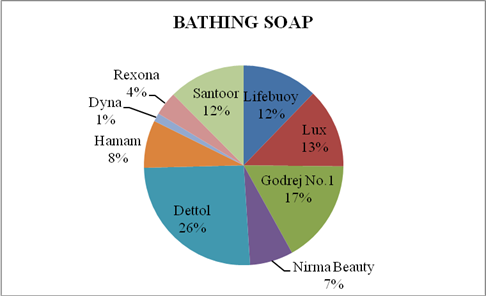
Figure: 4: Most Recalled Toothpaste Brands
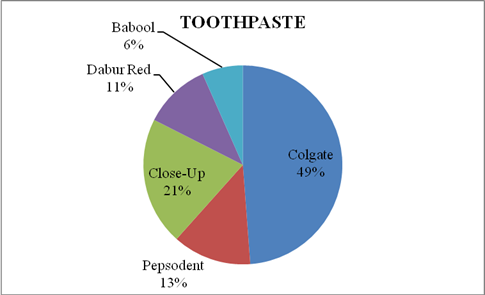
Figure: 5: Most Recalled Talcum Powder Brands
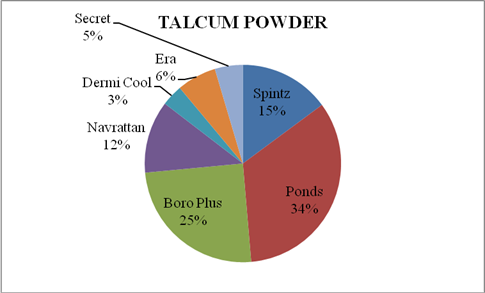
Figure: 6: Most Recalled Hair Oil Brands
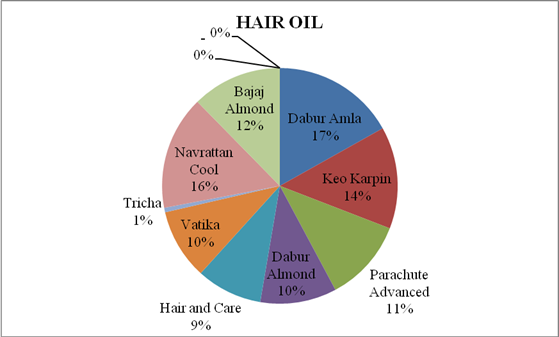
Figure: 7: Most Recalled Biscuit Brands
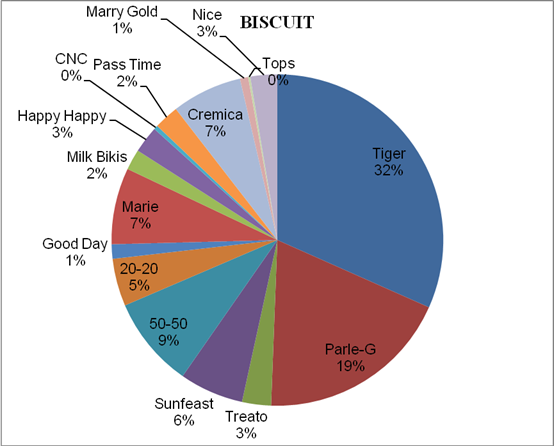
Figure: 8: Most Recalled Instant Noodles Brands
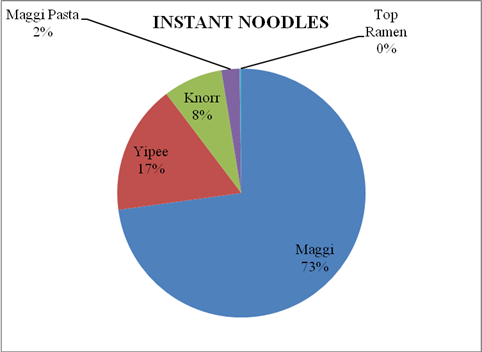
Figure: 9: Most Recalled Candies/Chocolates Brands
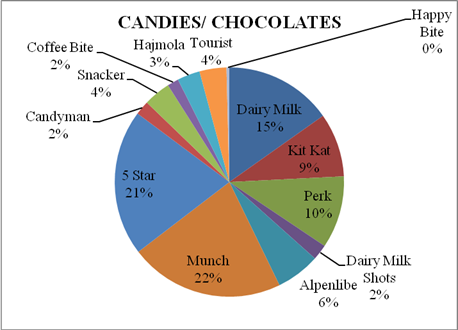
Figure: 10: Most Recalled Chips Brands
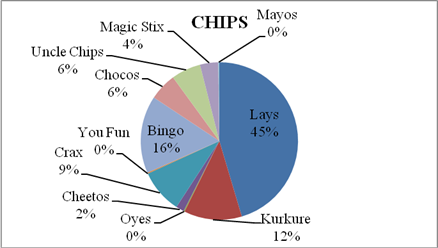
Figure: 11:Most Recalled Tea Leaves Brands
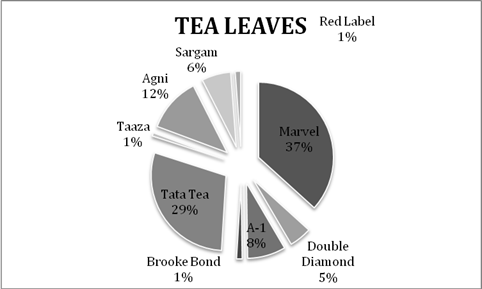
Figure: 12: Most Recalled Coffee Brands
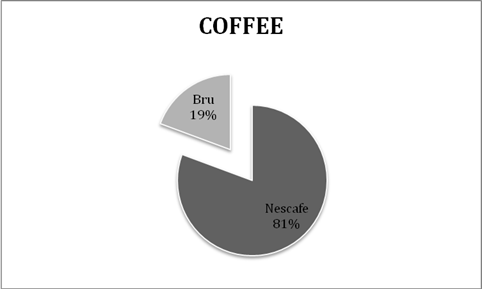
Figure: 13: Most Recalled Jams Brands
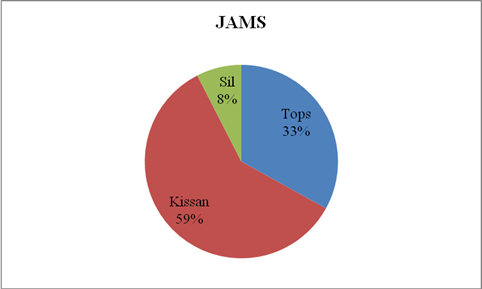
Figure: 14: Most Recalled Sauces Brands
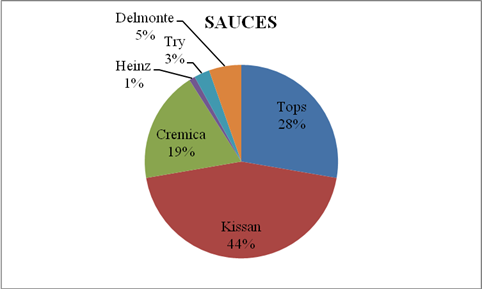
Figure: 15: Most Recalled Detergent Brands
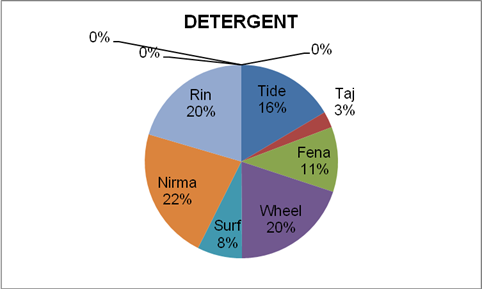
Figure: 16: Most Recalled Dish Wash Brands
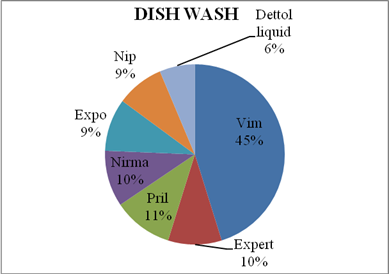
Fig: 17: Most Recalled Ointments/Tablets Brands