Pacific B usiness R eview I nternational

A Refereed Monthly International Journal of Management Indexed With THOMSON REUTERS(ESCI)
|
Dr. Shilpa Lodha Assistant Professor, Department of Accountancy and Statistics, Mohanlal Sukhadia University, Udaipur |
Ekta Kumawat Research Scholar (Ph.D), Department of Accountancy and Statistics, Mohanlal Sukhadia University, Udaipur |
Chirag Bapna Project Fellow, Department of Accountancy and Statistics, Mohanlal Sukhadia University, Udaipur |
Economics is a broad study of the pecuniary conditions of a country and of the effects of various policy decisions of the government and the central bank. Every trivial change creates a domino effect, triggering several pros and cons to be discussed in the subsequent phase. The following event study dwells into the minutiae, interpretation and conclusions of the recent financial exercise of ‘Demonetization’ on stock market. This study deals with one of the most important questions that whether or not Indian stock market overreacted during the stock specific news. The impact of it on sectoral indices and sectoral growth is moreover an important issue of concern. The study deals with it by undertaking sample studies of few of the sectors and impact on them.
With a sample period of 81 trading days, 9th November 2016 as the event day and an event window of 10 prior days from the event day, this study provides a qualified swot of the situations in a comprehensive manner. The methodology consisted of sample selection (i.e. Stock market), defining a sample period, defining an event window, estimation period, expected return hypothesis, AR & CAR and significance testing.
Results concluded that Banks (Public/Private), Financial Services and PSUs yielded positive returns while a stark difference was seen on sectors like Realty along with Auto, IT and media. A detailed analysis of the above drawn conclusions will help us in understanding the effect of this decision in a more actualized and expounding way. The report duly acknowledges the support of individuals and backup from various sources (duly mentioned) in felicitating this study.
Keywords : Demonetization, Indian Stock Market, Sectoral indices and Sectoral growth.
On 8 November 2016, India’s Prime Minister Mr. Narendra Modi announced the Government of India’s decision to cancel the legal tender character of Rs. 500 and Rs. 1,000 banknotes with effect from 9 November 2016. He also announced the issue of new Rs. 500 and Rs. 2,000 banknotes in exchange for the old banknotes which will be placed in circulation from 10th November 2016. Notes of one hundred, fifty, twenty, ten, five, two and one rupee will remain legal tender and will remain unaffected by this decision.
Demonetization is a tool of Government to eliminate the currency. Demonetization is the act of stripping a currency unit of its status as legal tender, it is necessary whenever there is a change of national currency. The old unit of currency must be retired and replaced with a new currency unit.
Thus, Demonetization of currency means discontinuity of the particular currency from circulation and replacing it with a new currency.
The objective behind the demonetization policy are to make India corruption free, to control black money, to control increasing price rise, to stop funds flow to illegal activity, to make people accountable for every rupee they possess and pay income tax return, to make a cashless society and create a Digital India.
According to Harish Damodaran (2016) as per the RBI the total bank notes in circulation valued to Rs.16.42 trillion (US$240 billion) of which nearly 86% (around Rs.14.18 trillion (US$210 billion)) were Rs.500 and Rs.1,000 banknotes. In terms of volume, the report stated that 24% (around 22.03 billion) of the total 90266 million banknotes were in circulation. According to a Bloomberg report, banks were estimated to have received 14.97 trillion rupees (around $220 billion) by the December 30 deadline, or 97% of the 15.4 trillion rupees’ worth of currency demonetized.
The act of demonetization has happened twice in India, first in the year of 1946 and then in the year of 1978. In January 1946, Rs. 1,000 and Rs. 10,000 banknotes were withdrawn but the same Rs. 1,000, Rs. 5,000 and Rs. 10,000 notes were reintroduced in 1954, and were again demonetized in January 1978. The second demonetization has taken place in the year of 1978 by the Janata Party government. It had decided to withdraw Rs. 1,000, Rs. 5,000 and Rs. 10,000 notes by issuing an ordinance on the morning of 16 January that year.
Demonetization in other Countries
Demonetization has also been done in few other countries like United States of America (1969), Ghana (1982),Nigeria (1984),Myanmar (1987), Soviet Union (1991),North Korea (2010),Pakistan (2016), Zimbabwe (2015), Australia (1996), Fiji, Singapore, Russia, Greece and the Philippines. The Purpose of Demonetization by different countries was to reducing black money, reduce corruption, to tackle tax evasion and empty excess liquidity and increase economic growth in long run, increase transparency.
Impact of Demonetization
After the announcement of demonetization there was liquidity crisis in the market and the people were struggling to have some liquidity in the form of new currency notes. Banks were struggling to deal with long queues of people trying to exchange their old high-value currency notes with newly circulated currency notes. ATMs remained closed.
This move has shown its impact on the Indian Stock Markets. Consequent to this decision, on 9th November 2016, the Sensex plunged by 1,688 points (6.12%) and the Nifty Fifty dropped 541.30 points (6.33%). The rupee was trading to 66.85 per US$ down by 23 paise.
Due to demonetization announcement and sudden drop in stock market alot of investors are withdrawing capitals from stocks, some because they are out of fundsand others because they expect a crash, perhaps an opportunity to buy at lower levels.
Event Study
The event study methodology firstly applied by Fama, Fisher, Jensen, and Roll (1969), who employ it to test the market’s efficiency in responding to stock split announcement. Event Study is related to the study of speed of incorporating new announcement or information into stock prices. This is related with testing of semi-strong form of efficiency of stock market. It studies the behavior of stock prices near an event which may have some impact on them.
 Figure 1: Hypothesized Event Causality
Source: Sorenson (2012)
An event may be merger & acquisition, earnings announcement, appointment of a new CEO, stock splits, bonus issue, dividend announcement, IPO’s, political events, sports events, weather, more recently - demonetization etc. These events may cause a change in investor’s mood which in turn causes changes in stock prices as is evident from Figure 1.
Statement of the Problem
The question of whether or not Indian stock market is overreacted during any stock-specific news is best answered by a comprehensive and concurrent analysis of the various tests and data available while using the event study, like stock and market-specific data. Demonetization of Indian currency may contain important information for the investors. This paper empirically investigates the information content of demonetization announcement by Indian government on Nifty and some of the sectoral indices.
Jain (2017) examined the impact of demonetization on the returns of 25 Public sector bank and 15 private banks listed on NSE using event study analysis and regressions. The data spans from July 27, 2016 to November 22, 2016. It found that the public sector banks have recorded higher returns after demonetization; the private ones witnessed a decline in returns.
Jain, Shekhar & Deshpande (2017) examined the behavior of stock prices of hospitality sectors, as the announcement of Demonetization as event study methodology. The study showed that in short and medium terms the demonetization will have various effects on the many sections of the hospitality industry in the country, but in the long term will positively impact the growth of the hospitality sector.
Mahajan & Singla (2017) studied the effect of demonetization on various participants of financial inclusion drive such as ordinary individuals, informal sector, rural population, MSMEs, NBFC MFIs and E-wallet companies. The study revealed that ordinary individuals were the most adversely affected. The new type of deposits called benami deposits have also come up with demonetization. With the aim of achieving financial inclusion along with making India a cashless and digital economy, efforts are required to make technology reach the bottom of the pyramid.
Masood & Ali (2017) analyzed the volatility pre and post demonetization in Indian stock market. The study conducted by using daily closing prices time series on BSE S&P Sensex and NSE Nifty for a period of prior and post three months. It was from the analysis that mean value of Pre Sensex and Pre Nifty was negative, Post Sensex and Post Nifty was positive respectively. The volatility (SD) of all three indices Sensex, Bank index and Nifty increased in post demonetization and the banking sector highly influenced than other sectors in the stock market.
Bharadwaj, Mohith, Pavithra & Ananth (2017) analyzed the impact of demonetization on Indian stock market using efficient market hypothesis. This study focused on the calculation of risk and return values for16 different companies from NSE-India before and after the demonetization process and the analysis is being done through single Sharpe model. The data collected for the past five years from 2012 to 2016 and for 5 months from November 2016 to March 2017. According to the analysis from the year 2012 to 2016, the 4 sectors namely energy, media, realty and private banking was in a good process and follows random walk process thus investor can make their move in investing in these companies for better return and low risk. But after demonetization there is an Impact on Indian Stock Market due to the effect of Demonetization therefore, Investor has to update the investment information then and there from the Market for their better investment in with low risk and high return.
Sathyanarayana and Garghesha (2017) examined the stock market reaction towards the announcement of demonetization in India in short term. For the purpose of analysis of the data, Mean, Standard Deviation and Paired t test have employed in the study. For the purpose of the study two Indian stock exchanges, NSE and BSE have been selected and total 20 days SENSEX were used i.e. 10 days pre and 10 days post announcement of demonetization. It revealed that in both NSE and BSE stock indices are negatively reacted towards the announcement of demonetization in short term and post demonetization situation was quite different in the stock market.
Sharma, Geetika & Kovid (2017) investigated the impact of demonetization on the performance of NIFTY Index and the sample of 9 National Stock Exchange (NSE) sectoral indices. The comparison of closing price and trading volume of the indices in pre-demonetization and post-demonetization period was conducted using independent sample t-test. The results of the study indicated that there was negative impact of demonetization on various sectors of Indian stock market.
Singh & Singh (2017) analyzed the immediate impact of demonetization on Indian economy and what are the probable consequences of the demonetization. It was concluded that in the Short-term there would be a disruption in the current liquidity situation but in the long-term would have a meaningful impact. Demonetization would higher the tax collection and a better tax to GDP ratio, lower inflation appealing the central bank to reduce interest rates, it increase the tax net and along with GST result in reduction of black money generation.
Singh & Thimmaiah (2017) revealed that the impact of demonetization will have the positive in the long run but the majority of industry currently suffering with huge amount of losses due to that they are not able to support the economy much. It showed that its impact will be felt in modernization of Indian payment system, reduction in the cost of banking services as well as reduction in high security and safety risks also included curbing banking related corruptions and fostering transparency.
T & Shenoy (2017) analyzed the demonetization effect on performance and volatility of the twelve sectoral indices of NSE in India. It showed that all sectoral indices performed significantly different in pre and post demonetization periods except the PSU bank index and in case of volatility of the sectoral indices results showed no significant difference in pre and post demonetization periods.
Tiwari & Anjum (2017) compared the opinion of banker, management students and management faculties on demonetization and analyzed the impact of demonetization used descriptive research design through self designed questionnaire from Pune. The data was analyzed using mean score, t test, and ANOVA. It found that respondents were moderately satisfied with positive effect of demonetization on reducing fake currency, increase tax compliance. Respondent considered no significant impact of demonetization on terrorism and respondents were neutral regarding execution of demonetization and planning.
Adnan & Hossain (2016) analyzed the differences in stock price reaction due to merger announcement both target and acquiring companies by using event study methodology. It was found that prior to the announcement of merger both the target and acquiring companies CAAR value show an upward trend but post-announcement period day 1 to day 3 that sudden fall down of CAAR for the acquiring company’s. It is observed that target companies CAAR value over the period of post-merger announcement until day 4 is higher than the merger companies CAAR value.
Lodha & Soral (2016) examined the information content of quarterly earnings announcement and to examine the speed of information of this information into stock prices. The sample consisted of listed companies of NSE during 2012 to 2015. They found, using event study, that Indian stock market is semi-strong efficient and investors quickly absorb the information regarding earning announcement. This helped investors to accommodate this information quickly into stock prices.
Wang, Miao & Wang (2014) studied the announcement effects of the convertible bonds of 50 listed companies in the A-share market of China. The result showed that issuing announcement of the convertible bonds can lead stock prices to decline and the announcement effect of the ordinary convertible bonds is more significant than the convertible bonds with warrants.
Mahmood, Sheikh & Ghaffari (2011) explored the effect of cash paid as dividend on share prices. Value relevance of cash dividend announcement is tested on a sample of around100 corporate dividend announcements in Karachi Stock Exchange (KSE), during the period of 2005 to 2009. The result showed that dividend announcements are positively value relevant.
Akbar & Baig (2010) analyzed the reaction of stock prices to cash, stock, and simultaneous cash and stock dividend announcements of 79 companies listed on the Karachi Stock Exchange from July 2004 to June 2007. Abnormal returns from the market model are evaluated for statistical significance using the t-test and Wilcoxon Signed Rank Test. The findings suggested insignificant abnormal returns for cash dividend announcements. However, the average abnormal and cumulative average abnormal returns for stock and simultaneous cash and stock dividend announcements are mostly positive and statistically significant.
Research Gaps
After in depth analysis of available literature it was found that both demonetization and event study have been separately studied for stock markets but a combination of both was not found in the literature. In other words, researchers could not find any research which has studied the impact of demonetization on stock markets using event study. Further, present research is one of its kinds where impact of demonetization on sectoral indices has also been studied.
Objectives of the Study
The study has the following objective:
To study the impact of demonetization on Indian stock market and compare the effect on performance of the different sectors.
Hypotheses
According to the objectives of the study, following two hypotheses were formulated:
H01: There is no impact of demonetization on returns of Nifty and selected sectoral indices.
H02: There is no significant difference between impacts of demonetization over different sectors. In other words, demonetization has affected equally various sectoral indices.
Sample Selection: The main aim of the present study is to examine the impact of demonetization announcement on stock market. For the purpose of the study the Indian stock market NIFTY Index and Eleven sectoral indices of NSE i.e. Auto index, Bank index, Financial Services index, FMCG index, IT index, Media index, Metal index, Pharma index, Private Bank index, PSU Bank index, and Reality index have been selected as sample. The study is based on secondary data and the required data have been collected from official website of NSE and other secondary sources like research journals, articles, research papers and websites.
Sample Period:
It is an event study thus daily closing values for Nifty and other eleven sectoral indices have been collected from the official website of NSE (www.nseindia.com). The next day of announcement of demonetization i.e. 9th November, 2016 has been taken as event day. Ten trading days prior and after the event day constituted the event window. For estimation of alpha and beta of sectoral indices, it was decided to take 60 trading prior to the event window as estimation period. Thus the sample period is 81 trading days from 27 th July, 2016 to 24th November, 2016.
Thus daily closing prices for Nifty and eleven sectoral indices were collected for the following periods:
Event Window: from 26 October, 2016 to 24 November, 2016 consisting of 21 days.
Estimation Period: from 27 July 2016 to 25 October, 2016 consisting of 60 days.
Event Study Methodology:
The event study methodology aims at investigating effect of an event on stock prices or index returns which has been taken as dependent variable. The present event study is based on market model which comprises of following five steps:
1. Defining an event window
In the present paper, demonetization announcement has been taken as event and the date of this announcement is called the event date. It is the date on which Honorable Prime Minister Shri Narendra Modi announced the cancellation of the legal tender character of Rs. 500 and Rs. 1,000 banknotes. Since it is not a regular and repetitive event, investors cannot start anticipating the impact of this announcement on a company or an index a few days ago. Event window defines how many days preceding and following the event date to be included in the study.
Therefore, it was proposed to have an event window consisting of:
· Event date (t=0)
· Ten trading days prior to event date (t-1, t-2, ……….t-10)
· Ten trading days after the event date (t+1, t+2, ……..t+10)
Since this was one of the rarest announcements that could be made by any government, only one event window for each of the sectoral index was framed.
2. Defining estimation period
In order to estimate the stock returns, had the event not been occurred, an estimation period has to be specified. The estimation period gives the unbiased estimate of returns of a security if the event had not taken place. It may be prior or post event date. For the present research, an estimation period of 60 trading days prior to the event window was considered to be appropriate. The data for estimation period was separately collected for each of the indices.
Figure 2 gives an overview of event window and estimation period.
Figure 2: Time Line of the Estimation Period and Event Window
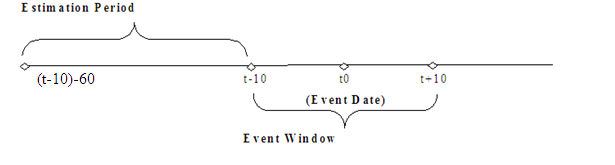
The demonetization announcement was made on November 8th 2016 on evening so November 9th 2016 is selected as the event day (t =0) for this study. The event window is set as 21 days and is considered as t-10 to t+10 to the event day t = 0. The estimation window is from t-70 to t-11 i.e. 60 days prior to the start of event window.
3. Estimating Expected Returns
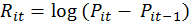
For estimating the effect of demonetization announcement over indices, returns have been calculated as follows:
· Index Returns
 Equation
1
Equation
1
· Market Returns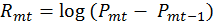 Equation 2
Here, Rit is return from sectoral index i at time t , Pit is the price of sectoral index i at time t , Pit-1 is price of sectoral index i at time t-1 , Rmt is the return from market index (Nifty) m at time t , Pmt is the value of market index (Nifty) m at time t and Pmt-1 is the value of market index (Nifty) m at time t-1 .
These calculated returns for both sectoral index and for market index (Nifty) are realized or actual returns. These returns are to be compared with expected returns or normal returns. The normal returns have been calculated on the basis of estimation period using market model. The market model uses the following OLS regression equation:
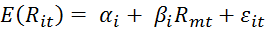 Equation 3
The E (Rit) is the expected or normal return from sectoral index i at time t , αi is intercept coefficient, βiis the slope coefficient (or sensitivity of the sectoral index to market returns), Rmt is return on market index m at time t and εtis residuals.
The αand β coefficients are estimated by regressing sectoral index returns on market index returns for each of the estimation period. These coefficients have been used to estimate expected or normal returns from the sectoral index over the relevant event window on the basis of actual market index returns during the same window.
4. Abnormal Returns and Cumulative Abnormal Returns (AR and CAR)
After calculating expected or normal returns, it has to be confirmed whether actual returns deviate from the expected ones. So, abnormal returns have been calculated by taking the difference of actual returns and expected returns for the security over the event window.
 Equation 4
Where ARt is Abnormal Returns from sectoral index i at time t , Rit is Actual Returns from sectoral index i at time t and E (Rit) is the Expected or normal returns from sectoral index i at time t
For computation of cumulative abnormal returns, the individual day’s abnormal return (AR) is added together from the beginning of the period to some specified period and is tested for significance.Abnormal returns are then cumulated to have Cumulative Abnormal Returns (CAAR) as follows:
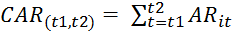 Equation 5
5. Significance Testing
The procedure by Brown & Warner (1985) was followed in the statistical analysis to test the significance of the cumulative average abnormal returns in terms of the null hypothesis that such returns are equal to zero. It follows a t- distribution and is formulated as:
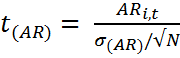 Equation 6
Here, σ(AAR) is the standard deviation of AR and N is the number of earnings announcement on day t .Significance testing of CAR can also be done in a similar way:
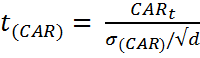 Equation 7
Here, σ(AAR) is the standard deviation of CAR and d stands for number of days for which the AR is cumulated. These calculated t values were tested at 5 % level of significance.
Analysis:
Table 1 shows the Alpha (Intercept or Constant) and Beta (slope) values for all sectoral indices along with their standard error and R-square.
Table 1: Alpha and Beta Values of Sectoral Indices during Estimation Period
|
Index |
Alpha |
Beta |
St. Error |
R-Square |
|
Auto |
0.121709 |
1.425846 |
0.489251 |
0.76024 |
|
Bank |
0.053411 |
1.276252 |
0.341045 |
0.839437 |
|
Financial Service |
0.033055 |
1.263193 |
0.277136 |
0.885795 |
|
FMCG |
-0.05055 |
0.761515 |
0.462579 |
0.502923 |
|
IT |
-0.10177 |
0.255886 |
0.694691 |
0.04821 |
|
Media |
0.091323 |
0.091323 |
0.091323 |
0.091323 |
|
Metal |
0.125147 |
1.397773 |
0.77981 |
0.545344 |
|
Pharma |
-0.01273 |
0.965455 |
0.485537 |
0.596137 |
|
Private Bank |
0.038902 |
1.250399 |
0.383454 |
0.798783 |
|
PSU |
0.162526 |
1.827597 |
0.88054 |
0.616602 |
|
Realty |
0.004438 |
1.471122 |
0.873301 |
0.514423 |
Table 1 shows that except for IT and Media sector, R-square is greater than 50% for all other indices. This shows that the variations in these sectoral indices could be better explained by variations in Nifty. The sign of intercept (alpha) tells the relationship between sectoral index and Nifty. All indices are positively correlated with Nifty except FMCG, IT and Pharma which are negatively correlated with Nifty.
If we look at Beta (slope) coeffients it is revealed that except 4 indices, all other indices have beta values of greater than 1,which shows their higher volatility than Nifty. The Sectoral indices FMCG, IT, Media and Pharma have beta values less than one which implies that these indices are less volatile than Nifty. These alpha and beta values were then used as inputs to market model to calculate expected returns from these indices and thereafter calculate Abnormal Returns.
Table 2: Abnormal Return and T-Statistic for NSE Sectoral Indices
|
Days |
Auto |
Bank |
Fin. Serv. |
FMCG |
IT |
Media |
||||||
|
AR |
t-stat. |
AR |
t-stat. |
AR |
t-stat. |
AR |
t-stat. |
AR |
t-stat. |
AR |
t-stat. |
|
|
T-10 |
0.356 |
0.727 |
-0.511 |
-1.498 |
-0.313 |
-1.129 |
-0.140 |
-0.303 |
-0.615 |
-0.885 |
0.674 |
0.796 |
|
T-9 |
-0.938 |
-1.918 |
-0.169 |
-0.496 |
0.473 |
1.708 |
0.807 |
1.745 |
-0.917 |
-1.320 |
-0.433 |
-0.512 |
|
T-8 |
0.047 |
0.096 |
-0.103 |
-0.303 |
0.079 |
0.284 |
0.108 |
0.233 |
-0.106 |
-0.153 |
-0.333 |
-0.393 |
|
T-7 |
0.065 |
0.134 |
0.005 |
0.015 |
0.038 |
0.137 |
0.080 |
0.172 |
0.197 |
0.283 |
0.863 |
1.020 |
|
T-6 |
0.281 |
0.574 |
-0.313 |
-0.917 |
0.112 |
0.405 |
-0.364 |
-0.787 |
-0.313 |
-0.451 |
-0.550 |
-0.649 |
|
T-5 |
0.724 |
1.480 |
0.157 |
0.461 |
0.246 |
0.889 |
-0.101 |
-0.218 |
-1.089 |
-1.567 |
-0.985 |
-1.164 |
|
T-4 |
0.092 |
0.187 |
0.255 |
0.748 |
0.307 |
1.108 |
0.426 |
0.921 |
-0.349 |
-0.502 |
-0.155 |
-0.183 |
|
T-3 |
-0.199 |
-0.406 |
0.077 |
0.227 |
-0.052 |
-0.187 |
3.051 |
6.596* |
0.362 |
0.521 |
-0.139 |
-0.164 |
|
T-2 |
-0.718 |
-1.468 |
0.227 |
0.664 |
-0.253 |
-0.914 |
0.013 |
0.028 |
1.225 |
1.763 |
-0.031 |
-0.036 |
|
T-1 |
0.656 |
1.340 |
0.419 |
1.228 |
0.180 |
0.650 |
-0.131 |
-0.283 |
0.094 |
0.136 |
-0.172 |
-0.203 |
|
T |
0.663 |
1.356 |
1.248 |
3.660* |
0.987 |
3.562* |
-0.964 |
-2.085* |
-3.225 |
-4.642* |
-0.915 |
-1.081 |
|
T+1 |
-2.742 |
-5.605* |
1.223 |
3.586* |
-0.195 |
-0.704 |
-0.233 |
-0.504 |
0.756 |
1.088 |
0.787 |
0.930 |
|
T+2 |
-1.344 |
-2.748* |
2.166 |
6.352* |
0.861 |
3.108* |
-1.020 |
-2.205* |
-1.536 |
-2.212* |
-0.926 |
-1.094 |
|
T+3 |
-2.157 |
-4.409* |
0.725 |
2.125* |
0.312 |
1.126 |
-0.845 |
-1.826 |
0.005 |
0.007 |
-1.266 |
-1.495 |
|
T+4 |
0.114 |
0.233 |
-0.464 |
-1.362 |
0.055 |
0.198 |
-0.973 |
-2.103* |
1.907 |
2.745* |
0.303 |
0.359 |
|
T+5 |
0.451 |
0.922 |
-0.303 |
-0.889 |
0.191 |
0.690 |
-0.141 |
-0.305 |
-0.267 |
-0.385 |
0.179 |
0.211 |
|
T+6 |
0.327 |
0.669 |
-0.244 |
-0.717 |
-0.274 |
-0.988 |
-0.243 |
-0.524 |
-0.662 |
-0.952 |
-1.748 |
-2.065* |
|
T+7 |
-0.023 |
-0.047 |
-0.609 |
-1.786 |
-0.233 |
-0.841 |
-0.211 |
-0.456 |
0.295 |
0.424 |
-1.608 |
-1.899 |
|
T+8 |
-0.077 |
-0.157 |
-0.707 |
-2.074* |
-0.247 |
-0.891 |
0.459 |
0.992 |
0.451 |
0.649 |
0.130 |
0.154 |
|
T+9 |
0.082 |
0.167 |
-0.476 |
-1.396 |
-0.366 |
-1.321 |
0.133 |
0.288 |
0.299 |
0.431 |
0.439 |
0.519 |
|
T+10 |
-0.496 |
-1.013 |
-0.636 |
-1.866 |
-0.464 |
-1.676 |
0.070 |
0.152 |
1.006 |
1.448 |
-0.264 |
-0.312 |
Table 3: Abnormal Return and T-Statistic for NSE Sectoral Indices (Contd.)
|
Days |
Metal |
Pharma |
Private Bank |
PSU |
Realty |
||||||
|
AR |
t-stat. |
AR |
t-stat. |
AR |
t-stat. |
AR |
t-stat. |
AR |
t-stat. |
||
|
T-10 |
0.367 |
0.470 |
0.372 |
0.765 |
-0.559 |
-1.458 |
0.178 |
0.202 |
1.075 |
1.231 |
|
|
T-9 |
-0.994 |
-1.275 |
0.307 |
0.632 |
-0.088 |
-0.230 |
-1.032 |
-1.172 |
-0.382 |
-0.437 |
|
|
T-8 |
0.711 |
0.912 |
0.298 |
0.613 |
-0.141 |
-0.367 |
-0.372 |
-0.423 |
0.182 |
0.208 |
|
|
T-7 |
0.611 |
0.783 |
0.303 |
0.623 |
0.026 |
0.069 |
-0.064 |
-0.072 |
0.541 |
0.619 |
|
|
T-6 |
1.974 |
2.532 * |
-0.187 |
-0.386 |
-0.395 |
-1.029 |
-0.023 |
-0.026 |
-0.344 |
-0.394 |
|
|
T-5 |
2.079 |
2.665 * |
-0.694 |
-1.429 |
0.217 |
0.565 |
-0.429 |
-0.487 |
-0.407 |
-0.466 |
|
|
T-4 |
0.661 |
0.848 |
-1.215 |
-2.502 * |
0.470 |
1.226 |
-1.406 |
-1.597 |
-0.805 |
-0.922 |
|
|
T-3 |
-1.360 |
-1.745 |
-3.665 |
-7.549 * |
0.251 |
0.655 |
-1.147 |
-1.303 |
-1.418 |
-1.623 |
|
|
T-2 |
-0.363 |
-0.466 |
0.540 |
1.111 |
0.137 |
0.357 |
0.863 |
0.980 |
-0.807 |
-0.924 |
|
|
T-1 |
0.304 |
0.390 |
-1.139 |
-2.347* |
0.441 |
1.150 |
0.101 |
0.114 |
-0.370 |
-0.423 |
|
|
T |
-0.129 |
-0.166 |
0.026 |
0.053 |
0.824 |
2.149* |
3.691 |
4.192 * |
-8.669 |
-9.927 * |
|
|
T+1 |
2.441 |
3.130* |
2.418 |
4.980 * |
0.870 |
2.268* |
3.509 |
3.985 * |
-2.106 |
-2.411 * |
|
|
T+2 |
2.925 |
3.750* |
1.477 |
3.043 * |
1.622 |
4.230* |
5.164 |
5.864 * |
-2.013 |
-2.305 * |
|
|
T+3 |
-0.500 |
-0.642 |
0.745 |
1.533 |
0.002 |
0.006 |
3.877 |
4.403 * |
-0.796 |
-0.912 |
|
|
T+4 |
-1.536 |
-1.970 * |
-0.702 |
-1.446 |
-0.948 |
-2.472* |
1.927 |
2.188 * |
-1.153 |
-1.320 |
|
|
T+5 |
0.350 |
0.448 |
-0.650 |
-1.339 |
-0.278 |
-0.724 |
0.236 |
0.268 |
0.013 |
0.015 |
|
|
T+6 |
-0.585 |
-0.750 |
1.036 |
2.134* |
-0.170 |
-0.442 |
0.093 |
0.106 |
1.821 |
2.085 * |
|
|
T+7 |
-0.920 |
-1.179 |
1.200 |
2.471* |
-0.373 |
-0.974 |
-1.885 |
-2.140 * |
-0.578 |
-0.662 |
|
|
T+8 |
0.204 |
0.261 |
0.250 |
0.515 |
-0.232 |
-0.604 |
-3.137 |
-3.562 * |
-0.954 |
-1.092 |
|
|
T+9 |
1.828 |
2.344* |
0.854 |
1.759 |
-0.362 |
-0.944 |
-0.928 |
-1.053 |
2.473 |
2.831 * |
|
|
T+10 |
1.830 |
2.346* |
0.332 |
0.684 |
-0.852 |
-2.223* |
0.825 |
0.937 |
0.931 |
1.066 |
|
Table 2 shows the Abnormal returns and their t-statistics. The significance of t-statistic has been highlighted in Bold i.e. wherever the t-statistics is Bold, it shows that the t-statistic is significant at 5% level of significance. Table 2 reveals that FMCG, Metal and Pharma sectors had significant abnormal returns before the event day, but it is not because of demonetization as this announcement was of a kind which nobody could anticipate. On the event day i.e. on 9th November, 2016, Bank, Financial Services, Private Bank and PSU produced significantly different positive abnormal returns whereas FMCG, IT and Realty sectors experienced significantly different negative abnormal returns. Abnormal returns of auto, Media, Metal and Pharma sector were not significant. Among these, highest positive abnormal returns were of PSU and Bank sectors whereas highest negative abnormal returns were of Realty and IT sector.
As far as post event window i.e. ten days after the event is considered, the highest positively affected indices were PSU, Bank and Private bank sector which produced continuous significantly different abnormal returns for five, four and three trading days respectively. Returns for PSU turned to be significantly negative from seventh day onwards. Bank and Private Bank sectors also started producing negative returns from fourth day of the event.
In the post event window, Pharma and Metal sectors had significant positive abnormal returns for two days post event and Auto sector had significant negative abnormal returns for three days post event.
Table 4: Cumulative Abnormal Returns of Sectoral Indices
|
Time |
Auto |
Bank |
Fin Ser |
FMCG |
IT |
Media |
Metal |
Pharma |
Pvt Bank |
PSU |
Realty |
|
t-10 |
0.36 |
-0.51 |
-0.31 |
-0.14 |
-0.61 |
0.67 |
0.37 |
0.37 |
-0.56 |
0.18 |
1.08 |
|
t-9 |
-0.58 |
-0.68 |
0.16 |
0.67 |
-1.53 |
0.24 |
-0.63 |
0.68 |
-0.65 |
-0.85 |
0.69 |
|
t-8 |
-0.54 |
-0.78 |
0.24 |
0.77 |
-1.64 |
-0.09 |
0.08 |
0.98 |
-0.79 |
-1.23 |
0.88 |
|
t-7 |
-0.47 |
-0.78 |
0.28 |
0.85 |
-1.44 |
0.77 |
0.69 |
1.28 |
-0.76 |
-1.29 |
1.42 |
|
t-6 |
-0.19 |
-1.09 |
0.39 |
0.49 |
-1.75 |
0.22 |
2.67 |
1.09 |
-1.16 |
-1.31 |
1.07 |
|
t-5 |
0.53 |
-0.93 |
0.64 |
0.39 |
-2.84 |
-0.76 |
4.75 |
0.40 |
-0.94 |
-1.74 |
0.67 |
|
t-4 |
0.63 |
-0.68 |
0.94 |
0.82 |
-3.19 |
-0.92 |
5.41 |
-0.82 |
-0.47 |
-3.15 |
-0.14 |
|
t-3 |
0.43 |
-0.60 |
0.89 |
3.87 |
-2.83 |
-1.06 |
4.05 |
-4.48 |
-0.22 |
-4.30 |
-1.56 |
|
t-2 |
-0.29 |
-0.38 |
0.64 |
3.88 |
-1.61 |
-1.09 |
3.68 |
-3.94 |
-0.08 |
-3.43 |
-2.36 |
|
t-10 |
0.36 |
0.04 |
0.82 |
3.75 |
-1.51 |
-1.26 |
3.99 |
-5.08 |
0.36 |
-3.33 |
-2.73 |
|
t |
1.03 |
1.29 |
1.81 |
2.78 |
-4.74 |
-2.17 |
3.86 |
-5.06 |
1.18 |
0.36 |
-11.40 |
|
t+1 |
-1.71 |
2.52 |
1.61 |
2.55 |
-3.98 |
-1.39 |
6.30 |
-2.64 |
2.05 |
3.87 |
-13.51 |
|
t+2 |
-3.06 |
4.68 |
2.47 |
1.53 |
-5.52 |
-2.31 |
9.22 |
-1.16 |
3.68 |
9.03 |
-15.52 |
|
t+3 |
-5.22 |
5.41 |
2.78 |
0.69 |
-5.51 |
-3.58 |
8.72 |
-0.42 |
3.68 |
12.91 |
-16.32 |
|
t+4 |
-5.10 |
4.94 |
2.84 |
-0.29 |
-3.60 |
-3.28 |
7.19 |
-1.12 |
2.73 |
14.84 |
-17.47 |
|
t+5 |
-4.65 |
4.64 |
3.03 |
-0.43 |
-3.87 |
-3.10 |
7.54 |
-1.77 |
2.45 |
15.07 |
-17.46 |
|
t+6 |
-4.32 |
4.39 |
2.76 |
-0.67 |
-4.53 |
-4.84 |
6.95 |
-0.73 |
2.28 |
15.17 |
-15.64 |
|
t+7 |
-4.35 |
3.79 |
2.52 |
-0.88 |
-4.24 |
-6.45 |
6.03 |
0.47 |
1.91 |
13.28 |
-16.22 |
|
t+8 |
-4.42 |
3.08 |
2.28 |
-0.42 |
-3.79 |
-6.32 |
6.24 |
0.72 |
1.68 |
10.14 |
-17.17 |
|
t+9 |
-4.34 |
2.60 |
1.91 |
-0.29 |
-3.49 |
-5.88 |
8.06 |
1.57 |
1.32 |
9.22 |
-14.70 |
|
t+10 |
-4.84 |
1.97 |
1.44 |
-0.22 |
-2.48 |
-6.15 |
9.89 |
1.90 |
0.46 |
10.04 |
-13.77 |
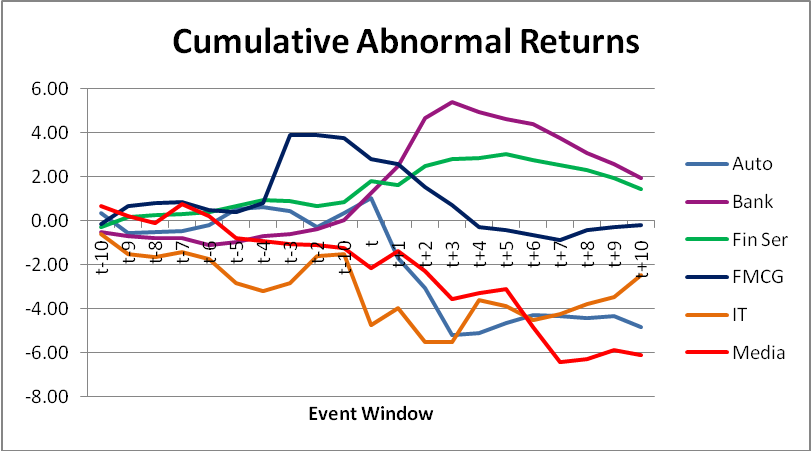 Figure 3: Cumulative Abnormal Returns of Sectoral Indices (1)
Table 4, Figure 3 and Figure 4 displays the cumulative abnormal returns of the sectoral indices during the event window. The performances of different sectoral indices are very different from each other. As was earlier noticed in case of abnormal returns, the performance of Bank, Financial Service, Private Bank and PSU was better in post event period than in pre event period. All these sectoral indices produced positive cumulative abnormal returns (CAR). Realty sector produced highest negative cumulative abnormal returns (CAR), proving it to be the most adversely affected index of NSE due to demonetization. Other sectoral indices which produced negative CAR in post event period were Auto, IT and Media. CARs of FMCG turned to be negative eventually after a slight rise after the event day. Metal index was a surprise to show substantial increase in CAR in post event period despite struggling between 0 to 2% CAR in pre event period.
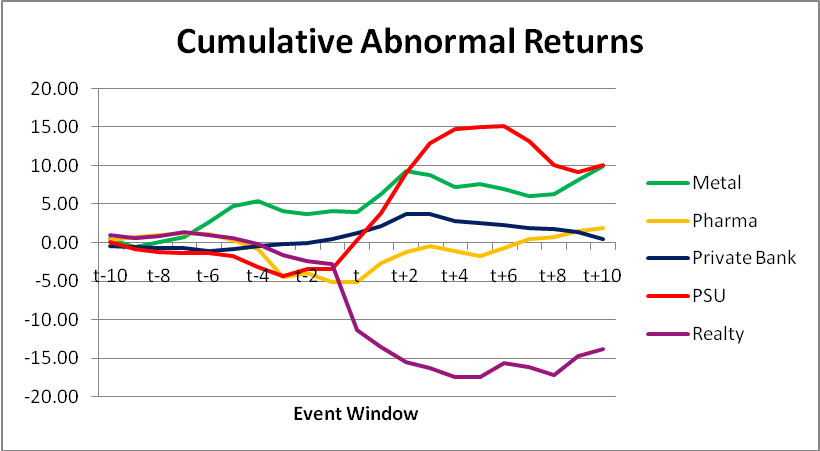 Figure 4: Cumulative Abnormal Returns of Sectoral Indices (2)
This paper attempts to explore the size of impact of demonetization over various sectoral indices of NSE. For this purpose daily closing prices of Nifty and eleven sectoral indices were collected from 27th July 2016 to 24th November 2016 consisting of 81 trading days. These days include 60 days for estimation period and 21 days for event window. The event date was taken as 9th November, 2016. Returns were calculated for Nifty and sectoral indices by log-differencing to avoid non-stationarity of the data. Alpha (intercept) and beta (slope) coefficients were calculated by regressing returns of sectoral indices over returns of Nifty for the estimation period. These alpha and beta values were then used to measure expected returns from sectoral indices during event window using Market Model. Abnormal returns (AR) were calculated by differencing actual returns and expected returns and these abnormal returns were cumulated to find out Cumulative Abnormal Returns (CAR). Later t-test was used to test their significance.
Empirical analysis shows that demonetization has affected different indices in a different way. Bank, Financial services, PSU and Private Bank yielded highest positive AR and CAR. The result was as expected as the compulsory exchange or deposition of cancelled currency brought their cash position better thereby increasing their liquidity. Realty sector was having highest negative AR and CAR. This was again for the reason that market was having crunch of liquidity and people were more worried about basic needs and other necessity rather than thinking of investment in real estate. Auto, IT and Media sector also produced negative ARs and CARs.
Adnan, A., & Hossain, A. (2016). Impact of M&A Announcement on Acquiring and Target Firm’s Stock Price: An Event Analysis Approach. International Journal of Finance and Accounting , 5(5): 228-232.
Akbar, M., & Baig, H. H. (2010). Reaction of Stock Prices to Dividend Announcements and Market Efficiency in Pakistan. The Lahore Journal of Economics , 15 : 1 103-125.
Chakravorti, B. (2017, march 14). Early Lessons from India’s Demonetization Experiment. Harvard Business Review .
Fama, E.F., Fisher, L., Jensen, M.C. and Roll. R. (1969). The Adjustment of Stock Price to New Information. International Economic Review , 10(1) 1-21.
Jain, R. (2017). Is Demonetisation a Windfall for the banking sector? Evidence from the Indian stock market. Economics Bulletin , Volume 37, Issue 2, 712-722.
Jain, S. K., Shekhar, C., & Deshpande, S. (2017). Market Reaction to Demonetization : An Empirical Study Using Event Study Technique. International Educational Scientific Research Journal , Volume : 3 Issue : 5 E-Issn No : 2455-295X.
Rajini, K. & Shanthini, B. (2017). Impact of Demonetization – A Concetual Framework. IOSR Journal Of Humanities And Social Science (IOSR-JHSS) , e-ISSN: 2279-0837, p-ISSN: 2279-0845 11-14.
Lodha, S. & Soral, G. (2016). Investors’ Behaviour towards Earnings Announcements: An Event Study in Indian Stock Market. Indian Journal of Accounting, (Online Issue), 1 (1), 47-61.
Mahajan, P., & Singla, A. (2017). Effect of Demonetization on Financial Inclusion in India. 6th International Conference on Recent Trends in Engineering, Science & Management , (pp. ISBN: 978-93-86171-21-4). Punjab.
Mahmood, S., Sheikh, M. F., & Ghaffari, A. Q. (2011). Dividend Announcements and Stock Returns:An event study on Karachi stock exchange. Interdicsiplinary Journal of Contemporary research in Business , Volume 3 Issue 8.
Masood, S., & Ali, M. M. (2017). Volatility in Indian Stock Market - Pre and Post Demonetization. Airo International Research Journal , Volume IX, ISSN: 2320-3714.
Chellasamy, P. & Anu.K.M. (2017). Impact of Demonetisation on Indian Stock Market: With Special Reference to Sectoral Indices in National Stock Exchange of India. IOSR Journal of Economics and Finance (IOSR-JEF) , Volume 8, Issue 3 Ver. I PP 51-54.
Padmavathy, S., Umashankar, M., & Indhu, V. (2017). Share Price Behavior Around demonetization. International Journal of Management Research & Review , Volume 7 Issue 6 665-673.
Prakash, A. S. (2013). Event Study Test of Incorporating Earning Announcement on Share Price. IOSR Journal of Economic & Finance (IOSR-JEF) , Volume 2 Issue 1 09-18.
Bharadwaj, R., Mohith, S., Pavithra, S. & Ananth, A. (2017). Impact of Demonetization on Indian Stok Market. International Journal of Management (IJM) , Volume 8, Issue 3 75–82.
Devarajappa, S. (2017). Market Reaction Towards the Announcement of Demonetization in India: A Case Study of BSE & NSE. EPRA International Journal of Economic and Business Review , Vol - 5, Issue- 6 88-92.
Sathyanarayana, S., & Gargesha, P. S. (2017). The Impact of Policy Announcement on Stock Market Volatility: Evidence from Currency Demonetisation in India. IOSR Journal of Business and Management (IOSR-JBM) , ISSN: 2319-7668. Volume 19, Issue 1. Ver. VII (Jan. 2017), 47-63.
Sharma, P., Geetika, & Kovid, R. K. (2017). Demonetization and Stock Market Performance: Evidences from India. International Journal of Research in Finance and Marketing (IJRFM) , Vol. 7 Issue 6, pp. 155~165.
Singh, B., & Thimmaiah, N. B. (2017). Demonetization – Won or Lost. Acme Intellects International Journal of Research in Management, Social Sciences & Technology , Vol- 17 ISSN 2320 – 2939.
Singh, P., & Singh, V. (2017). Impact of Demonetization on Indian Economy. International Journal of Science Technology and Management , Volume 5, Issue 12 625-635.
Singh, V. (2017). An Analysis of the Demonetization Effect on Sectorial Indices in India. International Journal of Engineering Technology, Management and Applied Sciences , Volume 5, Issue 4, ISSN 2349-4476 378-382.
Sunil T, S. V. (Vol. 7 Issue 5, May – 2017). Impact of Demonetization on Stocks of Selected Sectors – An Event Study. International Journal of Research in Finance and Marketing (IJRFM) , 29-38.
Tiwari, R., & Anjum, B. (2017). Review of Demonetization in India. SaiBalaji International Journal of Management Sciences , Volume 1, Issue V,ISSN.2349-6568.
Wang, B., Miao, J., & Wang, F. (2014). Research on the Announcement Effects of the Convertible Bonds in the A-Share Market of China. Modern Economy , 5, 333-340.
Yohavarshini, G., Madhumamtha, B., & Priya, C. (2017). A Study on Demonetisation in India and Its Effectuations. International Journal of All Research Education and Scientific Methods (IJARESM) , Volume 5, Issue 1 ISSN: 2455-6211,.
http://www.spellerstep.com/latest/biggest-demonetization-failures-world. Retrieved on 08/05/2017
https://www.quora.com/Has-any-country-other-than-India-ever-had-Demonetization-of-their-currency-notes-1. Retrieved on 08/05/2017
http://www.indiatimes.com/news/world/here-s-a-list-of-countries-that-have-tried-demonetisation-before-india-265743.html. Retrieved on 08/05/2017