Pacific B usiness R eview I nternational

A Refereed Monthly International Journal of Management Indexed With THOMSON REUTERS(ESCI)
|
Ashwani Mahajan Department of Economics PGDAV College University of Delhi |
Phool Chand Department of Commerce PGDAV College University of Delhi |
Harsha Vardhan Research Assistant ICCSR funded project India-China Trade Deficit: Causes, Effects and Solutions |
There is general narrative that Free Trade is beneficial for one and all. We find that since 2001 when the tariff liberalization started, trade deficit has been increasing for most of the countries including India. In India, the said benefits of Free Trade are not accruing even as number of industries continue to shut down. As a result of lowering down of tariffs, imports have been increasing. It has been perceived that protective tariffs cannot be imposed because of our commitments in World Trade Organisation (WTO). However, we find that other countries have made use of flexibilities in WTO and have not only made use of non tariff barriers but also of the protective tariffs to safeguard their respective economies. The present paper seeks to make an enquiry into the possibility of imposing protective tariffs for guarding the interests of our economy in general and industry in particular. Given the structure of our trade with different categories of commodities, we have analysed the effect of protective tariffs on the imports. Our results show that the increased tariff in the budget proposals (Union Budget 2018-19) have reduced the imports to the tune of $4.97 billion, in seven months, which is 7.5% decline, compared to the same period for previous year. Also, imports from China have decreased by $2.97 billion which is a 20% decrease compared to the previous year.
Keywords: Tariff, WTO, Trade Deficit, Protectionism
Soon after Trump was elected he proposed a slew of protectionist measures on the imports worth $250 billion. He was called a protectionist and said to be against the principles of Free Trade. However, the US has not been taken to WTO dispute settlement system (DSS) for raising these tariffs. WTO is appropriate authority to decide what is protectionist and what is not. Therefore the question that needs to be asked is ‘Did Trump raise tariff in compliance with existing rules of WTO? What are the rules that govern tariff structure and to what extent can a country raise its tariff is fundamental question that we seek to answer.
WTO is a body formed to regulate the international trade and govern the rules pertaining to the tariffs and other Trade Remedies. While forming the WTO, founding members understood that there existed trade differential among countries and that countries have different factor endowments, different levels of development, different sized economies, and different political sensitivities. In concordance with that, the developing nations and underdeveloped countries were permitted to reduce the tariffs at a much slower rate but always keeping a ‘bound rate’ as a threshold mechanism. The ‘bound’ tariff rates set by the WTO are highest rate that any country can impose on respective commodities. When need arises these bound rates can also be renegotiated. Therefore WTO is appropriate authority to decide if the country has been following the correct Trade Policy.
As we know, there are two schools of thought, one which argues on the tenets of ‘Free Trade’ while the other focuses on ‘Protectionism’. The proponents of Free Trade argue no restrictions on imports and exports should be imposed between countries. The protectionists believe in restricting imports with use of tariffs and other trade Remedies. Over the years the popular perception has been that Protectionism is always bad and Free Trade is always good. But popular uprisings around the World seem to suggest otherwise.
What Economic Policy does India follow?
India has followed a protectionism policy till 1994 before becoming a signatory of WTO. India has been following a trade liberalization policy post WTO where average applied tariffs rates have been reduced from 40% to 13.5%. While proponents of Free Trade keep pressing for tariff reduction, they ignore certain unique problems which Trade liberalization has brought forth specially in case of India. Firstly, during the said protectionist period from 1950s to 1994, share of manufacturing in GDP has increased from 8% to 18% while after joining the WTO the share of manufacturing in GDP has been stagnating at 15%. Secondly, the massive tariff reduction couldn’t address the concerns of Current Account Deficit (CAD) in Balance of Payment (BOP). India has eternally been in Current Account Deficit. Thirdly, India has been in a perpetual trade deficit which means it imports more than it exports. Most importantly, the trade deficit has led to foreign exchange problem whereby rupee has been continuing to depreciate. The above problems warrant for change in the economic policy of India. While the Socialist policies have not allowed private domestic industry to prosper keeping everything under state control, the Free Trade too was not beneficial as it was premature for private domestic industry to take on highly efficient global manufacturing giants. As a result, India’s manufacturing sector if not deteriorating, was certainly stagnating.
Ha Joon-Chang, a South Korean Economist introduced a phrase called ‘Kicking away the ladder’ which rightly describes the phenomena India has been facing. It is a known fact that Developed nations pressurize the Developing and LDCs countries to open up their market. The concept refers to developed countries using protectionism to develop their domestic industries in their early stages of growth, and when the domestic industry were robust and looking for export markets, they proposed Free Trade. Using a historical approach he finds that developed countries ‘Kick away the ladder’ which they have used to climb up. He has established that while they used protectionism to climb up ladder and reach a position of Economic Power, they started preventing developing and LDC countries from using the same protectionism to protect their own Industry. And India unfortunately did oblige to pressures from the developed nations and opened its markets even before its nascent domestic industry could take off.
Events such as Trump’s Trade War with China and Brexit reiterate the need for revisiting arguments for Free Trade. While the word protectionism had become a taboo lately, protectionism on certain value adding sectors can give huge boost to the Economy and sometimes may prove to be a game changer. For example, Anti-dumping duty imposed on Ceramic products from China had in fact promoted the whole Morbi region into an export hub providing employment and revenue to the till then beleaguered region. The present government in 2018 has hiked customs tariffs 4 times starting from Budget 2018 and latest one being the hike in certain telecommunication equipment in the October first week. In increasing the customs tariffs, the government fully abided by the rules of WTO and kept the rates below the Bound rates. Any of the above increases doesn’t warrant ruling from dispute settlement board of WTO. While there is always a debate on what consists and what doesn’t consist of Protectionism. The threshold level for protectionism has already been set by WTO in form of bound rates. With regards to this, India is following an Economic Policy which is compliant with rules of WTO what we call: WTO Compliant Protectionism. (Mahajan, 2018)
The paper has following outline. Section 2 consists of concepts and background of present Tariff Structure. Section 3 consists of the existing literature in Tariff Bindings and Applied Rates. Section 4 focuses on the Data and Methodology aspects of the paper. Section 5 analyses the current levels of tariffs in India and also studies the present government’s policy in dealing with WTO. The paper concludes with Conclusion and Recommendation.
After introducing terms, we go into the background of the Tariff structure and arrangements. Now we turn to the definitions of Bound Rate, Applied Tariff Rate and Bound Overhang.
Bound Rate : The bound tariff is the maximum Most Favoured Nation (MFN) tariff level for a given commodity line. When countries join the WTO or when WTO members negotiate tariff levels with each other during trade rounds, they make agreements about bound tariff rates, rather than actually applied rates. Bound tariffs are not necessarily the rate that a WTO member applies in practice to other WTO members’ products.
Applied Tariff Rate : The actual tariff rate applied by the country is called Applied Tariff rate. Therefore, Applied Tariff rate is less than or equal to Bound Rate, if country comply to WTO rules. In case any country raises the tariff above the bound rate, the member countries can appeal in the WTO dispute settlement board
Binding Overhang : The gap between the bound and applied MFN rates is called the binding overhang. It has been observed, Overhang is greater for LDCs and developing countries than developed countries. It may be primarily due to Free Trade at the helm of Policy Making in LDCs and developing countries. It has also been observed that direct relation between size of tariff binding and overhang. The greater the size of the bound, the greater is the overhang. Economists have observed that higher binding overhang makes a country’s trade policies less predictable. This gap tends to be small on average in industrial countries and often fairly large in developing countries(Beshkar, Bond, & Rho, 2015) .
Background of Bound Rates
When the WTO was formed, it was looking to get as many as signatories including a lot of developing economies. Developing economies in 1990s including India had been using a wide range of Non-tariff Barriers like quotas, restrictions, embargoes etc. So, to convert these Non-Tariff Barriers into ad-valorem tariffs, a process called ‘Tariffication’ was introduced. In exchange higher Bound Rates were granted to developing countries to protect their domestic industry. The developing countries never had the legal and bureaucratic means to pursue trade remedies. According to(Pelc, 2014), higher bound rates is termed as an insurance policy. Rightly so, since India had lost the cover of Trade Remedies when it joined WTO, it needed insurance of higher bound rates as compensation to protect the domestic industries. By not using those higher bound rates, a huge disadvantage was caused to India’s manufacturing sector. Though a set of emerging countries did develop the framework to effectively use trade remedies, India no doubt not only lost the opportunity in terms of higher tariffs but also lost the chance of using Non-Tariff barriers to protect domestic industries. Finally, India was at huge disadvantage post WTO, because it not only lost the Trade remedies but due to reduced tariff rates to abysmal low level which couldn’t spur any industrial growth.
China and WTO
China joined the WTO in the year 2001 after enjoying a Manufacturing boom of nearly two decades. To compare, the Chinese Manufacturing to GDP ratio was 35% in year 2001, while India’s manufacturing to GDP ratio was crawling at around 15%. China has used its manufacturing capabilities to create an export hub and dump its goods into India as well as other countries. Therefore, it doesn’t surprise that China runs a huge overall Trade surplus. Also, it is no coincidence that the India’s trade deficit with China has been increasing since then. China has therefore effectively established Manufacturing base which has been exploiting the industries of other countries. Therefore, China has been one of the major reason in hindering the progress of Indian manufacturing industry. China entered WTO late in 2002 only after its domestic industry were ready to compete with foreign firms. It’s notable that China was one of the countries to initially oppose Tariffication process which delayed its entry into WTO(Pelc, 2014).
Figure 1 India-China : Manufacturing to GDP Ratio
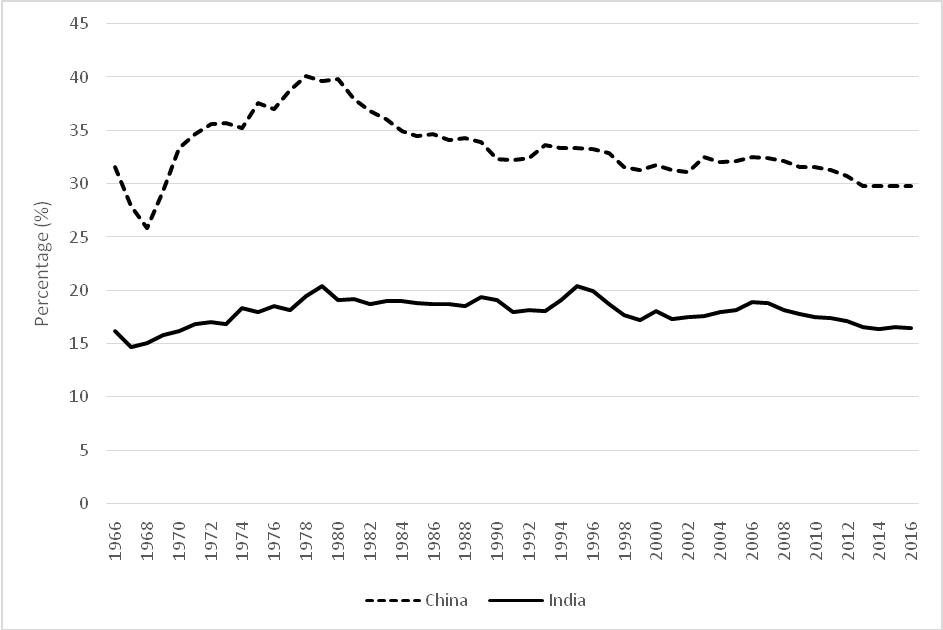
Source: World Development Indicators(WDI)
The policy makers in China were aware of the ramifications which occur by it joining the WTO, it followed a ‘wait and watch policy’ which proved to be very prudent for China as it was ready to take full advantage of its manufacturing capabilities when it joined WTO. Perhaps , India could have followed the same policy. The Policy makers in India were not fully aware of the ramifications of joining WTO and therefore we had to face ill effects of joining the WTO on the one hand and reducing the tariffs on the other.
A host literature forms the view on trade liberalization and how it indeed affected the manufacturing industry. Our claim is that trade liberalization which mainly consists of reduction in tariffs was premature for India and it indeed had an adverse impact on industrial productivity.
India should increase the tariffs to fully utilize the unused protection and experience a manufacturing boom. (Pelc, 2014)have studied government behaviour in using trade remedies vs binding overhang in addressing Trade issue. They address the issue of government facing dilemma on which is a better protectionist measure. They cite the example of India using Anti-Dumping Dutyand safeguard measures on imports of animal feed in 2000-03 instead of increasing the applied tariff by 112 percentage points which would have been fully WTO compliant. The policy makers have been obsessed with Free Trade without fully understanding the ground realities of the Manufacturing Industry in India. (Pelc, 2014)argues thatincreasing tariff would have been a better approach instead of trade remedies which increase the scope of disputes and judicial review. Also, they use the example of Turkey which increased the applied tariff rate from 95% to 225% on imports of chilled or fresh beef. They conclude that when import surges are very high, countries use binding overhang whereas when import surges are small countries use Trade Remedies. This supports our claim that since India has huge Trade deficit, reducing the binding overhang by increasing the tariffs is the best solution to reduce Trade deficit.
We argue that India has a special case to consider as India was at disadvantage following Trade liberalization. Manufacturing stagnation has been a persistent phenomenon in Indian economy. Notion so far has been that, Trade liberalization improves productivity in the country by allocating certain resources (Melitz, 2003). But (Segerstrom & Sugita, 2015)argue that industrial productivity increases more strongly in non-liberalized industries than liberalized industries. Further, they emphasize that productivity is higher in industries with high tariff and low in industries with low tariffs. Indian policy makers heavy reliance on service sector lead boom is a grave mistake. While the service sector does indeed help in the growth of economy , it is the manufacturing industry that has many spill over effects than compared to that of service sector. For a structural change in the Economy, it is the manufacturing which spurs innovation, provides employment and is driver of export. Most countries which are now developed initially experienced a manufacturing boom which propelled their Economy. Many feel that because of lack of India’s manufacturing policy India lags behind China(Jose, 2016).
Trade Liberalization was indeed premature for India as the manufacturing boom could not take place. Liberalizing imports by reducing tariffs and non-tariff barriers has damaged the domestic sector. In the absence of government support the private sector in manufacturing couldn’t play the expected role in growth(Chaudhuri, 2015) . The author is the view that India liberalized tariff more than what was required which adversely affected the manufacturing sector. As can be observed while the Manufacturing contributed to GDP till 1990, it has pretty much stagnated post that with marginal increase and decrease. Ironically , while the countries depend on the manufacturing to give a boost to the Economy whereas in case of India , Manufacturing couldn’t be part of growth story.
The Bound Rates were taken from World Bank Database for the year 2016, while Imports were taken from Ministry of Commerce. The Applied rates were taken from the Notifications released by the Central Board of Indirect taxes and Customs (CBIC). We looked at 8- digit level of HS Code which provides us with most accurate details of Imports as well as Bound Rates. The Budget proposed the rise in custom tariffs of 830 items in HS 8-digit classification in February,2018. So, we consider the monthly imports of these commodities to compare impact of the increased tariff in Budget on Imports.
The Trade Weighted Bound Rate of India is 43.2% and the Trade Weighted applied rate for the India for all commodities is 13.5% which is significantly less that Bound rate. The applied rates so low signify the unused protection which was granted to India by the WTO.
Table 1 : Trade Weighted Applied Rates (TWAR)and Trade Weighted Bound Rates(TWBR)
|
S.No. |
SectionName |
TWAR |
TWBR |
Imports |
Exports |
Overhang |
Deficit |
|
1
|
Live Animals , Animal Products |
33.70 |
78.77 |
199.40 |
6695.37 |
45.07 |
-6495.97 |
|
2 |
Vegetable Products |
50.90 |
91.84 |
8391.92 |
12606.17 |
40.94 |
-4214.25 |
|
3 |
Animal or Vegetable Fats |
86.80 |
237.61 |
11700.45 |
1214.36 |
150.81 |
10486.09 |
|
4 |
Prepared Food Stuffs |
63.48 |
136.90 |
2959.66 |
6055.01 |
73.42 |
-3095.35 |
|
5 |
Mineral Products |
15.89 |
28.12 |
141297.44 |
42316.80 |
12.24 |
98980.64 |
|
6 |
Product of Chemical Or Allied Industries |
10.94 |
39.20 |
41660.64 |
39166.87 |
28.26 |
2493.77 |
|
7 |
Plastics and articles thereof |
11.10 |
38.67 |
17394.71 |
9310.31 |
27.58 |
8084.40 |
|
8 |
Raw Hides and Skins , Leather , Fur skins and Articles thereof |
10.01 |
25.52 |
1062.48 |
3311.44 |
15.51 |
-2248.96 |
|
9 |
Wood and Articles of Wood |
7.21 |
30.78 |
2387.23 |
377.37 |
23.57 |
2009.86 |
|
10 |
Pulp of Wood or other Fibrous foods |
9.42 |
34.84 |
5454.82 |
1701.45 |
25.41 |
3753.37 |
|
11 |
Textile and Textile Products |
23.51 |
46.40 |
7144.48 |
35048.01 |
22.89 |
-27903.53 |
|
12 |
Footwear and Headgear |
18.42 |
NA |
772.48 |
3118.85 |
NA |
-2346.37 |
|
13 |
Articles of Stone |
10.00 |
37.70 |
1434.05 |
2685.33 |
27.70 |
-1251.28 |
|
14 |
Natural or cultured Pearls or Semi-Precious stones |
10.21 |
39.99 |
75955.40 |
42431.03 |
29.77 |
33524.37 |
|
15 |
Base Metal and Articles of Base Metal |
11.73 |
38.75 |
28534.15 |
29088.80 |
27.02 |
-554.65 |
|
16 |
Machinery and Mechanical Appliances ; Electrical Equipment |
11.30 |
15.36 |
86093.38 |
27160.78 |
4.05 |
58932.60 |
|
17 |
Vehicles ; Aircraft ; Vessels and Associated Transport |
5.41 |
20.91 |
18739.77 |
22889.83 |
15.50 |
-4150.06 |
|
18 |
Optical , Photographic , Cinematograph |
9.40 |
30.19 |
9103.68 |
3093.75 |
20.79 |
6009.93 |
|
19 |
Arms and Ammunition |
10.00 |
NA |
35.41 |
99.04 |
NA |
-63.63 |
|
20 |
Miscellaneous manufactured articles |
19.67 |
37.20 |
3032.88 |
2353.82 |
17.52 |
679.06 |
|
21 |
Work of Art Collectors Pieces and Antiques |
10.12 |
NA |
2344.37 |
233.73 |
NA |
2110.64 |
Source: Own Calculation Figures in Million $
The government in the year 2018 has increased the tariffs four times starting with the Budget. Present government's policy with regards to Tariff can be judged by the following documents, which are as follows:
1. nion Budget 2018 in February, 2018
2. Notification No. 58/2018 in August, 2018 – tariff hike on textile commodities
3. Notification No. 67/2018 in September,2018 – tariff on non – essential imports commodities
2. Notification No.53/2018 in July,2018 ready-made garments
5.1.1 Tariff hike in Budget 2018-19
The Finance Minister in his Budget speech made 'Calibrated departure' in the Tariff Policy of the last two decades by raising the import Tariffs on number of items. Henceforth called Budget Commodities. He cited substantial potential for domestic value addition in certain sectors, like food processing, electronics, auto components, footwear and furniture, as a reason for imposing 'Protective Tariff'. The Finance Minister said.“To further incentivise the domestic value addition and Make in India in some such sectors, I propose to increase customs duty on certain items”.
Table 2 : Summary of Budget Commodities
|
Particulars |
Values |
|
No. of Commodities |
835 |
|
Import Value(Million) |
$110842.10 |
|
Weighted Average of Effective Rate |
8.611 |
|
Weighted Average of Bound Rate |
39.225 |
Source: Own Calculation
With respect to Budget commodities the value of imports is $110 Billion annual. And according to the HS Classification at 8-digit level , the Budget Commodities are 835. The Trade Weighted Applied Rate is 8.61 whereas the Bound Rate is 39.225 resulting in a Bound Overhang of 30.615 which is in fact huge.
5.1.1.1 Budget- Change in Imports (Monthly)
We compare the imports of all commodities for which the custom tariffs has been increased in Budget. For relevance we have only compared monthly imports with respect to 2017.
Table 3 : Imports of Budget Commodities -Comparison between 2017 and 2018
|
Months |
Total Imports – 2017 ($ Million) |
Total Imports – 2018 ($ Million) |
|
Feb |
8341.39 |
8531.56 |
|
Mar |
10478.95 |
8839.77 |
|
Apr |
11443.44 |
8259.37 |
|
May |
11335.31 |
9363.21 |
|
Jun |
9188.97 |
8697.12 |
|
Jul |
7548.60 |
8858.78 |
|
Aug |
8230.47 |
9226.32 |
|
Total Sum |
66567.13 |
61776.13 |
Source: Own Calculation
The imports for the respective months compared to year 2017 have decreased by $4.97 billion which is 8.2% of total imports of Budget Commodities for the year 2017. This clearly suggests that Imports indeed have declined.
Figure 2 : Total Imports of Budget Commodities -Comparison between 2017 and 2018
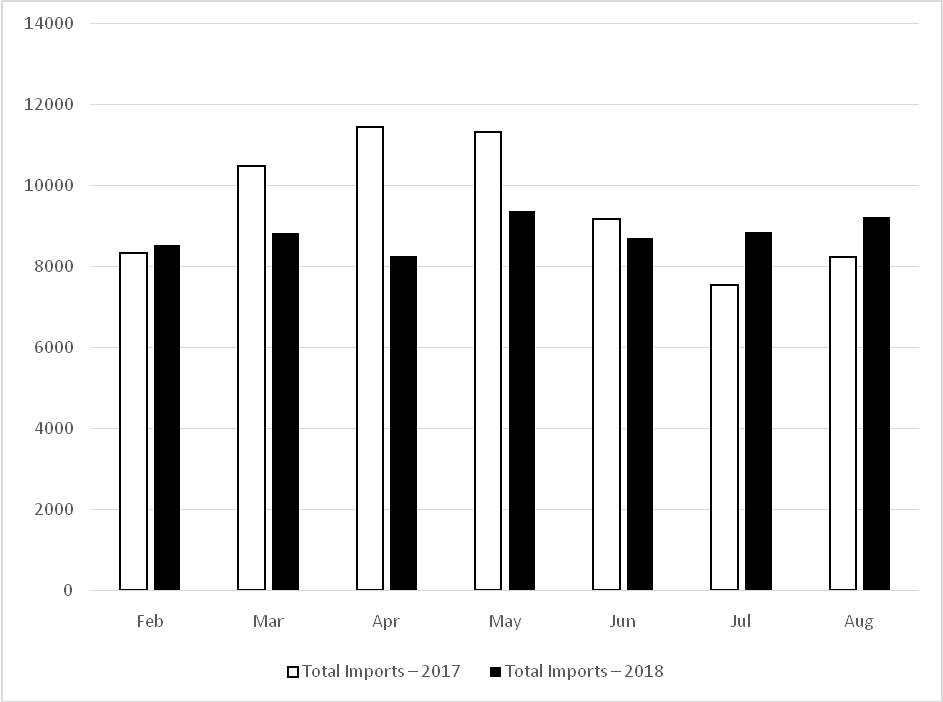
Source: Own Calculation
China has been exploiting the market of India by dumping its goods in India. China entry into WTO and India reducing tariffs proved to be fatal blow to the domestic industry. Further, India did not have trade remedies to aid stopping of dumping. The present Government made a calibrated departure from the past government(s) where in the past, trend was to reduce the tariff. And this has yielded results in terms of decreased imports from all over the world and China in particular. For the same time period between February and August while India imported 12.34 billion dollar’s worth of goods in 2017, it imported much less of $ 9.28 billion for the year 2018. Therefore tariff hikes among Electronics , telecom Equipment , Mobile accessories have decreased the imports from China by approximately 2.35 billion dollars.
Table 4 : Imports of Budget Commodities from China -Comparison between 2017 and 2018 in
|
Month |
Imports from China-2017 ($ Million) |
Imports from China-2018 ($ Million) |
|
Feb |
1267.92 |
1291.61 |
|
Mar |
1565.05 |
1347.27 |
|
Apr |
1497.73 |
1013.04 |
|
May |
1522.39 |
1176.06 |
|
Jun |
1805.62 |
1223.21 |
|
Jul |
1389.47 |
1263.03 |
|
Aug |
1639.46 |
1332.10 |
|
Sep |
1639.46 |
1332.10 |
|
Total Sum |
12327.10 |
9978.42 |
Source: Own Calculation
The imports for the respective months from China compared to year 2017 have decreased by $2.35 billion which is 20% decrease of total imports of Budget Commodities for the year 2017. This clearly suggests that Imports indeed have declined.
Figure 3 : Imports of Budget Commodities from China -Comparison between 2017 and 2018
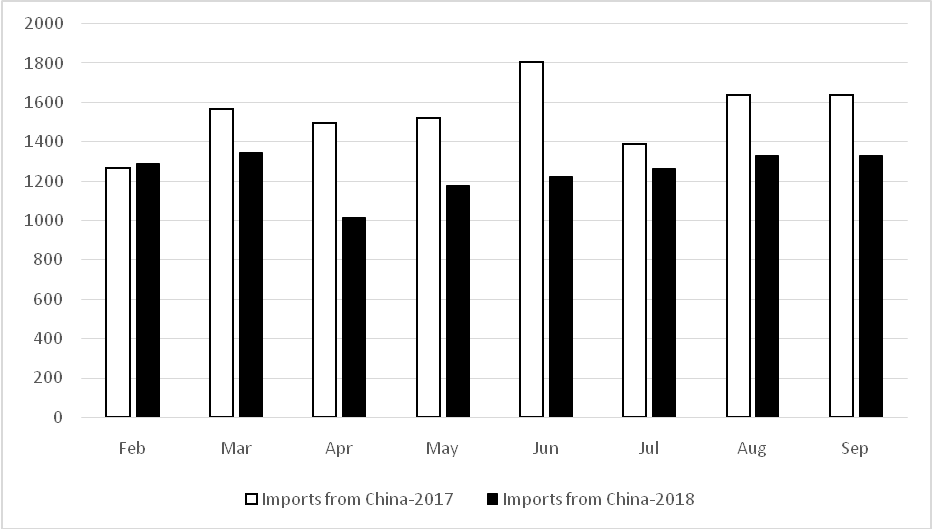
Source: Own Calculation
The government has doubled the import tariffs on Textiles from existing 10% to 20% which was to incentivise the domestic industry. The Textile industry has been facing tough competition from Vietnam, Sri Lanka and Bangladesh.
Table 5 : Summary on Textile Commodities
|
Particulars |
Values |
|
No. of Commodities |
302 |
|
Import Value(Million) |
$ 253.660 |
|
Weighted Average of Effective Rate |
19.919 |
|
Weighted Average of Bound Rate |
36.520 |
Source: Own Calculation
The Trade Weighted Applied Tariff stood at 20% while the Weighted Bound Rate is at 36.520%. The Bound overhang is around 16.5% which needed to be reduced.
The Finance ministry increased the basic customs duty on readymade garments to 20% from the existing 10%. Lately imports from Bangladesh have seen a sharp rise. The overall imports of garments increased from Rs. 3994 crores in 2016-17 to Rs. 4983 crores in 2017-18. India imported textile and apparel products valued $7 billion in 2017-18. The government has increased tariffs on 1.56 billion which accounts for a total of 22% of overall Textiles and apparel products.
Table 6 : Summary on Ready Made Garments
|
Particulars |
Values |
|
No. of Commodities |
141 |
|
Import Value(Million) |
$ 1578.030 |
|
Weighted Average of Effective Rate |
20.000 |
|
Weighted Average of Bound Rate |
26.531 |
The government has increased customs duty of 19 tariff lines which it considered non-essential in nature. The move was to reduce the slump in rupee against dollar. While the most recent tariff hike was to control the Current Account Deficit (CAD).
Table 7 : Summary on Non- Essential Imports
|
Particulars |
Values |
|
No. of Commodities |
129.000 |
|
Import Value(Million) |
$ 3054.74 |
|
Weighted Average of Effective Rate |
17.987 |
|
Weighted Average of Bound Rate |
38.437 |
The present paper tries to make an enquiry into the possibility of raising tariffs to reduce the dependence on imports from China and Rest of the World, without violating commitments made at WTO. The paper finds that our applied rates have been much lower than the bound rates. The government in the Budget 2018 hiked tariff on items ranging from electronic items, telecom goods to mobile equipment. The data of following months show a significant fall in the imports of items where government increased the tariff. The tariff hike in the Union Budget 2018 resulted in a decrease of imports by$4.97 Billion an approximate 7.7% compared to the same period of the previous fiscal year. With regard to China, India has reduced imports to the extent of 2.35 billion dollars which is 20% decrease compared to the same period in the last fiscal year. Later on the government raised tariffs on more items including textile and Non-Essential Imports. The paper finds that still weighted applied rates are much lower than the Weighted Bound rates. Paper concludes that notwithstanding the narrative of free trade benefits (which never accrued), there is a huge scope for protection of domestic industry while remaining within the framework of WTO. This paper supports the initiative taken by government in raising tariffs to protect domestic industries and promote "MAKE IN INDIA". It goes without saying that for manufacturing to contribute to GDP a 25% protective tariffs can play a major role. Raising tariffs would also correct the trade imbalance which India has been facing. The study has not studied the possibilities and the scope of the Non-tariff measures such as Anti-Dumping duties, Safeguard Measures and Counter Veiling Duties (CVD), within WTO rules to achieve the objectives of promoting make in India and correcting trade imbalance.
Beshkar, M., Bond, E. W., & Rho, Y. (2015). Tariff binding and overhang: theory and evidence. Journal of International Economics , 97 (1), 1–13.
Chaudhuri, S. (2015). Import Liberalisation and Premature Deindustrialisation in India. Economic & Political Weekly , 50 (43), 61.
Jose, T. (2016, October 12). Why manufacturing is important than services sector in India’s economic development? - IndianEconomy.net. Retrieved January 14, 2019, from https://www.indianeconomy.net/splclassroom/why-manufacturing-is-important-than-services-sector-in-indias-economic-development/
Mahajan, A. (2018, March 29). Free trade can’t be one-sided. Retrieved from https://www.thestatesman.com/opinion/free-trade-cant-one-sided-1502613484.html
Melitz, M. J. (2003). The impact of trade on intra-industry reallocations and aggregate industry productivity. Econometrica , 71 (6), 1695–1725.
Pelc, K. J. (2014). Law, politics, and the true cost of protectionism: the choice of trade remedies or binding overhang. World Trade Review , 13 (1), 39–64.
Segerstrom, P. S., & Sugita, Y. (2015). The impact of trade liberalization on industrial productivity. Journal of the European Economic Association , 13 (6), 1167–1179.