Pacific B usiness R eview I nternational

A Refereed Monthly International Journal of Management Indexed With THOMSON REUTERS(ESCI)
Mohammad hesam Jahanmiri 1, Fraydoon Rahnama Roodposhti 2*, Hashem Nikoomaram 3
1-PhD Candidate and Faculty of Management and Economy, Science and Research Branch, Islamic Azad UniversityTehran, Iran. E-mail: jahanmirimohamad@yahoo.com
*2-Correspondent Author: Professor and Faculty Member Department of Accounting, Faculty of Management and Economy, Science and Research Branch, Islamic Azad University, Tehran, Iran, E-mail: rahnama.roodposhti@gmail.com
3-Professor and Faculty Member Department of Accounting, Faculty of Management and Economy, Science and Research Branch, Islamic Azad University, Tehran, Iran. E-mail: nikoomaram@srbiau.ac.ir
The aim of this study is to investigate the anchoring bias as a criterion to explain stock returns by a behavioral approach at uncertainty situation for 52-high week strategy to the companies listed on the Tehran Stock Exchange. The information uncertainty criteria include the book value to market value (BV / MV), company age (Age), the size of the entity (MV), lowest price to the highest price of the stock ratio (LHR), the standard deviation of stock returns (STD) and the standard deviation of operating cash flow (CFVOLA). To investigate this issue a main hypothesis and four sub-hypotheses developed for this purpose and data of 99 companies of Tehran Stock Exchange was analyzed for the period 2007 to 2014. Results show that for all the variables except for STD (standard deviation of stock returns), by increasing the degree of information uncertainty, stock returns trend increases for winning portfolios.
Keywords: 52- high week, Stock Returns, Anchoring bias, Behavioral Finance.
Information is the key element in decision-making and the final effectiveness of any decision depends on the results of events occur according to every decision. The ability to predict the out of control details of the events before making a decision will facilitate the best decision making. Generally, the purpose of forecasting is to reduce risk in decision making and as forecasting, cannot completely eliminate risk, it is necessary decision-making process, considers the results of remaining uncertainty clearly to forecast.
People generally begin the estimation process, based on an initial mental figure "anchoring" and on the basis of their past records and, do positive or negative adjustment on the figure in order to ensure new information. Several studies show that people regardless of quality and how to choose the anchoring, do this work. Therefore, they don’t perform the necessary adjustments adequately and the adjustment is often biased. Anchoring and adjustment is a psychological process that affected the rational performance of people in intelligence estimation. Investors are exposed to this type of bias, often are under the influence of "price index" based on individual preferences. For example, when faced with the question of '' must buy or sell stock? ""Or" market share price, below or above its intrinsic value estimates?" consider the anchoring. Rational investors, are faced with new information realistic and without biases and do not interfere points or "target prices" of predetermined, in their biases. This hypothesis is based on a psychological perspective, because: behavioral tendencies (anchoring) increases in a state of uncertainty. Thus, while recognizing the uncertainty factors (increasing uncertainty in the market) and target portfolio, examine the possible relationship between uncertainty and strategies of highest price over the 52 weeks.
George and Hwang (2004) argued that investors use the highest price in 52 weeks, as a point of anchoring ((reference)), in the time of addressing the estimated impact of news on stock price. This behavior leads to a reaction to the news that is especially strong for the stock close to the highest price in 52 weeks. Finally the news spread and slowly absorbed in the stock price that reflects the stock price in the near future. Considering the importance of investing and the stock market in the national economy, information uncertainty, is surveyed as a measure to explain stock returns. The properties due to the impact on the transparency of financial reporting, information asymmetry and the value of the company, cause changes the investors’ behavior.
Anchoring is general tendency of people to the heavy reliance on a feature or piece of information more available when making decisions. People use the current information when forecasts future events and then, according to other information or current condition, form the intuitive adjustment (Saeedi and Farhanian; 2011). Investors act based on individual preferences in the bias, that means they focused on the psychological not statistical anchor and involve the preset points, such as purchase price or price targets in their decisions (Rahnama Roodposhti and Zandieh; 2012). If there is no detailed information about the stock price, the current price is considered as correct price in the stock market or when market boom, after every time prices rise, people's minds the last price as a previous anchor and the prior Information considered irrelevant. People usually pay less attention to the latest published information and involve it in the decision-making less than previous information especially if the data are complex, there is a little reaction to the new information. Meanwhile, risk and risk aversion is the basis for the expected utility theory in knowledge economic and financial sciences. It often said that people prefer a more low volatility options. Utility theory also suggests that people prefer a low volatility. In other words, it assumes that people do not like the risky consumption plan, and to choose a risky consume plan expect a reward. This form of preference forms the foundation of modern financial theory: more risk assets should have a higher expected rate of return. Risk measurement is based on the distribution of benefits underlying assets (Hava,2011). Comments on Knight (1928), the distinction between risk and uncertainty is that the risk can be measured implied by determining the probability of each output. However in the case of uncertainty, there is not accurate and complete information to assess and determine its likelihood. As well as, with Markowitz's portfolio theory and neoclassical pricing models, financial research was mainly focused on the risk and its adoption reward. The models are based on the assumption that receipts distribution of risky assets is obvious to all investors before making investment decisions. Supposed models also rely on completeness of the information and thus ignore the problem of the lack of reliable information. On the other hand the theory of efficient investment tool that was introduced in 1970 by Fama and drew the attention of many financial scholars relied on a very important assumption. First, investors in making their decisions in the market, they behave rationally. Second, they act based on the latest information and news to buy and sell securities and as a result, stock prices is always close to its intrinsic value and not any arbitrage opportunities (Raee et al., 2011).
The relationship of information uncertainty and arbitrage restrictions also states that information uncertainty may create barriers for investors to be disruptive. When information uncertainty increases on the company or the market, also increases the risk of arbitrage. As a result, professional investor, despite having full information about the correct values, it is possible to avoid that the market temporarily. In addition, cost information increases with the increase of information uncertainty, and so the process of convergence between the stock price and its fundamental value is delayed. Therefore those who arbitrage may remain neutral to avoid liquidity risk and additional costs (Shleifer and Vishny;1997). So it seems that information uncertainty can be exacerbated market abnormalities. In this regard, Jiang et al. (2005) and Zhang (2006) have shown that shares with higher information uncertainty have more price momentum and earnings momentum. They said that had information certainty encourage investors to have less reaction to the news and thus lead to the formation of momentum. Therefore, understanding the relationship between information uncertainty and behavioral approach is also important. Uncertainty is a basic issue in strategic decision making and emerges when individuals have not full confidence in the perception of the basic events and changes in their business environment and are unable to predict the future correctly. Uncertainty comes from factors, and possible environmental issues and probabilities that are highly inappreciable and needs more opportunistic and strategic vision. So it is beyond the risk, since risk can merely cover the assessed contingencies. Also, unlike the risk that is a negative concept, uncertainty is not a positive or negative concept and from another perspective, uncertainty can contain very high income likely be higher than expected while, the risk is not. However, by psychological insight, uncertainty comes not only from the external environment, but also from the inability to understand the situations that links to the knowledge and include perception, cognition and human error (Rahnama Roodposhti and Zandieh; 2012). George and Hwang (2004) argue that investors use the highest price over the last 52 weeks as an anchor (reference) to estimate the effect of news on stock prices. The assumption is based on a psychological perspective as behavioral tendencies increases in the status of information uncertainty. This behavior leads to a kind of reaction to the news, especially is stronger for stocks near the highest price in 52 weeks. Finally the news spread and slowly absorbed in the stock price and the phenomenon leads to behavioral bias, under reaction and eventually created the future price acceleration. Thus, according to George and Hwang, the anchoring will be the motive of the acceleration profit, which is more significant in the situation of uncertainty. The environment around us, every day becomes more complex and this complexity leads to confusion and uncertainty. Many researches have been done in this area, including Sanjay and Conway (2015) deals with the issue of profitability, prices, income and momentum strategy. In this paper, profitable strategies are classified into univariate and multivariate move. Momentum earnings found by using data for 493 companies that are part of the Bombay Stock Exchange BSE 500 index in India from January 2002 to June 2010. In short, the momentum strategy is profitable. Momentum earnings, is able to deduce price and income move. In addition, the information content of gradual earnings surprises is very small. The capital asset pricing model (CAPM), Fama and French models are successful models to explain it. The analysis indicates strong support for explaining the behavior patterns overreaction to both winners and losers therefore winners and losers do better behavior during the market moves. This study contributes to asset pricing and behavioral finance literature, especially in emerging markets such as India.
Haw et al (2015) in their study surveyed the role of above 52-week in explaining the acceleration gains in the Taiwan stock market by comparing the two strategies, related to harness and postponement of biases. They showed that the profitability of 52-weeks high strategy by negative returns in January significantly weakened, while profitability is postponement strategy and is not sensitive to seasonal January. Further research shows that when all the strategies are discussed, above 52-weeks strategy plays a decisive role in production efficiency during the sample period from January to December 1982 while it postponement strategy, most of the profits in 1970, show results in general.
Chen et al. (2015) investigate the effect of reflection of strategy efficiency of the highest price in 52 weeks. Their results showed that the highest price close in 52 weeks has a positive and significant relationship with future stock returns is returns that shows the reflective effect in stock returns.
March (2016) investigate the effect of nearness of stock prices to the highest stock price in the 52 weeks in short-term sales behavior in the United States. The results showed that the short-term sales have a close and negative relationship with the highest stock price in the last 52 weeks.
Saeedi and Mahdavi Rad (2014) study herding behavior among managers of investing companies in Iran's capital market. The study measured using Laconia Shf model model in the Iranian capital market and investigated its relationship with market returns and value of transactions. For this purpose, all the investment firms were studied in the Iranian capital market during the period of 2007 to 2010 which implies the existence of herding behavior among executives of the companies. The results show that the average herding behavior is 8.59%. A s well as, significant linear relationship was not confirmed between the current market efficiency and herding behavior of investing companies managers but an inverse relationship was confirmed between the value of transactions and the amount of herding behavior.
Seifollahi et al. (2015) in a study designed to compare the behavioral factors involved in investing in financial assets. In order to examine this issue, 593 investors as respondents of Tehran Stock Exchange randomly selected as a sample and the required data is collected using a questionnaire. Data were collected and hypotheses were analyzed. The results showed that all factors other than the factor of "overconfidence" affect investment and the effects are different for each of them. Ranking in terms of the impact of these factors include: the relative gains and losses, disposition effect, conservative, herding behavior, Representing intuition, the effect of ownership, and regret aversion.
3- Research hypothesis
The first hypothesis: Increase (decrease) of information uncertainty based on behavioral bias of anchoring, leads to an increase (decrease) in stock returns in the future winner portfolio
The second hypothesis: Increase (decrease) of information uncertainty based on behavioral bias of anchoring, leads to a decrease (increase) in stock returns in the future loser portfolio
The third hypothesis: In the stock price levels closer to the highest price, the usefulness of the strategy of highest stock price in the last 52 weeks will be more
The forth hypothesis: In the stock price levels farther to the highest price, the usefulness of the strategy of highest stock price in the last 52 weeks will be more
Conceptual and executive Model of the study is presented in the following graph 1:
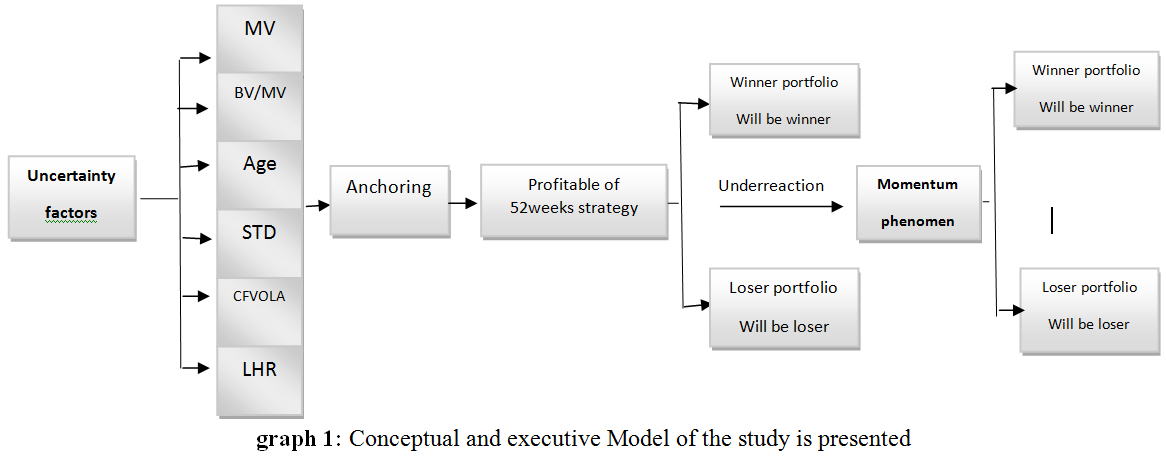
As Zhang (2004) shows information uncertainty is defined as uncertainty about the impact of new information on a company's value. The uncertainty can be caused by the volatility of the Company or the quality of information. The stocks with a high uncertainty are shown with the symbol (H) and stocks with lower uncertainty with the symbol (L). As anticipate that the winners of the strategy of the highest price in 52 weeks, with high uncertainty in the future have more returns than the winners of the strategy with less uncertainty, we use the variables of uncertainty as below:
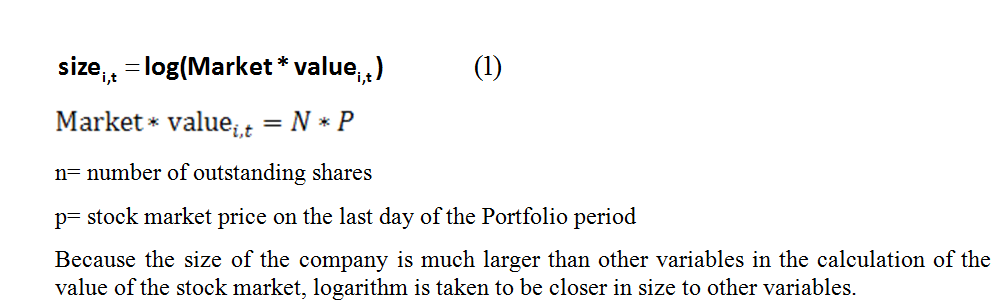
Size of the company: The stock market value of the company has been used as the size of the company and is derived from the stock market price on the last day of the Portfolio period multiplied by the number of outstanding shares.(MV)
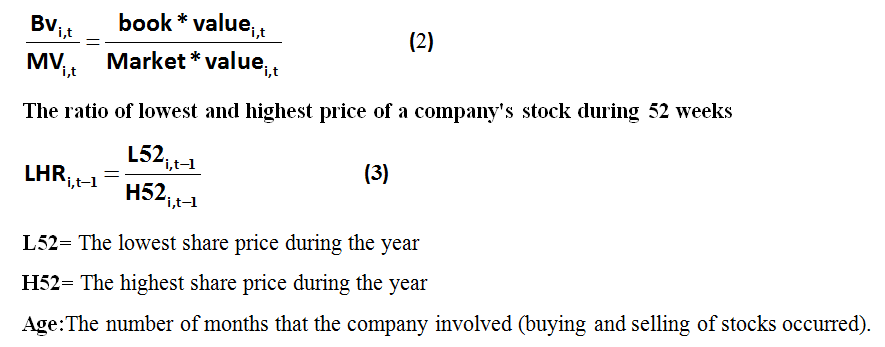
The ratio of book value to market value(BV/MV)
The ratio of book value to market value is basically calculated on the method that first the book value of the company's common stock is determined using data from the last balance sheet. The Stock market value is determined through multiplying the market price of the common shares on the last day of portfolios in the number of outstanding shares then the book value of equity, divided by its market value, so that this ratio is obtained.
Price fluctuations or standard deviation of stock price (STD)
It is the standard deviation of weekly returns during the 12 months before the date of portfolio
The standard deviation of operating cash flow (CFVOLA)
It is the standard deviation of cash flow from operations divided by the average assets of the company in a year
The effectiveness of each strategy is determined, based on the difference between the return of winner portfolio and the loser portfolio.
WML=RWi-RLO RWi= Return of winner portfolio RLo= Return of loser portfolio
(J / S / K) symbol is considered for the momentum strategy where J represents the genesis and classification of portfolios, S is regardless period that is also shown with (t) and K is period of storage portfolio. To measure the return of (S) period, t-test is used and shown as below:
Rt=C+Ut
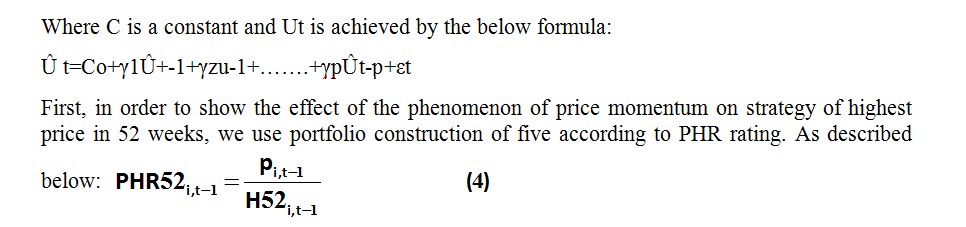
Where: Pi,t-1 is the stock price on the first day of the month t-1 and H52i,t1: is the highest price during the one-year period ending on the first day of the month t-1
According to the formula (4) all stock in the month t-1 is divided into 5 portfolios and 20% of stocks with the largest amount of PHR is shown with P1.
Stock returns are classified the highest and lowest amount monthly for each of the six criteria, from U1 to U5.
U5: related to stock with the highest returns and U1 related to stock the lowest returns. Then, within each of the portfolios of the U1 and U5 is also divided based on information uncertainty from H1 to H5.
In order to upgrade the hypothesis testing (Effect of information uncertainty on the usefulness of the highest price in 52 weeks) monthly excess return of risk appetite to spend must be controlled on different levels of uncertainty for the loser and the winner stock that is done through Fama-French three-factor model.

Rit-rft: excess return stock of winners and losers week strategies, compared to the risk-free rate of return
SMB: The difference between the return on stocks of small companies and large companies portfolio returns
HML: the difference between the highest portfolio returns of book value to the market and with the lowest ratio of book value to market price
Suitable statistical tests can be conducted to investigate the relationship between uncertainty and 52 weeks highest price strategies and momentum strategy to confirm or refute the hypotheses of research.
So it is assumed that: Anchoring à High 52 week
5-1 Tests of hypotheses related to uncertainty
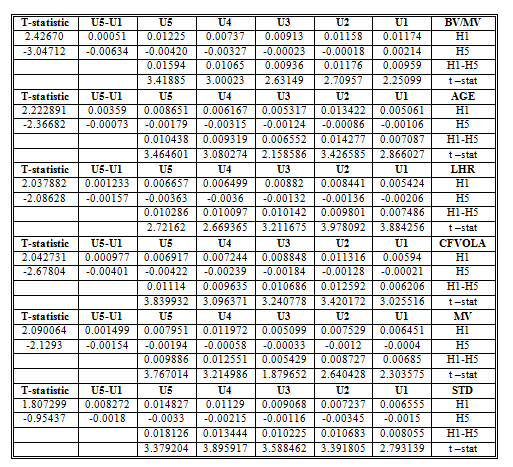
To test the hypotheses, usefulness of strategy of highest price in 52 weeks, must be calculated and determined for each of the six criteria of unreliability and separately for each criterion at different levels of information uncertainty shown with U1 and U5. For this purpose, portfolio was formed according to the PHR (stock price in the last day before the portfolio of the highest price in 52 weeks) which identified with H1 to H5 in the table below. H1 (H5) is 20 percent of the shares with the highest value, PHR is (20% of the stock with the lowest PHR). Subsequently H1 to H5 separately based on the degree of information uncertainty of the independent variable was divided into five sections of (U1 to U5). Thereby creating a matrix 5 * 5 with an extra row H1-H5. (The difference between normal return on stock with the highest PHR to return on stock with the lowest PHR). That is, the difference between the average return of winner portfolio with an average return of loser portfolio and also added a column U5-U1 which represents the difference between the average stock return with the highest degree of uncertainty and stock with the lowest degree of uncertainty. Results are in Table 1:
Table 1: 52-week high price strategy performance in different informational uncertainty
The results of testing the hypothesis of uncertainty
Evaluation of the results of Table 1 indicate that with increasing degree of information uncertainty- as one of the accepted criteria of risk increment - almost all variables except the independent variable standard deviation of stock returns(STD), to winner portfolio (loser portfolio) average returns increase (decrease). The value of U1-U5 has been positive and significant for the winner portfolio (H1) and negative and significant for the loser portfolio (H5). As well as the significance level had been more in the portfolio H1 (H5), the stock with a price closer to the highest price in 52 weeks (stock price farther than the highest price in 52 weeks).
5.2 Hypotheses testing based on Fama and French adjusted returns
In order to increase the reliability and the generalizability of results, the portfolio of the strategy of highest price in 52 weeks consisted according to adjusted return rate of three-factor model of Fama and French. Table 2 shows the results for every six independent variables and different levels of information uncertainty. The results confirmed the hypotheses and according to the results of the portfolio with an average real return. Table 2 reaffirms the hypotheses for almost all variables and different price levels and different levels of uncertainty. Furthermore, results indicate that significance degree by increasing the degree of information uncertainty for the winner portfolio show a significant positive relationship and for the loser portfolio represents a negative and significant relationship nearly for all independent variables which suggests that the results is confirmed in a significant level of 5 percent.
5.2 momentum strategy performance in different conditions of information uncertainty
To investigate the effect of uncertainty about the stock-adjusted returns based on the three-factor model of Fama and French portfolio was formed and determined the average efficiency of 30% for the first winner portfolio with the highest return in the keeping period and the loser portfolio consists of the last 30% with the lowest average return in storage period that are marked with M1 and M3. The results are shown in Table 2.
Table 2. momentum strategy performance in different conditions of information uncertainty
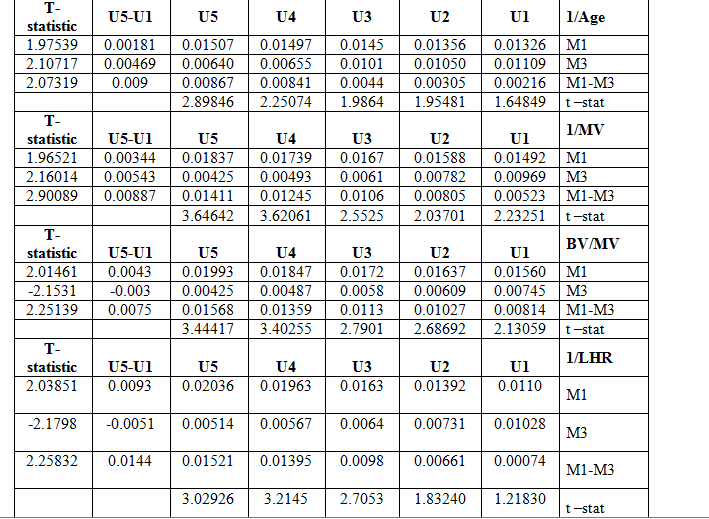
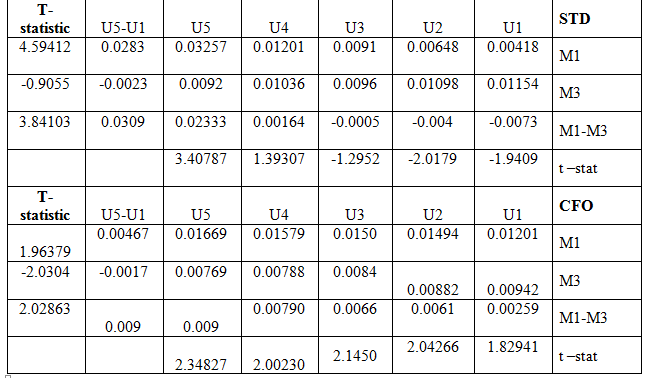
The results of Table 2 indicate that the difference between M1 and M3 shows acceleration strategy calculated that the t-statistic results have been positive and significant for most independent variables. The remarkable thing is that, by increasing the degree of information uncertainty from U1 to U5 also signification has increasing trend. In addition, the return difference between the maximum of information uncertainty (U5) with a minimum of information uncertainty (U1) for the winner portfolio (M1) for all variables are positive and significant and also for the loser portfolio (M3) for all variables other than the independent variable standard deviation of stock returns (STD). Remarkable note on the above table analysis, signification is more for the loser portfolio to winner portfolio. It is true about all variables except for the standard deviation of stock returns (STD).
5.4 The results of the research hypotheses
The first hypothesis: Increase (decrease) of information uncertainty based on behavioral bias of anchoring, leads to an increase (decrease) in stock returns in the future winner portfolio. The results of the various portfolios for each of the six independent variable of tables (1) and (2) show that in the case of variables including: the book value to market value (BV / MV), company age (Age), the size of the entity (MV), lowest price to the highest price of the stock ratio (LHR), the standard deviation of stock returns (STD) and the standard deviation of operating cash flow (CFVOLA), with the increasing uncertainty from U1 to U5 real return on stocks in the portfolio has generally increased and value of statistic t which represents the signification of given independent variable is positive and significant for the winner portfolio (H1). It can be stated by analysis and interpretation of the results that increasing of information uncertainty as an outcome of the six independent variables increases, leading to behavioral phenomena of anchoring that's means the highest price in the past 52 weeks. So the higher degree of uncertainty of winning stock performance continues (phenomenon of price acceleration).. In simple terms by increasing information uncertainty from the level U1 to U5, the phenomenon of the momentum of prices in both portfolios, according to Strategy of highest price in 52 weeks and the momentum strategy has strengthened trend of positive return of winning stock and have higher level of signification. Results match with George and Hwang (2004).
The second hypothesis:(decrease) of information uncertainty based on behavioral bias of anchoring, leads to a decrease (increase) in stock returns in the future loser portfolio. To test the second hypothesis the loser portfolio for the strategy of the highest price formed in two states. First with the dependent variable real returns and second the dependent variable adjusted returns of Fama and French in Table (1) and then the same test was conducted on the basis of the momentum strategy for the loser portfolio. Table 2 shows the results of t-test for the loser portfolio in Table 1 that is negative and significant for all variables except (STD). This means that by increasing the degree of uncertainty return decreases and vice versa.
The third hypothesis: In the stock price levels closer to the highest price, the usefulness of the strategy of highest stock price in the last 52 weeks will be more,to test the hypothesis, we should make an operational definition of usefulness strategy at levels close to the highest price in 52 weeks. In Table (1) line H1, relates to the winner portfolio with the most amount of PHR or the closest price to the highest price in 52 weeks. H1-H5 amount represents the difference between the return of winner portfolio and the loser one. As specified in the table (t) value for all variables and to all levels of uncertainty is greater than 2 , the positive and significant. The interpretation of the hypothesis test results in Table 1 shows, the highest positive returns belongs to the winner portfolio of H1 on average. The results of table (2) are also re-confirmed on the basis of acceleration momentum the six independent variables of BV / MV, AGE, LHR, CFVOLA, MV and STD. According to the above results the third hypothesis is significant and confirmed at the level of 95%.
The forth hypothesis: In the stock price levels farther to the highest price, the usefulness of the strategy of highest stock price in the last 52 weeks will be more. In Table (1) line H5, relates to the loser portfolio with the least amount of PHR or the farthest price to the highest price in 52 weeks.
The aim of this research is to explain the usefulness of highest price in the last 52 weeks in terms of uncertainty based on behavioral phenomenon of anchoring and follow the behavioral explanation for the phenomenon of price momentum created by the behavioral bias anchoring. To evaluate the impact of behavioral bias of anchoring on the usefulness the strategy of the highest price in 52 weeks used according to George and Hwang (2004) based on a psychological perspective to enhance behavioral phenomena in terms of uncertainty and lack of transparency of information. Process and research results analyzed and conducted with different degrees of uncertainty from low to high. To achieve this end, in addition to the actual efficiency was analyzed as the dependent variable again, in order to control the impact of variable of business size (SMB) and stock price (HML) real stock returns were adjusted based on Fama French three-factor model. Independent variables of uncertainty included: company size, ratio of book value to market value, age, cash flow volatility, volatility of stock returns and ultimately ratio of lowest price of stock to the highest price for a year (Hans Peter Flick and Portman, 2011). The original model of study was as follows:
Anchoring(informational uncertaity) profitability of 52-high week (under-reaction) profitability of Momentum
(George and Hwang 2004) and (Portman 2011). This means that the increase in information uncertainty leads to greater use of investors from the anchoring (mental anchor) to make decisions about buying and selling and investing in the stock. So in terms of the degree of smaller or bigger uncertainty behavioral bias of anchoring is differently used. As a result, investment strategy of the highest price in the past 52 weeks based on the highest price, as a reference to decision-making under uncertainty has more applications. We separately tested the impact of each of the six variables to create returns in rated stock according to the two strategies of highest price in 52 weeks and momentum strategy. The results show that for all the variables (except STD- standard deviation of stock returns) by increasing the degree of information uncertainty the trend of stock returns for winner led to portfolios a significant increase in stock returns. These results were also confirmed by previous studies and literature. In the way that the effect of good information increases the stock price near the highest price in 52 weeks occurs gradually and with a delay due to the bias of anchoring. This led to the creation or exacerbation of the under-reaction phenomenon which finally leads to increase the efficiency of the stock at a future time period. This, at prices farther than the highest price in 52 weeks (or closer to the lowest price in 52 weeks) creates a similar situation in the investment decisions which again led to under-reaction phenomenon and finally to price trends (the phenomenon of acceleration of prices). That is, the positive return cause to continue the positive trend in the future and the past negative returns cause negative trend in the future. The results showed that the trend is more significant in price levels closer (farther) or in the stock with positive returns (negative).
Studies and data show that this research had not been done in Iran. The most important aspect of the research is to create and identify a new explanation for the phenomenon of price momentum as one of the most contrary to existing rules that conflict with the efficient market hypothesis and theories of modern finance. This is a great achievement that we have a new behavior model useful in explaining the momentum phenomenon and the highest price in 52 weeks. Previous researches surveyed the effect of under-reaction phenomenon and the phenomenon of the over-reaction in the occurrence of adverse price. But the usage of mental anchor in uncertainty conditions and the results in determining of strategies of highest price in 52 weeks and momentum is new and unique. Besides, the results have confirmed a link between performance of the highest price and momentum strategy, especially in the higher information uncertainty.
Abu Torabi, Gholamreza; Fallahpour, Saeed, and Saadi, Rasol. (2013). The relationship between the individual daily stock returns and the highest price in last 52 weeks of in Tehran Stock Exchange
Akbari, Zahra, and Hakak, Muhammad. (2012). Reviews and test acceleration of the phenomenon of boom and slump, Quarterly Science and Research Journal of investment knowledge
Raee, Reza, Eslami Bidgoli, Gholamreza., and Bayati, M. Mirza. (2010). Stock valuation and heterogeneity of stakeholders ’ behavior in the Tehran Stock Exchange. Knowledge of accounting, No. 5, pp. 103-125.
Raee, Reza, and Fallahpour, Saeed. (2004). Behavioral finance as a different approach in the financial sphere. Financial Research, No. 7, pp. 53-99.
Rahnama Roodposhti, Faraydon; and Zand, Vahid. (2012). Book of behavioral finance, and nervous financial (fiscal new paradigm ).
Rahnama Roodposhti, Faraydon; Saeedi, Ali, Madanchi Zaj, Mahdi and Nikomaram, Hashem (2015). The speed of adjustment in stock prices more reactive and less reactive approach to evaluating the performance of investors and financial markets efficiency. Quarterly Science and Research Journal of investment knowledge
Zarei, Reza and Shavakhi, Alireza. (2006). Evaluate the performance of investment strategies in the Tehran Stock Exchange, Financial Research.
Saeedi, Ali; Farhanian, Sayed Mohammad Javad. (2011). Basics of economics and behavioral finance, Tehran, information and exchange services company.
Seif Allahi, Razeye and Kordluee, Hamidreza. (2015). A comparative study of behavioral factors in investing in financial assets. Quarterly Science and Research Journal of investment knowledge
Ghalibaf Asl, Hassan and Rasekh, Somayeh. (2013). The survey of effectiveness of price limits in Tehran Stock Exchange, management studies in Iran, Issue 3, Pages 210-19.
Hirshleifer, D. (2001). Investor psychology and asset pricing. Journal of Finance,56(4), 1533-1591.
Hong, H., Lim, T., Stein, J.: Bad news travels slowly: size, analyst coverage and the profitability of momentum strategies. J. Finance 40, 265–295 (2000)
Hua, J. (2011). The impact of information uncertainty on stock price performance and managers equity financing decision.
Imhoff, E.A., Lobo, G.J.: The effect of ex ante earnings uncertainty on earnings response coefficients. Account. Rev. 67, 427–429 (1992)
Jegadeesh, N., Titman, S.: Profitability of momentum strategies: an evaluation of alternative explanations. J. Finance 56, 699–720 (2001)
Jegadeesh, N., Titman, S.: Returns to buying winners and selling losers: implications for stock market efficiency. J. Finance 48, 65–91 (1993)
Jiang, G. H., Lee, C. M., & Zhang, a. Y. (2005). Information uncertainty and expected returns. Review of Accounting Studies, 10(2-3), 185-221.
Kahneman, D., Tversky, A.: Judgment Under Uncertainty: Heuristics and Biases. Cambridge University Press, Cambridge (1982)
Lang, M., Lundholm, R.: Corporate disclosure policy and analyst behavior. Account. Rev. 71, 467–492 (1996)
Lim, T.: Rationality and analysts’ forecast bias. J. Finance 56, 369–385 (2001)
Lo, A., MacKinlay, C.: When are contrarian profits due to stock market overreaction? Rev. Financ. Stud. 3, 175–205 (1990)
Moskowitz, T., Grinblatt, M.: Do industries explain momentum? J. Finance 54, 1249–1290 (1999)
Rey, D., Schmid,M.: Feasible momentum strategies: evidence from the Swiss stock market. Financ. Mark. Portf. Manag. 21, 325–352 (2007)
Rouwenhorst, K.: International momentum strategies. J. Finance 53, 267–284 (1998)
Shleifer, A., & Vishny, a. R. (1997). The limits of arbitrage. Journal of Finance,52(1), 35-55.
Siganos, A.: Can small investors exploit the momentum effect. Financ. Mark. Portf. Manag. 24(2), 171– 192 (2010)
Tversky, A., Kahneman, D.: Judgment under uncertainty: heuristics and biases. Science 185, 1124–1131 (1974)
Zhang, F.: Information uncertainty and stock returns. J. Finance 61, 105–136 (2006)
zhang, X. (2006). Information uncertainty and stock returns. Journal of Finance, 61 (1), 105-136.