Pacific B usiness R eview I nternational

A Refereed Monthly International Journal of Management Indexed With THOMSON REUTERS(ESCI)
|
Dr. Kapil R. Chandoriya Assistant Professor Makhanlal Chaturvedi National University of Journalism and Communication – Bhopal Address1: - Flat 605, Lotus Emprilla, Phase-1, Bawadiyan Kalan, Bhopal 462026 MP (INDIA) Address2:- 97-A, Nehru Colony, Thatipur, Gwalior 474011 MP (INDIA) Contact No.:- 9713150770 E-mail:- kapilraj.chandoriya@gmail.com |
Online advertising is biggest successful medium to communication individual consumers any time of the day. It’s very cheapest medium to convey relevant messages and repeated also possible. A product/brands recall is a request to return a product after the discovery of safety issues or product/brands defects that might endanger the consumer or put the maker/seller at risk of legal action. At the same time online advertising play very important role to suddenly change the consumers repurchase intension towards a particular product. In this study researcher will going to search the either positive or negative relationship between Online Advertising and Recalling brands by using survey methods among 180 people from Bhopal and Gwalior city.
Keywords: Online Advertising, Recalling Brands, Consumer.
From the last five years, the budgets for advertising allocated to internet media have grown dramatically. In the year 2012, the internet will characterize 26% of total expenditure of advertising all over the world and this value could reach 31% in the next four years. This type of growth is extensively fuelled by search and “performance” tools (affiliate marketing, email, comparison websites, etc.), although display advertising continues to represent a large portion of online budgets (49% in 2010 and 45% in 2012). Two trends are driving this boom (i) an increase in Web usage which strengthens the internet’s role in providing recommendations and preparing consumers to make purchases and recommendations (ii) developments in targeted advertising formats and techniques which help shape more communicative and relevant online campaigns. In today’s cut throat competition, the emphasis is on, price reduction and all companies are trying to reduce cost by whatever means possible. It is however fair to say that online advertising play an important role. The growing area of interactive advertising presents new challenges for advertisers to motivate customer. Online advertising passes several benefits like it increases efficiency, reduces costs, provides more flexibility and as a global medium.
The brand awareness has turned into an important variable that impacts customer's perceptions of a particular brand. Achievement in brand management arises from understanding and overseeing brand image and loyalty correctly to create strong characteristics that will impact consumers when making on their decisions. The main aim of this paper is to propose methods through which awareness can be created through online advertising for brands in the market. The trend in the market that has been observed particularly for consumer products over last couple of decades is high level of brand consciousness amongst consumers’ behavior. On the other hand the advancement of the market in terms of their knowledge and maturity provides new opportunities and avenues for marketing as well. The proposed paper targets this issue by providing businesses with optimal methods for creating awareness for their brand using traditional as well as new media i.e. online advertising. Internet is organized around the individuals where social and expert rings are persuasive and prompts online purchasing furthermore online awareness.
2.1. Online Advertising
Puranik (2003), discussed about AIDA (Attention, Interest, Desire, and Action) model. Since that time, discussion of criteria has centered on this basic idea in one form or another. Adams et al (2013), online advertising, the advertising esentials remain the same – advertising needs to engage with potential travelers and move them from awareness to action. Ratliff & Rubinfeld (2011), Internet advertising has grown very rapidly over the past decade as consumers have shifted their attention online. That growth will undoubtedly continue for at least another decade, although the rate of growth will slow. Gao (2003), online advertising has been widely accepted and used in today's real world, there are many engineering issues and technical challenges in building cost-effective online advertising systems. Bakshi & Gupta (2013), The need is to understand the target consumers and then strategize wisely in order to gain maximum out of this new medium. Mohammed & Alkubise (2012), In an effort to explore the factors that affect online advertisement effectiveness, this paper investigate the factors that influence online advertisement and hence the purchasing intention among Jordanian university students.
2.2. Brand Awareness
Branding is a most popular issue having a significant quantity of work done by researchers on latest product launch and brand awareness. Brands are also more powerful in terms of forging relationship with customer which is sustainable and profitable compared to regular unbranded products (De Chernatony, L., et al.,2010). It has been derived that brand awareness can be created through the presentation of brands to the customers which in turn develop a stimuli like response from them where they are able to relate, recognize, recall and be on the whole aware of brands. The new products on the other hand make use of advertising and promotion to increase the awareness of product amongst the existing and potential consumers of the product. Strategies that can be employed by businesses to increase awareness of brands include making us of attitude advertising and management of the brand image, (Percy et al.,2006). According to Arslan & Altuna,2010 brand image as the positive and negative feeling about the brand concerning the brain of the customers unexpectedly or when they recall their memories. They have the view that there are three aspects of brand image which make the entire image of the brand which are; positivity, strength, and peculiarity. Clarify the brand image as the general personality reflection and convictions about the specific brand by remembering its unique qualities which make it not the same as the others. The brand image is important aspect towards buy expectation. It drives the customers to expend more esteem on the particular brand having good brand image. (Lee, Lee and Wu,2011).
Research is essentially a systematic enquiry seeking facts through objectives verifiable methods in order to discover the relationship among them and to deduce from them broad principles or laws.
3.1. Objectives of the Study
a. To design and develop standard measure to evaluate effectiveness of online advertising and brand awareness in markets
b. To identify the underlying factors of effectiveness of online advertising and brand awareness in markets
c. To find out the causal effect relationship between effectiveness of online advertising and brand awareness in markets
d. To open the new vistas for forthcoming research
3.2. Hypotheses
H01. It states no impact of online advertising on brand Image.
H02. It states no impact of online advertising on brand Trust
H03. It states no impact of online advertising on brand Affect.
H04. It states no impact of online advertising on brand Awareness.
3.3. Research Design
The study was exploratory and descriptive in nature. The data was collected through survey method and relationships between all variables were evaluated by using statistical tools.
i. Sample Design
a. Population
The population for the study is included from Bhopal & Gwalior division of the M. P.
b. Sampling Frame
All individual consumers of branded products in Bhopal & Gwalior M. P. were sampling frame.
c. Sampling Technique
Non Probability, purposive and convenient sampling technique was used to identify the respondents of the study. Proportionate re-presenters from all the demographic groups were ensured to minimize sampling error.
d. Sampling Elements
Individual respondent was sampling element of the study.
e. Sample Size
Sample size was 180 questionnaires distributed of Bhopal division but 171 were returned with relevant response so the valid sample size for this study remains 171. The data was collected by the researcher himself after developing report with the respondents.
ii. Secondary Data
Researcher has been collected secondary data from various literatures to various sources such as Research articles and research paper in Journals, Books, Magazines, Reports (Government/Corporate, News Paper, Television in form of print and online through Internet regarding the present situation of effectiveness of online advertisement among markets Madhya Pradesh.
iii. Tools to be Used for Data Collection
Self design questionnaire will be used to measures all the variables. The data will be collected on the scale of 1-5 Likert’s scale.
iv. Tools to Used for Data Analysis
Reliability, Normality, Factor analysis and Regression
v. Software Used for Statistical Analysis
Collected data has been analyzed by researcher himself with the help of statistical package for social science (SPSS) version 20.
4.1. Reliability & Normality Test
4.1.1. Reliability through Cronbach’s Alpha
Reliability test for the variables were carried out by using SPSS software and the reliability test measures are given below
|
Variables |
Cronbach's Alpha |
Guttman |
Split Half |
Parallel |
N of Items |
|
Online Advertising |
.783 |
.698 |
.937 |
.797 |
15 |
|
Brand Awareness |
.817 |
.763 |
.893 |
.810 |
08 |
There is Cronbach’s Alpha value is 0.783 for online advertising and 0.817 for brand awareness obtained by the reliability analysis this value is greater than standard value of Cronbach’s Alpha value i.e. 0.7, it mean our questionnaire has been reliable and provide us exact information as we want from data.
4.1.2. Normality through K-S Test & Shapiro-Wilk
An estimation of the normality of data is a requirement for many statistical analyses because normal data is a fundamental assumption in parametric testing. There are two main methods of assessing normality: graphically and numerically. The table below presents the results from two well-known tests of normality, namely the Kolmogorov-Smirnov Test & the Shapiro-Wilk Test.
|
Variables |
Kolmogorov-Smirnova |
Shapiro-Wilk |
||
|
Online Advertising |
.364 |
.123 |
.286 |
.205 |
|
Brand Awareness |
.259 |
.094 |
.319 |
.162 |
In the table shows that data is normally distributed with insignificant level of (0.123=KS value & .205 Shapiro-wilk) for online advertising & (.094 = KS Value & .162 = Shapiro-wilk) for brand awareness. It is because if the insignificance value of the KS as well as Shapiro-Wilk Test are greater than 0.05, the data is normal.
4.2. Factor Analysis
Factor analysis is a statistical method used to describe variability among observed, correlated variables in terms of a potentially lower number of unobserved variables called factors. Factor analysis searches for such joint variations in response to unobserved latent variables. The information gained about the interdependencies between observed variables can be used later to reduce the set of variables in a dataset.
4.2.1. Validity Analysis through Kaiser Meyer Olkin for Effectiveness of Online Advertisement and Brand Awareness
|
S. |
Variable Name |
K.M.O. Value |
Chi-Square |
Df |
Sig. |
Action |
|
1 |
Online Advertising |
.826 |
7.374E9 |
170 |
.000 |
Adequate for Factor Analysis |
|
2 |
Brand Awareness |
.792 |
7.941E3 |
170 |
.000 |
The obtain value of Kaiser- Meyer- Olkin Measure of Sampling Adequacy Value was .826 for online advertising and .792 for brand awareness indicating that the sample was adequate to suitable for factor analysis.
4.2.2. Description of Factors for Effectiveness of Online Advertising
Principle component factor analysis with varimax rotation was applied. The raw scores of 15 items were subjected to factor analysis to find out the factors that contribute towards Effectiveness of Online Advertisement. After factor analysis 4 factors were identified. The rotation converged in 18 iterations.
|
S.N |
Factor Name |
Eigen Value |
Item Covered |
Factor Load |
|
|
Total |
% of Variance Explained |
||||
|
1 |
Attention |
6.374 |
27.462 |
Advertising provides complete information. |
.710 |
|
Advertising is pleasing. |
.667 |
||||
|
Advertising has positive effects on the sales. |
.648 |
||||
|
Advertising is very essential. |
.646 |
||||
|
Advertising supplies relevant information |
.603 |
||||
|
Advertising is updating all information of products. |
.577 |
||||
|
2 |
Knowledge |
2.732 |
17.372 |
Advertising provides timely information |
.710 |
|
Advertising is believable |
.675 |
||||
|
Consider advertising before purchase decision |
.671 |
||||
|
Provides accurate information about products |
.640 |
||||
|
3 |
Interest |
1.749 |
6.256 |
Advertising is interesting. |
.718 |
|
Advertising is entertaining. |
.682 |
||||
|
Celebrity in ads motivate for buying products |
.605 |
||||
|
4 |
Feature |
1.309 |
4.864 |
Repetition of ads are pay attention to the advertising |
.851 |
|
Products do not perform as well as the ads claim |
.575 |
||||
4.2.3. Description of Factors for Brand Awareness
Similarly previous the principle component factor analysis with Varimax rotation was applied. The raw scores of 8 items were subjected to factor analysis to find out the factors that contribute towards brand awareness. After factor analysis three factors were identified. The rotation converged in 15 iterations.
|
S.N |
Factor Name |
Eigen Value |
Item Covered |
Factor Load |
|
|
Total |
% of Variance Explained |
||||
|
1 |
Brand Image |
6.172 |
22.482 |
products information |
.710 |
|
Availability of products and service online |
.667 |
||||
|
Easy to use of brand |
.648 |
||||
|
2 |
Brand Trust |
3.284 |
14.294 |
Brand are trustworthy |
.710 |
|
Brand always works |
.675 |
||||
|
There is no side effect of brand always effective |
.671 |
||||
|
3 |
Brand Affect |
1.412 |
6.937 |
Brand always attract to consumers. |
.718 |
|
Use of brand raise standard of living |
.682 |
||||
4.3. Correlation between obtain factors of Online Advertising
|
Attention |
Knowledge |
Interest |
Feature |
|
|
Attention |
1 |
.358** |
.628** |
.596** |
|
Knowledge |
.358** |
1 |
.494** |
.316** |
|
Interest |
.628** |
.494** |
1 |
.572** |
|
Feature |
.596** |
.316** |
.572** |
1 |
|
Sig. (2Tailed) = .000 for All, N (number of items) = 171 |
||||
|
**. Correlation is significant at the 0.01 level (2-tailed). |
||||
The results of correlation coefficient indicating that there are positive relationship between all factors of online advertising.
4.4. Regression Analysis
4.4.1. Linear Regression Analysis between obtain factors of Online Advertising and Brands Image
The regression was calculated by taking the total of all obtain factors of online advertising (separately) as independent variables and brands image as a dependent variable by using SPSS software. The enter method of regression was used.
a. Main Null Hypothesis
H01: There is no impact of Online Advertising (i.e. Attention, Knowledge, Interest and Features) on Brands Image
b. Subsidiary Null Hypotheses
H01.1: It States there is no Impact of Attention on Brands Image
H01.2: It States there is no Impact of Knowledge on Brands Image
H01.3 It States there is no Impact of Interest on Brands Image
H01.4: It States there is no Impact of Feature on Brands Image
|
S |
Independent Variable(s) |
R Value |
R2 Value |
F Value |
t Value |
Beta Value |
Sig. |
Results |
|
1 |
Attention |
.542a |
.293 |
186.335 |
13.650 |
.542 |
.000b |
Null Rejected |
|
2 |
Knowledge |
.237a |
.056 |
26.899 |
5.165 |
.237 |
.000b |
Null Rejected |
|
3 |
Interest |
.012a |
.000 |
0.064 |
-.012 |
.020 |
.801b |
Null Accepted |
|
4 |
Feature |
.021a |
.000 |
0.197 |
-.444 |
.021 |
.657b |
Null Accepted |
|
5 |
All (Online Advertising) |
.566a |
.321 |
52.631 |
13.535 |
.556 |
.000b |
Null Rejected |
|
Dependent Variable : Brand Image |
||||||||
|
Durbin Watson = 1.866(1), 1.726(2), 1.719(3), 1.718(4) & 1.817(5) (between 1-3) = No Auto Correlation VIF Value under Control (1-10) & Tolerance (<1.00) = No Multi-Collinearity |
||||||||
|
Method: Enter Method were used |
||||||||
a. The overall model has good fit indicating by F-test which is tested through regression, F-value that is 52.631 which is significant at 0.000% level of significance, and the value of T i.e. 13.535 also significant at the level of 00.000 level of significant indicating that there is positive relationship between online advertising and brand image. The value of R shown correlation, R value i.e. 0.566 show highly positive correlation and the R square value i.e. 0.321 indicating that 32.1% variance or 32.1% relationship between online advertising and brand image. Hence null hypothesis H01 was can’t be accepted.
b. In the regression found good model fit indicating by F-test, the value of F is 186.335 for Attention & 26.899 for Knowledge which is significant at level of significance i.e. 0.000% for both for Attention & Knowledge, and the value of T i.e. 13.650 for Attention & 5.165 for Knowledge which is also significant at the level of significance i.e. 00.00, indicating that there are positive relationship between attention & knowledge with brand image. The value of R shown correlation, the value of F i.e. 0.542 indicating highly positive correlation between attention and brand image & 0.237 indicating that weak positive correlation between knowledge and brand image and the R square values for attention & knowledge are 0.293 & 0.056 indicating that there is 29.3% attention affect on brand image and 5.6% impact of knowledge on brand image. Hence null hypothesis H01.1 & H 01.2 were can’t be accepted.
c. In the another regression found poor model fit indicating by F- value that is 0.064 for interest & 0.197 for features which is insignificant at level of significance i.e. 0.801% & .657% respectively and the value of T i.e. -0.012 (interest) & -.444 (features) which are also insignificant at the level of significance i.e. 0.801 (interest) & .657 (features) indicating that there are negative impact of interest on brand image & similar negative impact of features on brand image. The value of R shown total correlation between interest & features and brand image which are weak positive through these values 0.012 & 0.021 and R square values for interest & features are 0.000 & 0.000 it mean that there is 00.00% no impact of interest on brand image same there is no impact of features on brand image. Hence null hypothesis H01.3 & H 01.4 were can’t be rejected.
4.4.2. Multiple Regression Analysis between obtain factors of Online Advertising and Brands Image
The regression was calculated by taking the total of all obtain factors of online advertising (separately) as independent variables on brands image as a dependent variable by using SPSS software. The Stepwise method of regression is used.
|
Independent Variable(s) |
R Value |
R2 Value |
F Value |
t Value |
Beta Value |
Sig. |
|
Attention |
.542a |
.293 |
186.335 |
13.650 |
.843 |
.000a |
|
Attention + Knowledge |
.554b |
.307 |
99.200 |
12.734 |
.801 |
.000b |
|
Attention + Knowledge + Feature |
.566c |
.321 |
70.324 |
12.179 |
.770 |
.000c |
|
Dependent Variable : Brand Image |
||||||
|
Durbin Watson = 1.820 (between 1-3) = No Auto Correlation VIF Value under Control (1-10) & Tolerance (<1.00) = No Multi-Collinearity |
||||||
|
Method: Stepwise Method were used |
||||||
a. The value of r square for attention and brand image is 0.293 indicating that attention affected 29.3% on brand image. T value i.e. 13.650 at the 0.00 level of significance indicating that there is positive impact of attention on brand image.
b. The value of r square is 0.307 indicating that attention & knowledge both are affected 30.7% on brand image. T value i.e. 12.734 at the 0.00 level of significance indicating that there are positive impact of both attention & knowledge on brand image.
c. The value of r square i.e. 0.321 indicating that attention, knowledge & features all are affected on brand image. T value at the 0.00 level of significance indicating that there are positive impact of attention, knowledge & feature all on brand image.
4.4.3. Linear Regression Analysis between obtain factors of Online Advertising and Brands Trust
The regression was calculated by taking the total of all obtain factors of online advertising (separately) as independent variables and brands trust as a dependent variable by using SPSS software. The enter method of regression is used.
a. Main Null Hypothesis
H02: There is no impact of Online Advertising (i.e. Attention, Knowledge, Interest and Feature) on Brands Trust
b. Subsidiary Null Hypotheses
H02.1: It States there is no Impact of Attention on Brands Trust
H02.2: It States there is no Impact of Knowledge on Brands Trust
H02.3 It States there is no Impact of Interest on Brands Trust
H02.4: It States there is no Impact of Feature on Brands Trust
|
S |
Independent Variable(s) |
R Value |
R2 Value |
F Value |
t Value |
Beta Value |
Sig. |
Results |
|
1 |
Attention |
.036a |
.001 |
.574 |
-.757 |
-.036 |
.449b |
Null Accepted |
|
2 |
Knowledge |
.536a |
.287 |
180.670 |
13.441 |
.536 |
.000b |
Null Rejected |
|
3 |
Interest |
.671a |
.450 |
367.504 |
19.170 |
.671 |
.000b |
Null Rejected |
|
4 |
Feature |
.656a |
.431 |
340.060 |
18.441 |
.656 |
.000b |
Null Rejected |
|
5 |
All (Online Advertising) |
.749a |
.561 |
574.171 |
23.962 |
.749 |
.000b |
Null Rejected |
|
Dependent Variable : Brand Trust |
||||||||
|
Durbin Watson = 1.864(1), 2.053(2), 2.064(3), 2.099(4), & 2.011 (5) (between 1-3) = No Auto Correlation VIF Value under Control (1-10) & Tolerance (<1.00) = No Multi-Collinearity |
||||||||
|
Method: Enter Method were used |
||||||||
a. The overall model has good fit indicating by F-test tested through regression and found value that is 574.171 which is significant at 0.000% level of significance, and the value of T i.e. 23.962 also significant at the level of 00.000 level of significant indicating that there is positive relationship between online advertising and brand trust. The value of R shown correlation, the R value i.e. 0.749 prove highly positive correlation and R square value i.e. 0.561 indicating that 56.1% variance or 56.1% relationship between online advertising and brand trust. Hence null hypothesis H02 was can’t be accepted.
b. In the regression found good model fit indicating by F-test values which are 180.670 for Knowledge, 367.504 for Interest and 340.060 for Feature which are significant at level of significance i.e. 0.000% for both for all three, and the values of T i.e. 13.441 for Knowledge, 19.170 for Interest and 23.962 for features, which are also significant at the level of significance i.e. 00.00, indicating that there are positive relationship between knowledge, interest & features with brand trust. The value of R shown total correlation i.e. 0.542 indicating highly positive correlation between knowledge and brand trust, 0.671 indicating highly positive correlation between interest and brand trust & 0.656 indicating highly positive correlation between feature and brand trust, finally the R square values for knowledge, interest & feature 0.287, 0.450 & 0.431 indicating that there is 28.7% impact of impact of knowledge on brand trust, 45.0% impact of interest on brand trust & 43.1% impact of feature on brand trust. Hence null hypothesis H02.2, H02.3 & H02.4 were can’t be accepted.
c. In the another regression found poor model fit indicating by F- value that is 0.574 which is insignificant at level of significance i.e. 0.449% and the value of T i.e. -0.757 which is also insignificant at the level of significance i.e. 0.449 indicating that there is negative impact of attention on brand trust. The value of R shown total correlation between attention and brand trust which is weak positive through this values 0.036 and R square values that is 0.001 it mean that there is 00.1% no impact of attention on brand trust. Hence null hypothesis H02.1 was can’t be rejected.
4.4.4. Multiple Regression Analysis between obtain factors of Online Advertising and Brands Trust
The regression was calculated by taking the total of all obtain factors of online advertising (separately) as independent variables and brands trust as a dependent variable by using SPSS software. The Stepwise method of regression is used.
|
Independent Variable(s) |
R Value |
R2 Value |
F Value |
t Value |
Beta Value |
Sig. |
|
Interest |
.671a |
.450 |
367.504 |
19.170 |
.671 |
.000a |
|
Interest + Feature |
.744b |
.553 |
277.053 |
21.208 |
.833 |
.000b |
|
Interest + Feature + Knowledge |
.766c |
.587 |
211.496 |
24.165 |
.925 |
.000c |
|
Interest + Feature + Knowledge + Attention |
.769d |
.591 |
161.417 |
21.915 |
.861 |
.000d |
|
Dependent Variable : Brand Trust |
||||||
|
Durbin Watson = 2.042 (between 1-3) = No Auto Correlation VIF Value under Control (1-10) & Tolerance (<1.00) = No Multi-Collinearity |
||||||
|
Method: Stepwise Method were used |
||||||
a. The value of r square for interest and brand image is 0.450 indicating that interest affected 45.0% on brand trust. T value i.e. 19.170 at the 0.00 level of significance indicating that there is positive impact of interest on brand trust.
b. The value of r square is 0.553 indicating that interest & feature both are affected 55.3% on brand trust. T value i.e. 21.208 at the 0.00 level of significance indicating that there are positive impact of both interest and feature on brand trust.
c. The value of r square i.e. 0.587 indicating that interest, features & knowledge all are affected 58.7% on brand trust. T value i.e. 24.165 at the 0.00 level of significance indicating that there are positive impacts of all are i.e. interest, feature & knowledge on brand trust.
d. The value of r square i.e. 0.587 indicating that interest, features, knowledge & attention all are affected 58.7% on brand trust. The T value is 24.165 at the 0.00 level of significance indicating that there are positive impact of all i.e. interest, feature, knowledge & attention all on brand trust.
4.4.5. Linear Regression Analysis between obtain factors of Online Advertising and Brands Affect
The regression was calculated by taking the total of all obtain factors of online advertising (separately) as independent variables and brands affect as a dependent variable by using SPSS software.
a. Main Null Hypothesis
H03: There is no impact of Online Advertising (i.e. Attention, Knowledge, Interest and Feature) on Brands Affect
b. Subsidiary Null Hypothesis
H03.1: It States there is no Impact of Attention on Brands Affect
H03.2: It States there is no Impact of Knowledge on Brands Affect
H03.3 It States there is no Impact of Interest on Brands Affect
H03.4: It States there is no Impact of Feature on Brands Affect
|
S |
Independent Variable(s) |
R Value |
R2 Value |
F Value |
t Value |
Beta Value |
Sig. |
Results |
|
1 |
Attention |
.576a |
.332 |
222.762 |
14.925 |
.576 |
.000b |
Null Rejected |
|
2 |
Knowledge |
.671a |
.450 |
367.504 |
19.170 |
.671 |
.000b |
Null Rejected |
|
3 |
Interest |
.023a |
.001 |
.240 |
-.490 |
-.023 |
.624b |
Null Accepted |
|
4 |
Feature |
.594a |
.353 |
244.745 |
15.644 |
.594 |
.000b |
Null Rejected |
|
5 |
All (Online Advertising) |
.708a |
.501 |
450.013 |
21.214 |
.708 |
.000b |
Null Rejected |
|
Dependent Variable : Brand Trust |
||||||||
|
Durbin Watson = 1.852(1), 1.633(2), 1.826(3), 1.787(4) & 1.729(5) (between 1-3) = No Auto Correlation VIF Value under Control (1-10) & Tolerance (<1.00) = No Multi-Collinearity |
||||||||
|
Method: Enter Method were used |
||||||||
a. The overall model found good fit indicating by F-test has tested through regression and value of F is 450.013 which is significant at 0.000% level of significance, and the value of T i.e. 21.214 also significant at the level of 00.000 level of significant indicating that there is positive relationship between online advertising and brand affect. The value of R shown total correlation i.e. 0.708 that is extremely positive correlation and R square value i.e. 0.501 indicating that 50.1% variance or 50.1% relationship between online advertising and brand affect. Hence null hypothesis H03 was can’t be accepted.
b. In the another regression found good model fit indicating by F- value which are 222.762 for Attention, 367.504 for knowledge and 244.745 for Feature which are significant at level of significance i.e. 0.000% for both for all three, and the value of T i.e. 14.925 for Attention, 19.170 for Knowledge and 15.644 for features, which are also significant at the level of significance i.e. 00.00, indicating that there are positive impacts of attention, knowledge, & features with brand affect. The value of R shown total correlation i.e. 0.576 indicating highly positive correlation between attention with brand affect, 0.671 indicating highly positive correlation between knowledge with brand affect & 0.594 indicating highly positive correlation between feature with brand affect, finally the R square values for attention, knowledge & feature i.e. 0.332, 0.450 & 0.353 indicating that there is 33.2% impact of impact of attention on brand affect, 45.0% impact of knowledge on brand affect & 35.3% impact of feature on brand affect. Hence null hypothesis H03.1, H03.2 & H03.4 were can’t be accepted.
c. In the another regression found poor model fit indicating by F- value that is 0.240 which is insignificant at level of significance i.e. 0.624% and the value of T i.e. -0.490 which is also insignificant at the level of significance i.e. 0.624 indicating that there is negative impact of interest on brand affect. The value of R shown total correlation between interest and brand affect which is weak positive through this values 0.023 and R square values that is 0.001 it mean that there is 00.1% no impact of interest on brand affect. Hence null hypothesis H03.3 was can’t be rejected.
4.4.6. Multiple Regression Analysis between obtain factors of Online Advertising and Brands Affect
The regression was calculated by taking the total of all obtain factors of online advertising (separately) as independent variables and affect image as a dependent variable by using SPSS software. The Stepwise method of regression is used.
|
Independent Variable(s) |
R Value |
R2 Value |
F Value |
t Value |
Beta Value |
Sig. |
|
Knowledge |
.671a |
.450 |
367.504 |
18.170 |
.671 |
.000a |
|
Knowledge + Attention |
.703b |
.494 |
218.698 |
18.227 |
.774 |
.000b |
|
Knowledge + Attention + Feature |
.716c |
.512 |
156.577 |
17.572 |
.813 |
.000c |
|
Dependent Variable : Brand Image |
||||||
|
Durbin Watson = 1.699 (between 1-3) = No Auto Correlation VIF Value under Control (1-10) & Tolerance (<1.00) = No Multi-Collinearity |
||||||
|
Method: Stepwise Method were used |
||||||
a. The value of r square for knowledge and brand affect is 0.450 indicating that attention affected 45.0% on brand affect. T value i.e. 18.170 at the 0.00 level of significance indicating that there is positive impact of knowledge on brand affect.
b. The value of r square is 0.494 indicating that knowledge & attention both are affected 49.4% on brand affect. T value i.e. 18.227 at the 0.00 level of significance indicating that there are positive impacts of both knowledge & attention on brand affect.
c. The value of r square i.e. 0.512 indicating that knowledge, attention & features all are affected on brand affect. T value at the 0.00 level of significance indicating that there are positive impact of knowledge, attention & feature all on brand affect.
4.4.7. Linear Regression Analysis between Online Advertising (Attention + Knowledge + Interest + Features) and Brands Awareness (Brand Image + Brant Trust + Brand Affect)
H04: There is no impact of Online Advertising (i.e. Attention, Knowledge, and Interest & Feature) on Brands Awareness (Brand Image, Brand Trust and Brand Affect)
|
Independent Variable(s) |
R Value |
R2 Value |
F Value |
t Value |
Beta Value |
Sig. |
|
Online Advertising (Attention + Knowledge + Interest + Feature ) |
.872 |
.760 |
1422.677 |
37.718 |
.872 |
.000b |
|
Dependent Variable : Brand Awareness (Brand Image + Brand Trust + Brand Affect) |
||||||
|
Durbin Watson = 1.938 (between 1-3) = No Auto Correlation VIF Value under Control (1-10) & Tolerance (<1.00) = No Multi-Collinearity |
||||||
|
Method: Enter Method were used |
||||||
a. In the this regression analysis found excellent model fit indicating by F- value that is 0.872 which is significant at 0.000% level of significance.
b. The value of T that is 37.718 which is also significant at the 00.000 level of significance indicating that there is strong positive impact of online adverting on brand awareness.
c. The value of R shown total correlation between online advertising and brand awareness which is positive through this r values 0.023
d. The R square value that is 0.760 it mean that there is 76.0% impact of online advertising on brand awareness. Hence null hypothesis H04 was can’t be accepted.
Regression Models
4.5. Conclusion
The core purpose of this study was to evaluate effectiveness of online advertisement in the market hence this exploratory study concluded that online advertisement are an effective tool of promotion in all market as it creates awareness and explore information regarding various products and services.
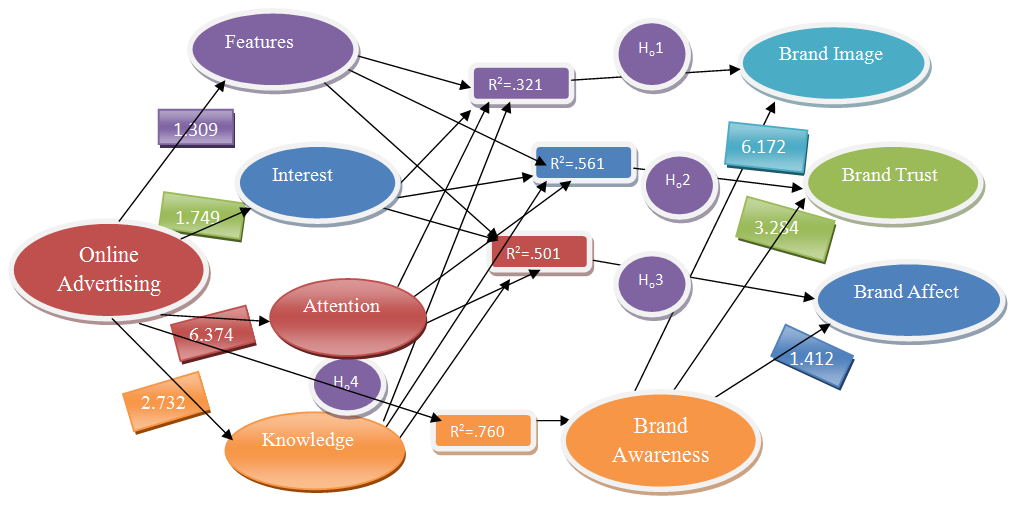
Approximating in all exploratory research in this study also objective has been perceptible after factor analysis. By which analysis revealed four factors of effectiveness of online advertisement in all market viz. Attention, knowledge, interest and features. Similarly three factors of brand awareness viz. brand image, brand trust and brand affect was well thought-out as a major factor of effectiveness of online advertisement and brand awareness.
The next objectives were to evaluate the cause and effect relationship was measured between the latent variables. The first and most important variable online advertising is an independent variable and brand awareness is dependent variable. Since calculated R square value is 0.760 it means impact of online advertising is 76.00% on brand awareness.
There are some subsidiary objectives were evaluate the causal effect relationship between obtain factor of online advertising and brand awareness, and found tremendous results through regression analysis. Attention as well as knowledge about products and service through online advertisements was affected brand image similarly knowledge, interest & feature all three through online advertising were created brand trust of advertised products and services last but not the least attention, knowledge & feature by using online advertising have positive relationship between brand affect.
Adams, C., Carroll, I., Sherman, S., & Ortiz, L. (2013). Effective Online Advertising: A Summary of best Practices, Resources and Creative Examples. Miles Marketing Destinations LLLP , 1-5.
Arslan, F. M., & Altuna, O. K. (2006). The effect of brand extensions on product brand image. Journal of Product & Brand Management Vol.19, No.3 , 170-180.
Bakshi, G., & Gupta, S. K. (2013). Online Advertising and Impact on Consumer Buying Behaviour. International Journal of Research in Finance & Marketing Vol 3 Issue 1 , 21-30.
De Chernatony, L., McDonald, M. H., & Wallace, E. (2010). Creating Powerful Brands. Routledge , 1-54.
Gao, J., Sheng, B., Chang, L., & Shim, S. (2003). Online Advertising - Taxonomy and Engineering Perspectives . San Jose State University , 1-33.
Hollis, N. (2005). Ten Year of Learning on How Online Advertising Builds Brands. Journal of Advertising Research 45(2) , 255-268.
Hooda, S., & Aggrawal, S. (2012). Consumer Behaviour Towards E-Marketing: A Study of Jaipur consumers. International Refereed Research Journal Vol 3 Issue 2(2) , 107-118.
Keisidou, E., Sarigiannidis, L., & Maditinos, D. (2011). Consumer Characteristics and their effect on Accepting Online Shopping, in the context of different product types. International Journal of Business Science and Applied Management Vol 6 I(2) , 31-51.
Larry, P., & Rossiter, J. R. (2006). A model of Brand Awareness & Brand Attitude Advertising Strategies. Psychology & Marketing Vol. 9, No.4 , 263–274.
Lee, H. M., Lee, C. C., & Wu, C. C. (2011). Brand image strategy affects brand equity after M & A. European Journal of Marketing, Vol. 45, No.7/8 , 1091-1111.
Li, N., & Zhang, P. (2002). Consumer Online Shopping Attitudes and Behaviour: An Assessment of Research. Americas Conference on Information Systems , 508-517.
Mohammed, A. B., & Alkubise, M. (2012). How do Online Advertisements Affects Consumer Purchasing Intention: Empirical Evidence from a Developing Country. European Journal of Business and Management Vol 4 No 7 , 208-219.
Nazir, S., Tayyab, A., Sajid, A., Rashid, H. U., & Javed, I. (2012). How Online Shopping is Affecting Consumers Buying Behaviour in Pakistan. IJCSI International Journal of Computer Science Issues Vol 9 Issue 3 No 1 , 486-495.
Puranik, R. (2003). Effectiveness of Internet Advertising. Institute of Management & Commerce Vol 1 Issue 1 , 1-5.
Ratliff, J. D., & Rubinfeld, D. L. (2011). Online Advertising: Defining Relevant Markets. Journal of Advertising Vol 1 no 2 , 1-23.
Soares, A. M., MinooFarhangmehr, & Shoham, A. (2007). Hofstede’s Dimensions of Culture in International Marketing Studies. Journal of Business Research, Vol.60, No.3 , 277-284.
Websites
www.google.com
www.amazon.in
www.scribd.com
www.snapdeal.com
www.homeshop18.com
>www.wikipedia.org
www.myntra.comp