Pacific B usiness R eview I nternational

A Refereed Monthly International Journal of Management Indexed With THOMSON REUTERS(ESCI)
|
Dr. Sasmita Giri Asst. Professor IFIM Bangalore |
Bitihotra Das Student IFIM Bangalore |
Sourav Kumar Hui Student IFIM Bangalore |
Kamini Kaushal Student IFIM Bangalore |
“When an unlisted company makes either a fresh issue of shares or companies promoters offer there holding of shares for sale or both for the first time to the public, it is called an IPO” (Company Law and Practice by Ratan Nolakha,2015). It also promotes investments activities in the economy. But it has been observed that in many countries/ companies the IPOs that they issue are mostly under-priced.
Under-priced may be defined as sell or offer at a lower price. In other words, it is the pricing of the initial public offering below the market value. When the offer price is lower than the first trade, then that stock is called or termed as under-priced. In other words, it leaves money on the table on the table which is considered as a loss of capital from the point of view of the company, but on the other hand it can be considered as a gain for the investors in the form of positive initial returns on the under-priced shares.It has been found that on IPO is offered to a large no. of investors so that they can become a part of the company’s shareholder family which also adds value to the company’s public profile by getting itself listed in a recognized stock exchange (NSE/BSE). The company which issues IPOs, it becomes a way for them to gather funds for the growth of their business. Basically, IPO brings high valuation, raises capital fund, and helps in developing and growth of a business of a company. The extant literature explained IPO as “Initial Public Offer (IPO) is considered as an investment tool for the stock market investor”( Rd. Sampada Kapse and Prof. Manju Rasinghan, 2013in their research paper “Indian IPOs: Under-Pricing and Market Efficiency”). As per another paper “IPOs are one of the largest sources of capital for the firms to invest in growth opportunities. It encourages investment activities in the economy by mobilizing funds from low growth opportunities to high growth opportunities ” (Neeta Jain and C Padmavathi,2012). Yet another definition of IPO as “Initial Public Offering (IPO) is the selling if securities to the public in the primary market” ( Amit Kumar Mishra, 2010)
An IPO is under-priced only when it is issued below the market price or in other words when the price of offerings of IPOs is lower than the price of the first day trade. Our research is why IPOs are under-priced. There have been various reasons, theories, which have been formulated by various researchers. In their research papers, we found that the reasons given for under-pricing of IPOs is basically the same one way or the other.
The main objective of this study is:
• To analyze IPO’s performance on the listing day.
• To figure out the relation between the condition of the market and underpricing of the IPO’s.
• To experiment whether the Efficient Market Hypothesis (EMH) of capital markets and underpricing is done at the end of the trading day.
• To identify the factors that affect IPO such as; issue price, issue size, over subscription, and market index returns.
IPOs are one the largest source of capital for firm to invest for growth opportunities. It encourages the activities of investments in the economy by mobilizing funds from low growth to high growth opportunities. Under-pricing may be defined as the pricing/selling of the IPOs at lesser price then the market value of the issue. It is different in each and, every companies also, it varies from market to market. Under-priced IPO leaves money on the table which leaves which is a cost for company (loss of capital) but it becomes a gain for the initial investor which becomes an initial return of the under-priced shares.
It has been found that the IPOs are under-priced in most of the countries/companies. On one hand, the tendency of high under-pricing in the primary market discourages IPOs issued by those companies which cannot afford or do not want under-pricing or do not want to leave money on the table. As the investors are uninformed, the company decide to under-price IPOs to attract the new investors regarding the quality of the market.
Baron (1982) explains two reasons of under-pricing of the IPOs. One is asymmetry between issuer and the investment banker.
• An investment banker knows better about the capital market than the issuer. Therefore, the issuer offers incentive to investment banker with the price which is lower than the first best offer price, for revealing its superior information about the capital market. Thus, information asymmetry between issuer and banker causes underpricing of new issue.
• Another reason for two underpricing of IPOs is that the issuers are more uncertain about the market demand of the unseasoned issue for the seasoned issue. The need for bankers’ information about the market situation increases in the new issues & hence the issuers’ willingness to accept underpricing for new issues is very much high.
Offerings of initial public offerings in French Market appear to follow a “boom of bust” cyclical pattern in recent decades, not only in the United States, but also in virtually all countries. In hot markets issuer, wants to get through the window at the same time. In the cold markets, on the other hand, it is sometime difficult for issuers to sell stock at any reasonable price. There are three selling mechanisms available in French Market. One is the book building mechanism used in the U.S. Other is a fixed price procedure. The third one is an auction procedure (Neeta Jain, C Padmavati 2012).
In May 1992, Capital Issue Control Act, 1947 was abolished and Security Exchange Board of India (SEBI) was established under SEBI Act, 1992. Under the Capital Issue Control Act, Controller of Capital Issue, and quality of disclosure controlled pricing of new issues was very poor. Before 1995, only fixed price method was allowed for IPO’s. However, it faced two drawbacks.
• Uncertainty about the time taken in completion of the issue process.
• High Under-pricing of the issue.
Therefore, in most of the countries, IPO’s are issued through the book building process mechanism of pricing. Several empirical studies have reported that IPOs achieve sizeable average returns over very short periods, suggesting that offerings might be under-priced.
Under-pricing indicates the positive initial returns over the offer to listing dates of the new issues. Due to this problem, the uninformed investors will try to exit the market unless they find issues of under-priced IPOs are available on average to recompense them for their informational handicap. Under-pricing over the years has created a good impression in investors’ minds, which helps the firm to sell the subsequent seasoned equity offerings (SEOs) at attractive prices. Low-quality firms are deterred from mimicking the high-quality firms because, they are less likely to reap the benefits of IPO under-pricing by selling their seasoned issues at higher prices. (Neeta Jain, C Padmavati 2012).
A great amount of research had been carried out in India as well as internationally to evaluate the under-pricing phenomenon of IPOs. IPOs earns more than 40% at the market index on the first 200 trading days. These sharp excess returns are mostly reversed in the shorter of six calendar months (Shah 1995). During the initial period, and especially during the five trading days, mispriced assets are likely to exists (Garg A., Arora P., SinghlaR 2008) also support that IPOs earn medium to high exists in Indian Stock Market and the effect of various market conditions on level of pricing.
The determinants of IPO performance were discussed and argued that pricing strategies influences the IPO Initial returns: if the offering is preceded by book building, the under-pricing is significantly lower as compared to fixed price offerings (Alosio R, Giudici., Paleari S).Researcher had investigated empirically the difference in IPO under-pricing between different countries and the influence of investors protection on the under-pricing of IPOs. On average, a country with stronger minority protection has a lower level of under-pricing. There is also a negative correlation between level of under-pricing, quality of general level system and effectiveness of legal enforcement. The level of under-pricing decreases with stronger investor protection. (Peter-Jan Engelen, Marc van Essen 2007)
Generally, it is believed that IPO under-pricing has increased over the time. The increase can be attributed to the changing composition of the universe of firms going public. Most of the increase, however, is not attributable to changes in the risk of the firms going public. Underwriters wish to get the issue fully subscribed that leads to greater under-pricing. This accounts for most of the increase in under-pricing over time (Loudhran, Ritter 2002).
|
Table 1: List of IPOs of UK during 1995 to 2017 |
|||
|
Year |
No of companies |
Market Value(in£m) |
New money raised(in£m) |
|
1995-1999 |
382 |
26560.84 |
10449.86 |
|
2000-2004 |
874 |
79747.42 |
33327.72 |
|
2005-2009 |
827 |
88165.37 |
41197.67 |
|
2010-2014 |
376 |
121804.99 |
39963.53 |
|
2015-2017 |
167 |
42041.12 |
11505.60 |
(Source: www.nyse.com)
|
Table 2:List of IPOs in India during 1989 to 2017 |
||
|
Year |
Issue Amount (Rs.in crs.) |
No of Issues |
|
1989-1993 |
₹ 21,844.00 |
1811 |
|
1994-1998 |
₹ 27,659.00 |
3502 |
|
1999-2003 |
₹ 25,283.00 |
206 |
|
2004-2008 |
₹ 1,24,354.00 |
327 |
|
2009-2013 |
₹ 1,66,652.00 |
264 |
|
2014-2017 |
₹ 1,24,890.00 |
230 |
(Source: www.primedatabase.com)
The theory of efficient market was formulated by Eugene Fama in his paper “Efficient Capital Market”. In this research paper, he made a synthesis of previous research regarding the predictability of capital markets. He said that “The ideal market is a market where firms can make production investment decisions and investors can choose among the securities that represent ownerships of the firms’ activities under the assumption that security prices at any time fully reflect all available information.The core concept of efficient capital market theory is that all information should be available to the investors and market participant, so stock prices should always reveal all the relevant information. The concept of the efficiency of capital market can be divided into three categories. (Eugene Fama)
· Allocation efficiency
· Operational efficiency
· Informational efficiency
Allocation efficiency states that the optimal allocation of resources according to Pareto optimality concept (Pareto efficiency, also known as "Pareto optimality," is an economic state where resources are allocated in the most efficient manner, and it is obtained when a distribution strategy exists where one party's situation cannot be improved without making another party's situation worse.) and it is established in such a way so that it is equivalent to the marginal rate of returns, adjusted for risks, respect to all market participants. (Eugene Fama)
Operational efficiency is the market condition where all market participants execute transactions and receive services at a price which is equal to the actual costs provided to them.
Informational efficiency is the situation where the prices of the stock fully reveal the information regarding to the financial assets and characteristics of the market. In other words, informational efficiency is defined as the speed and accuracy with which prices reflect additional information.
Fama also classifies market efficiency into three forms – weak, semi - strong and strong. In its weak form efficiency, the return on are not correlated and have a constant mean. In this efficiency, the current prices fully reflect all relevant information which contains all historical prices of the assts. A market will be semi strong when the stock price reflects any newly relevant information instantaneously. The strong form of efficiency states security prices will reflect all relevant and available information, even the private ones. (Eugene Fama)
In a study to find out the market efficiency of equity markets in India, we always take two stock exchanges – BSE and NSE. BSE market is one of the oldest market India and has the longest data series available whereas the NSE is the new one. The motive of establishing NSE in India was to provide a better functioning market for the investors. And with the support of the government, NSE is becoming one of the fastest and accessible market to domestic & foreign market.
The understanding of efficiency of the capital markets will have an impact on the invest policy of the investors. The prices of the assets reflect a market’s best estimate on risk and expected return of the assets for an efficient market. The understanding of efficiency of the emerging market is becoming more important as the integration with more developed markets and free movement of investments across national boundaries. Traditionally more developed market of Western Equity markets is considered to be more efficient. (Rakesh Gupta; K. Basu, 2007)
Research Gap
The existing literature provides information and base to the current study. However, there
are a few research problems that have not yet been addressed? As the study is basically all about IPO Under-pricing. These studies suffered the following limitations:
· The period which was considered previously were very short.
· Sufficient data was not availableand it was not possible to come up with the conclusion whether IPOs are under-priced or overpriced.
Data: The data has been collected by from Chittorgarh.com, NSE (National Stock Exchange) and Yahoo Finance.
Period: The data is collected for a period of 10 years to get a wider scope whether IPOs are under-priced or overpriced.
Table 3 – Data for IPO issue over 10 years
|
Year |
No. of Issue |
|
2008 |
30 |
|
2009 |
21 |
|
2010 |
62 |
|
2011 |
36 |
|
2012 |
11 |
|
2013 |
3 |
|
2014 |
5 |
|
2015 |
21 |
|
2016 |
26 |
|
2017 (till 31st March) |
4 |
|
Total |
219 |
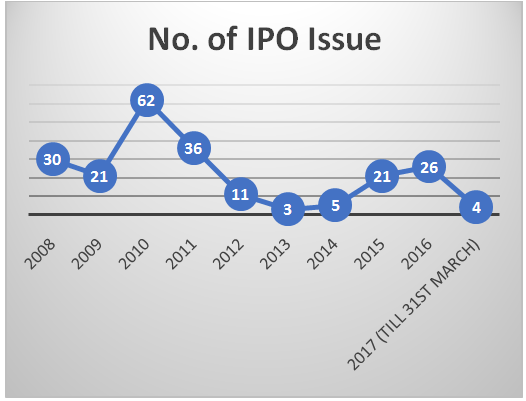
Data Source: https://www.chittorgarh.com
Techniques of Analysis
For those 10 years offer price, open price and close price of the sample IPOs were obtained. The closing data of the Sensex for open day and offer day was obtained to evaluate the under-pricing of an IPO, 1st day return or market return.
The first day performance of IPO listing was measured by taking the difference between the closing market price of the IPO on first trading day and the company’s offer price. To find the under-priced shares for the 1 st trading day the following formula was used:
UPi_P=(Pli-POi)
UPi_P= Under-pricing of Share
Pli = Closing Price of Security on first trading day
POi=Offer price of security i
The formula is used to find out whether the security is under-priced or appropriately priced or overpriced.
UPi_P If is positive = under-priced
UPi_P is negative = overpriced
UPi_P is zero = appropriately priced
Relation between the market condition and the under pricing
The situation may arise that the IPO is giving high return on the listing day because the overall market is in increasing trend. To control this increase in market effect, the use of MAAR (market adjusted abnormal return) is calculated.
MAARi =Ri-Rm
MAARi = return on the security i.e. UPi_P
Rm = return on market i.e. (closing sensex on first day- closing sensex on offer day)/ closing sensex on offer day.
Market is efficient and under-pricing is taken away by the end of the day
To examine the efficiency in the market is by observing the relation between the share prices from offer to open and open to close. If the offer price will be equal to open price then market is inefficient as the process of arbitrage would eliminate any risk-free profits. Absolute prediction error is calculated as,
Absolute prediction error=(OPM-OP)/OP
OPM = Opening Market Price on Listing
OP = Offer price of security i
If absolute prediction error is 0 then valuation method is accurate, there is a chance that investor may earn extraordinary profits. Apart from this relative return of offer to close, offer to open, and open to close was calculated for the analysis.
Findings
Under-pricing in years 2008-2017: From year 2008-2017 there were 134 securities which were under-priced from 219 securities issued.
Table 4
IPO Under-pricing
|
Year |
No. of Issue |
Under-priced Shares |
|
2008 |
30 |
17 |
|
2009 |
21 |
13 |
|
2010 |
62 |
40 |
|
2011 |
36 |
17 |
|
2012 |
11 |
6 |
|
2013 |
3 |
1 |
|
2014 |
5 |
4 |
|
2015 |
21 |
13 |
|
2016 |
26 |
20 |
|
2017 |
4 |
3 |
Table 5
|
VALUES |
Year |
Offer Price Per Share (OP) |
Open Market Price Per Share (OPM) |
Closing Market Price Per Share (CPM) |
Under-Pricing Per Share (UP) |
Up Ratio (UP/OP) |
Up Based on Market Adjusted Return (MAAR) |
|
MEAN |
2008 |
207.13 |
221.7 |
234.44 |
27.31 |
0.1356 |
0.18 |
|
2009 |
183.14 |
185.23 |
202.17 |
19.03 |
0.0974 |
0.0734 |
|
|
2010 |
207.97 |
235.17 |
242.8 |
34.84 |
0.1335 |
0.1272 |
|
|
2011 |
101 |
104.73 |
111.79 |
10.79 |
0.0468 |
0.0574 |
|
|
2012 |
264.36 |
313.94 |
303.14 |
38.77 |
0.0423 |
0.0449 |
|
|
2013 |
304 |
323.67 |
325.85 |
21.85 |
0.0221 |
0.4378 |
|
|
2014 |
225.2 |
251.77 |
241.04 |
15.84 |
0.2831 |
0.2498 |
|
|
2015 |
327.57 |
363.51 |
373.57 |
46 |
0.1068 |
0.123 |
|
|
2016 |
405.46 |
457.93 |
469.35 |
63.89 |
0.1329 |
0.1329 |
|
|
2017 |
398.5 |
491.85 |
516.15 |
117.65 |
0.3679 |
0.3499 |
|
|
MEDIAN |
2008 |
173.05 |
175.03 |
177.1 |
5.68 |
0.03 |
0.06 |
|
2009 |
100 |
102 |
100.75 |
5.75 |
0.057 |
0.0169 |
|
|
2010 |
134 |
143.05 |
163.15 |
10.05 |
0.0735 |
0.0774 |
|
|
2011 |
83.5 |
85 |
78.83 |
-1.875 |
-0.075 |
-0.021 |
|
|
2012 |
135 |
135.5 |
149 |
0.6 |
0.0109 |
0.0249 |
|
|
2013 |
210 |
216 |
205.25 |
-4.75 |
-0.0226 |
-0.0156 |
|
|
2014 |
153 |
180 |
171 |
31.75 |
0.2608 |
0.1147 |
|
|
2015 |
250 |
291 |
293.3 |
6.85 |
0.3058 |
0.0427 |
|
|
2016 |
327.5 |
379.5 |
372.5 |
29.9 |
0.14 |
0.13 |
|
|
2017 |
396.5 |
482.5 |
525.35 |
106.48 |
0.25 |
0.22 |
|
|
MAX |
2008 |
765 |
1044 |
908.2 |
254.35 |
1.5957 |
1.5223 |
|
2009 |
1050 |
1019 |
1140.55 |
96.05 |
1.2925 |
1.3457 |
|
|
2010 |
1310 |
1655 |
1709.4 |
399.4 |
1.0398 |
0.9818 |
|
|
2011 |
256 |
261.5 |
411.65 |
201.65 |
1.535 |
1.4452 |
|
|
2012 |
1032 |
1387 |
1297.05 |
265.1 |
0.2568 |
0.2922 |
|
|
2013 |
530 |
590 |
611.45 |
81.45 |
0.1536 |
0.1861 |
|
|
2014 |
645 |
585 |
566.4 |
75.45 |
0.6755 |
0.6521 |
|
|
2015 |
1050 |
1380 |
1381.45 |
331.45 |
0.4984 |
0.4928 |
|
|
2016 |
896 |
1210 |
1178.3 |
302 |
0.59 |
0.55 |
|
|
2017 |
502 |
604.4 |
640.75 |
341.75 |
1.14 |
1.12 |
|
|
MIN |
2008 |
14 |
14.7 |
9.2 |
-77.5 |
-0.3945 |
-0.4042 |
|
2009 |
33 |
39 |
27.2 |
-31.9 |
-0.2906 |
-0.3089 |
|
|
2010 |
11 |
12.35 |
11.25 |
-96.75 |
-0.3721 |
-0.3923 |
|
|
2011 |
10 |
9.5 |
8.3 |
-94.15 |
-0.689 |
-0.751 |
|
|
2012 |
30 |
29.95 |
28.5 |
-28.8 |
-0.1309 |
-0.1339 |
|
|
2013 |
172 |
165 |
160.85 |
-11.15 |
-0.0648 |
-0.0391 |
|
|
2014 |
47 |
75 |
78.75 |
-78.6 |
-0.1218 |
-0.8421 |
|
|
2015 |
63 |
60 |
60.95 |
-57.85 |
-0.1763 |
-0.1681 |
|
|
2016 |
45 |
47.35 |
45.4 |
-66.55 |
-0.22 |
-0.24 |
|
|
2017 |
299 |
398 |
373.15 |
-84.1 |
-0.17 |
-0.17 |
For IPOs in year 2009 were on an average under-priced by Rs.19 per share or 9% if it is an unadjusted under-pricing and if market adjusted abnormal returns are used, under-pricing reduces to 7%.For IPOs in year 2010 were on an average under-priced by Rs.34 per share or 13% if it is an unadjusted under-pricing and if market adjusted abnormal returns are used, under-pricing reduces to 12%. For IPOs in the year 2011 were on an average under-priced by Rs.10 per share or 4% if it is an unadjusted under-pricing and if market adjusted abnormal returns are used, under-pricing increases to 5%. For IPOs in the year 2012 were on an average under-priced by Rs.38 per share or 4% if it is an unadjusted under-pricing and if market adjusted abnormal returns are used, under-pricing stays same i.e. 4%. For IPOs in the year 2013 were on an average under-priced by Rs.21 per share or 2% if it is an unadjusted under-pricing and if market adjusted abnormal returns are used, under-pricingincreases to 43%. For IPOs in the year 2014 were on an average under-priced by Rs.15 per share or 28% if it is an unadjusted under-pricing and if market adjusted abnormal returns are used, under-pricingreduces to 24%. For IPOs in the year 2015were on an average under-priced by Rs.46 per share or 10% if it is an unadjusted under-pricing and if market adjusted abnormal returns are used, under-pricing increases to 12%. For IPOs in the year 2016 were on an average under-priced by Rs.63 per share or 13% if it is an unadjusted under-pricing and if market adjusted abnormal returns are used, under-pricing stays same i.e. 13%. For IPOs in the year 2017 were on an average under-priced by Rs.117 per share or 36% if it is an unadjusted under-pricing and if market adjusted abnormal returns are used, under-pricing reduces to 34%.
To find out whether relation exists between the market condition and the under-pricing.
Table 6
|
Year |
Positive (Under-priced ) |
Negative (Overpriced) |
Appropriately Priced |
No. of Issue |
|
2008 |
17 |
12 |
1 |
30 |
|
Percentage |
56.66667 |
40 |
3.33333 |
100 |
|
2009 |
13 |
7 |
1 |
21 |
|
Percentage |
61.90476 |
33.33333 |
4.76190 |
100 |
|
2010 |
40 |
22 |
62 |
|
|
Percentage |
64.51613 |
35.48387 |
|
100 |
|
2011 |
17 |
19 |
36 |
|
|
Percentage |
47.22222 |
52.77778 |
|
100 |
|
2012 |
6 |
4 |
1 |
11 |
|
Percentage |
54.54545 |
36.36364 |
9.09091 |
100 |
|
2013 |
1 |
2 |
3 |
|
|
Percentage |
33.33333 |
66.66667 |
|
100 |
|
2014 |
4 |
1 |
5 |
|
|
Percentage |
80 |
20 |
|
100 |
|
2015 |
13 |
8 |
21 |
|
|
Percentage |
61.90476 |
38.09524 |
|
100 |
|
2016 |
20 |
6 |
26 |
|
|
Percentage |
76.92308 |
23.07692 |
|
100 |
|
2017 (till 31st March) |
3 |
1 |
4 |
|
|
Percentage |
75 |
25 |
|
100 |
3 IPOs in the year 2008,2009 and 2012 respectively were appropriately priced. The companies under-price their IPOs to know whether their company has the potential to raise the money from the public or not but it is harmful from the promoter’s perspective because promoters may lose the issue proceeds & net worth of the organization if the IPOs doesn’t work. Simultaneously a company Overprice their IPOs because they perceive that they have a good market goodwill and share so their IPO will be hit but it doesn’t happen every time. For overpricing the IPO, if it doesn’t work people will lose trust in the company and the initial investment of the investor in disintegrated.
It can be also interpreted that under-pricing percentage is 61% for the data taken from 2008-17 which is high than the overpricing percentage. Though many of the IPO performed exceptionally well even after being under-priced. When the Market recovered after 2008 recession under-pricing increased.
To test whether a market is efficient and under-pricing is taken away by the end of the day.
Table- 7
|
VALUE |
Year |
Offer to Close |
Offer to Open |
Open to Close |
|
MEAN |
2008 |
-14% |
-3% |
9% |
|
2009 |
-10% |
-2% |
8% |
|
|
2010 |
-13% |
-8% |
2% |
|
|
2011 |
-5% |
-2% |
1% |
|
|
2012 |
-4% |
-4% |
-1% |
|
|
2013 |
-2% |
-3% |
-1% |
|
|
2014 |
-28% |
-21% |
-3% |
|
|
2015 |
-11% |
-5% |
3% |
|
|
2016 |
-13% |
-9% |
1% |
|
|
2017 |
-37% |
-15% |
4% |
|
|
MEDIAN |
2008 |
-3% |
0% |
3% |
|
2009 |
-6% |
-4% |
-1% |
|
|
2010 |
-7% |
7% |
0% |
|
|
2011 |
8% |
-2% |
-12% |
|
|
2012 |
-1% |
-1% |
-3% |
|
|
2013 |
2% |
-3% |
-3% |
|
|
2014 |
-26% |
-24% |
-4% |
|
|
2015 |
-3% |
0% |
2% |
|
|
2016 |
-14% |
-8% |
-1% |
|
|
2017 |
-25% |
-18% |
6% |
Fair pricing of Initial Public Offerings (IPOs) is a pre-condition for overall allocation efficiency of the financial system. So, we can say that market is highly inefficient for investors who are taking risk and buying IPO at offer price or the price below it is getting negative returns, while those who are buying at a price higher than the offer price from the secondary market are getting good returns. It can be inferred that the investors who couldn’t take advantage of original subscription could have gained advantage by buying the shares at the listed price & holding the shares by end of the day.
Managerial Impact
Many academics have devoted their entire career life to study IPO under-pricing. That is, why do companies repeated do IPO Under-pricing? In LinkedIn’s case, the under-pricing was 100 percent more than the amount LinkedIn’s shares on the first trading day. Academics often say that I.P.O. under-pricing is ubiquitous. According to Professor Ritter, the average I.P.O. under-pricing in the United States was 14.8 percent from 1990 to 1998, 51.4 percent from 1999 to 2000 and 12.1 percent from 2001 to 2009.Over the last 50 years, I.P.O.’s in the United States have been under-priced by 16.8 percent on average. This translates to more than $125 billion that companies have left on the table in the last 20 years. I.P.O. pricing is also a worldwide phenomenon. In China, the under-pricing has been severe, averaging 137.4 percent from 1990 to 2010. This compares with 16.3 percent in Britain from 1959 to 2009. In most other countries, I.P.O. under-pricing averages above 20 percent.
Investment Banking Conflicts
The investment bank conflict theory is supported by Mr. Nocera who said that “Investment banks arrange for under-pricing as a way to benefit themselves and their other clients.” There is some mixed affirmation to support this argument. A number of papers said that investment banks do respond to appropriate incentives to reduce under-pricing. Higher I.P.O. commissions have been found to reduce under-pricing. At least one paper has found that under-pricing is reduced by more than 40 percent when an American bank and American investors are involved. This is attributable to the higher underwriting fees that American investment banks charge.
Managerial Conflicts
The managerial conflict theory states that “The primary cause of the IPO under-pricing is its management.” This theory assumes that excessive demand for I.P.O. shares is created by the management in order to ensure that management can sell their holdings after a contractual 180-day lockup for a higher price. Alternatively, management allows under-pricing to fortify that there are many purchasers of the shares. This means there are no large shareholders created by the I.P.O., shareholders who may be more encouraged to replace management. There is not much documentation to support either form of this theory.
Future Research
The study was aimed to evaluate the under-pricing of IPOs for 10 years approximately for Indian markets. Therefore, in future, analysis can be done for other countries to be more specific by referring to the global IPO issues in countries like USA, China, Japan, etc. and as well as for the time period of beyond 10 years like 20-30 years for better findings.
Conclusion
The paper mainly focuses on the under-pricing of especially Indian IPOs for 10 years. The study was done to find out the trend of under-pricing of Indian IPOs, relation between market condition and the under-pricing and market efficiency and under-pricing of IPOs. Under-pricing of IPO’s exist in the Indian Market. The market was never efficient as investors were not able to invest on the time of IPO issue. The results even showed that Indian IPOs gave excess abnormal return for the sample period taken.
Derrien, F., & Womack, K. L. (2016). Auction vs Bookbuilding and Control of Under-pricing in Hot IPO Markets , 31-61.
Ghosh, C., Petrova, M., & Pattanaopanchi, M. (2012). Does IPO Pricing Reflect Public Infromation? New Insighths from Equity Carve Outs.
Ghosh, S. (2004). Revisiting IPO Under pricing in India .
Ghosh, S. (2005). Under-pricing of Initial Public Offerings: The Indian Experience.
Ghosh, S. (2012). Under-pricing of Indian IPOs: The Indian Experieence over the Last Decade .
Jain, N., & Padmavathi, C. (2012). Under-pricing of Initial Public Offerings in Indian Capital Market .
Kapse, S., & Raisinghan, M. (2013). Indian IPOs: Under-pricing and Market Efficiency.
Katti, S., & Phani, B. V. (2016). Under-pricing of Initial Public Offerings: A Literature Review .
Kumar, P., & Kumar, M. (2015). Study the Under-pricing and Pricing Mechanism of IPO used in BSE.
Mishra, A. K. (2010). Under-pricing of Initial Public Offerings in India: A Comparison of Book Building and Fixed price Offerings .
Mishra, A. K. (2012). Under-pricing of Indian Public Offerings in India .