Pacific B usiness R eview I nternational

A Refereed Monthly International Journal of Management Indexed With THOMSON REUTERS(ESCI)
|
Harpreet Mehton Research Fellow Punjab School of Economics Guru Nanak Dev University, Punjab, India. |
Dr. Sharanjit Singh Dhillon Professor Punjab School of Economics Guru Nanak Dev University, Punjab, India. |
The purpose of this paper is to empirically investigate the relationship among the economic growth, external debt and external debt servicing over the period 1979 to 2014with the addition of a fourth economic variable that is exports to analyse the export led growth hypothesis in India. The study employs statistical techniques such as Augmented Dickey-Fuller (ADF) and Phillips-Perron (PP) unit root tests to check the order of integration, Johansen cointegration test to examine the long run relationship and Granger causality technique to investigate the existence and direction of causality among the variables. The study exhibits that all the variables have same order of integration and are stationary at first difference which allows for Johansen cointegration test and the result of the test supports the absence of long run relationship among the variables. The Pair wise Granger causality test showed that unidirectional causality runs from GDP per capita to external debt and external debt servicing, export to GDP per capita which supports the export led growth (ELG) hypothesis and external debt to external debt servicing. Thus, the health of the economy determines the demand for external debt and also the ability of a country to service its debt. From the policy point of view, it is recommended that export earnings could raise the economic growth rate and reduce the reliance of the economy on external debt.
Keywords: External debt, Exports, Johansen Cointegration, Causality, Economic Growth, External Debt Servicing
JEL Code Classification: C22, F14, F34,F65
According to the World Economic and Social Survey, 2005 “External debt is meant to supplement and support developing countries’ domestic resource mobilization. However, since the nineteenth century, developing countries have experienced repeated episodes of rapidly increasing external indebtedness and debt-service burdens that have brought slower growth.” In general the debt is regarded unfavourable in most of the developing countries. Developed countries have the capacity to manage debt burden whereas developing countries encounter hanging situation.
The external debt and economic growth relationship has been debatable issue amongst the economists. Many economists gave importance to capital accumulation for steady economic growth in the developing countries. Capital accumulation can take place only if domestic saving rate is high, but these countries have low saving rate because of low per capita income. Additionally, developing countries exports are of low priced raw material and primary goods as compared to high priced imports that causes current account deficit. Developing countries were unable to maintain the required investment levels without external finance.
India stood at fifth position after Russian Federation, China, Turkey and Brazil among top twenty indebted developing countries during 2008(Global Development Finance, 2010). The share of concessional credit in India's external debt portfolio was the fourth highest after Pakistan, Indonesia and the Philippines. The analysis of trends since 1990s however shows that India's external debt position has improved significantly over time with debt-GDP ratio falling from 38.7 per cent in 1991-92 to 18.9 per cent in 2009-10and debt service ratio declining from 30.2 per cent to 5.5 percent (Ministry of Finance, 2010).
A Historical Picture of Indian Economy
The figure 1 indicates the India’s GDP, external debt, external debt servicing and exports from 1979 to 2014.Indian economy throughout the period 1972-89, was exposed to several types of internal and external shocks causing rise of external debt. The oil prices increase of late 1973 and 1974 imposed a severe blow to the Indian economy. The oil price increase of late seventies appeared at a time when India started to transfer from inward-oriented economic system to a more outward-oriented economic system during the period of 1980-85.The balance of payment crisis which started in 1985 became serious by the end of 1990.
During the early 1990s, India’s economy started to decelerate and was inflicted with growing inflation, unemployment, poverty and historically low foreign exchange reserves. The disintegration of the Soviet Union- India's main trading partner and a chief contributor of low price oil and the Gulf War , which caused a spike in oil prices, emerged in a major balance-of-payments crisis for India, which found itself experiencing the fear of defaulting on its loans. The Indian economy started improving(in terms of GDP and Exports) after the period 1991 with the introduction of economic reforms. India’s external debt over the period 1990-2010 reveals an improvement in India’s external debt situation. During 1992, total external debt to GDP ratio, which reached a top of 38.7 per cent recorded a continues slump of 18.9 percent by end of march 2010.Over the last two decades, external debt has increased in absolute terms, but the rise has not translated into higher debt burden. India’s external debt service payments continue to remain within manageable limits. (India’s External Debt: A Status Report 2009-10)
Figure 1
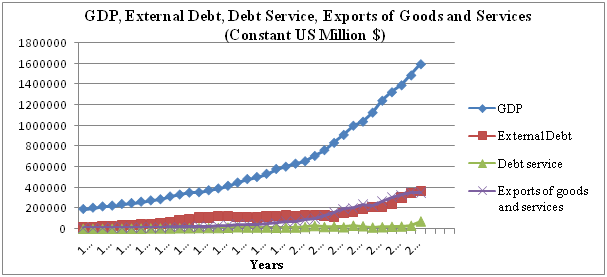
Source: World Development Indicators, World Bank
The present study has been undertaken to empirically investigate the relationship between the four macroeconomic variables namely GDP per capita, external debt, external debt servicing and exports. The study is planned in the following manner. The second section reviews the literature and third section comprises methodology and the fourth section presents the results and discussion and conclusion is presented in fifth section.
An extreme foreign indebtedness and low level of economic growth were noticed in most of the developing countries during the period from1980 to 1989. A large amount of literature is available on the problem of external indebtedness of the developing countries.
Pattillo, Poirson and Ricci (2001) employed a panel data for 93 developing countries (including India) from the period 1968 to 1998 and observed that when debt is at about 160–170 percent of exports and 35–40 percent of gross domestic product then the average impact of debt on per capita growth turns negative. The marginal impact of debt turns negative at about half of these values. Siddiqui and Malik (2002) estimated the effect of debt on GDP growth rate in South Asia and argued that debt and growth have an indirect relationship and this impact is positive up to a certain level and after the threshold level the relationship becomes negative. The study reported mixed support regarding the impact of debt on economic growth. Alfredo and Francisco (2004) detected that lower total external debt levels are linked with higher growth rate for Latin America and Caribbean countries. Loganathan, Sukemi and Sanusi (2010) examined the long-run and short-run causal relationship between external debt and macroeconomics performance of Malaysia for the period of 1988-2008. The study found that there is a significant long-run and short-run relationship between external debt and macroeconomics variables. Ezeabasili, Isu and Mojekwu (2011) investigated the relationship between external debt and economic growth of Nigeria from 1975 to 2006. The results revealed that external debt has negative relationship with economic growth. Rahman, Bashar and Dey (2012) explored the relationship between external debt and Gross Domestic Products for Bangladesh from the period 1972 to 2010. The results indicated the presence of long-run relationship between GDP and external debt. The Granger Causality test revealed that there exist feedback causality between GDP and external debt. Nawaz, Qureshi and Awan (2012) found that there is a long run relationship between external debt and economic growth feedback causality exist between external debt and economic growth in the short run for the Pakistan economy during the period 1980-2010.Nelasco(2012) found that the India was at the top position with nearly 62.07% of the total South Asian countries debt and stood at the 29th position in the world list of External borrowing during 2012. India was at the top with heavy borrowing and followed by the Pakistan in the region of South Asia. In case of total debt service, India was at the top followed by the Sri Lanka. In case of total External Debt as percent of exports of goods, services and income India had the lowest amount of debt followed by Bhutan. Saad (2012) revealed that both short run and long run relationships prevail among the variables economic growth, exports, external debt and exchange rate for Lebanon from the time period 1970-2010. Bashir et.al (2014) studied the impact of FDI, External Debt and Remittances on economic growth of South Asia and China from 1976 to 2011.The study found that external debt, remittances have positive relationship with economic growth but FDI has negative relationship with economic growth in the case of India. Shafi et.al (2015) investigated the relationship between debt and economic growth for Pakistan and India and found that Domestic debt variable has more impact on the GDP as compared to the foreign debt. Domestic debt has positive and statistically significant influence on GDP while foreign debt decreases the GDP as it has significant negative relation with GDP. The study shows that the utilization of debt during the period of 1990-2008 in India is larger than the Pakistan.
The study considers the annual series of Gross Domestic Product per capita (constant at 2005US$) as a dependent variable whereas the external debt, external debt servicing and exports (constant at 2005 US$) are used as independent variables. The study used the time series data for the period 1979to2014. The dataset used in this study is sourced from World Development Indicators (WDI).The nominal figures of external debt and external debt servicing are deflated by GDP deflator (2005). Before the analysis, all variables are transformed in the logarithm form to avoid the problem of heteroscedasticity.
Econometric Methodology
Unit Root Test
Stationarity of series is a precondition for almost all the econometric models. The present study uses Augmented Dickey-Fuller (ADF) unit root test to examine the stationarity of the data series. It consists of running a regression of the first difference of the series against the series lagged once, lagged difference terms and optionally, a constant and a time trend (Mishra, 2011). Augmented Dickey Fuller test is represented in the following equation:
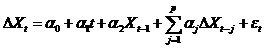
Where Xt denotes the variables gross domestic product per capita, external debt, external debt servicing and exports. Δ is the difference operator; α0, α1andα2, are parameters.
Phillips Perron Test
The Phillips and Perron (1988) test is employed to regulate the time series properties which provide another way to take care of serial correlation during investigating unit root of time series data. The ADF test adjusts the DF test to take care of possible serial correlation in the error terms of adding the lagged difference terms of the regress and. Phillips and Perron use nonparametric statistical methods to take care of the serial correlation in the error terms without adding lagged difference terms. Sincethe asymptotic distribution of the PP test is the same as the ADF test statistic (Gujarati and Sangeetha, 2010).
The Phillips-Perron test analyse through the following equation:
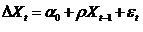
To control the impact of serial correlation on the asymptotic distribution of the test statistics the PP test examines the modified t-value related with estimated coefficient of ρ.
Johansen Cointegration test
Cointegration means that despite being individually non stationary, a linear combination of two or more time series can be stationary. Cointegration of two or more time series suggests that there is a long run or equilibrium relationship between them (Gujarati & Sangeetha, 2010). The Johansen approach to cointegration test is based on two test statistics, viz., the trace test statistic, and the maximum eigen value test statistic.
Trace Test Statistic
The trace test statistic can be specified as: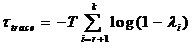
where λ i is the ith largest eigen value of matrix Π and T is the number of observations. In the trace test, the null hypothesis is that the number of distinct cointegrating vector(s) is less than or equal to the number of cointegration relations ( r ).
Maximum Eigen value Test
The maximum eigen value test examines the null hypothesis of exactly r cointegrating relations against the alternative of r + 1 cointegrating relations with the test statistic:
where is the ( r+1)th largest squared eigen value. In the trace test, the null hypothesis of r =0 is tested against the alternative of r +1cointegrating vectors (Mishra, 2011).
Granger Causality test
To explain how a time series is helpful to predict another time series, granger causality test was developed by Clive Granger in 1960. For instance, a time series X is considered to be granger cause Y, it implies that the past values of X are helpful to predict the values of Y, without using the past values of Y.
Granger causality test can be shown mathematically as follows:
yt = αiyt− i αjx t−j+ε1t
xt = αixt− i αjy t− j+ε2t
Here p denotes the maximum number of lagged the observations include in the model and the matrix “α” carries the coefficients of the model.
Stationarity Results
The null hypothesis in both ADF and PP test denotes the existence of unit root. Three models are observed for the ADF and PP tests: (i) Intercept without Trend (ii) Intercept with Trend (iii) without Intercept and Trend. Here the results of ADF and PP test are given with intercept model.
To examine the order of integration, Augmented Dickey Fuller test and Phillips-Perron test have been used for all the series. The ADF test results in Table 1 show that gross domestic product per capita (GDP), external debt(ED), external debt servicing (DS) and exports (X) are all stationary at their first difference because the ADF test statistics values are less than the critical values at 10%,5% and 1% levels of significance. Furthermore, the Phillips-Perron test outcome in Table 2 also confirms the presence of unit root in the level. All the series in our PP test are integrated of order one and hence in the favour of ADF test results.
Table 1
Augmented Dickey Fuller Test (ADF)
|
Variables |
ADF Statistics |
Critical Values |
Probability |
Conclusion |
||
|
1% |
5% |
10% |
||||
|
LGDPPC |
||||||
|
Level (with Intercept) |
3.12 |
-3.63 |
-2.95 |
-2.61 |
1.00 |
Do not Reject |
|
First Difference (with Intercept) |
-4.35* |
-3.64 |
-2.95 |
-2.61 |
0.00 |
Reject Null Hypothesis |
|
LED |
||||||
|
Level (with Intercept) |
-1.16 |
-3.63 |
-2.95 |
-2.61 |
0.68 |
Do not Reject |
|
First Difference (with Intercept) |
-4.27* |
-3.64 |
-2.95 |
-2.61 |
0.00 |
Reject Null Hypothesis |
|
LDS |
||||||
|
Level (with Intercept) |
-0.84 |
-3.63 |
-2.95 |
-2.61 |
0.80 |
Do not Reject |
|
First Difference (with Intercept) |
-6.16* |
-3.64 |
-2.95 |
-2.61 |
0.00 |
Reject Null Hypothesis |
|
LX |
||||||
|
Level (with Intercept) |
1.16 |
-3.63 |
-2.95 |
-2.61 |
0.99 |
Do not Reject |
|
First Difference (with Intercept) |
-4.69* |
-3.64 |
-2.95 |
-2.61 |
0.00 |
Reject Null Hypothesis |
* indicate 1% level of significance, ** indicate 5% level of significance and *** indicate 10 % level of significance
Table 2
Phillips-Perron Test (PP)
|
Variables |
Adj. t-Statistics |
Critical Values |
Probability |
Conclusion |
||
|
1% |
5% |
10% |
||||
|
LGDPPC |
||||||
|
Level (with Intercept) |
5.33 |
-3.63 |
-2.95 |
-2.61 |
1.00 |
Do not Reject |
|
First Difference (with Intercept) |
-4.33* |
-3.64 |
-2.95 |
-2.61 |
0.00 |
Reject Null Hypothesis |
|
LED |
||||||
|
Level (with Intercept) |
-1.07 |
-3.63 |
-2.95 |
-2.61 |
0.72 |
Do not Reject |
|
First Difference (with Intercept) |
-4.34* |
-3.64 |
-2.95 |
-2.61 |
0.00 |
Reject Null Hypothesis |
|
LDS |
||||||
|
Level (with Intercept) |
-0.68 |
-3.63 |
-2.95 |
-2.61 |
0.84 |
Do not Reject |
|
First Difference (with Intercept) |
-6.16* |
-3.64 |
-2.95 |
-2.61 |
0.00 |
Reject Null Hypothesis |
|
LX |
||||||
|
Level (with Intercept) |
1.16 |
-3.63 |
-2.95 |
-2.61 |
0.99 |
Do not Reject |
|
First Difference (with Intercept) |
-4.69* |
-3.64 |
-2.95 |
-2.61 |
0.00 |
Reject Null Hypothesis |
* indicate 1% level of significance, ** indicate 5% level of significance and *** indicate 10 % level of significance.
Cointegration Results
Given the results of unit root, Johansen (1988) technique is used to test the cointegration between variables. Prior to applying Johansen, it is necessary to determine the lag length of VAR. As Johansen technique is sensitive in selecting the lag length, the selection of lag is based on the minimum value of AIC (Akaike Information Criterion) and the optimum lag length is selected to be one.
Johansen cointegration results are presented in Table 3. Empirical results show that both the trace and maximum eigen value test statistics have their values less than the critical values at 5 percent level of significance. Thus the results of trace and maximum eigen value tests do not reject null hypothesis of no cointegration at 5% level of significance. So it can be concluded that there is no long-run relationship exist among the variables namely GDP per capita, external debt, external debt servicing and exports.
Table 3
Johansen Cointegration Test
|
Hypothesized No. of CE(s) |
Eigen value |
Trace Statistic |
0.05 Critical Value |
Prob.** |
|
None |
0.40 |
38.91 |
47.86 |
0.26 |
|
At Most 1 |
0.32 |
21.46 |
29.80 |
0.33 |
|
At Most 2 |
0.18 |
8.31 |
15.49 |
0.43 |
|
At Most 3 |
0.04 |
1.55 |
3.84 |
0.21 |
|
Hypothesized No. of CE(s) |
Eigen value |
Max-Eigen Statistic |
0.05 Critical Value |
Prob.** |
|
None |
0.40 |
17.45 |
27.58 |
0.54 |
|
At Most 1 |
0.32 |
13.15 |
21.13 |
0.44 |
|
At Most 2 |
0.18 |
6.76 |
14.26 |
0.52 |
|
At Most 3 |
0.04 |
1.55 |
3.84 |
0.21 |
* indicate 1% level of significance.
Granger Causality Test Results
Perusal of table 4 reveals that the null hypothesis that GDP per capita does not granger cause external debt and external debt servicing is rejected at 10% level of significance which point out to the presence of unidirectional causality from GDP per capita to external debt and external debt servicing. The past values of GDP per capita have a predictive capability in determining the present values of external debt and external debt servicing. Thus the economic condition of an economy determines the demand for external debt and also the ability of a country to service its debt. A country with high growth will be more capable to service its debt. Further the table shows the unidirectional causality runs from exports to GDP per capita at 5 percent level of significance which favours the export led growth (ELG) hypothesis and the outcome indicates that exports of goods and services supports the economy to receive more foreign currency to stimulate investment, which further generates more income and employment in the economy. Furthermore, unidirectional causality from external debt to external debt servicing at 1 percent level of significance in the case of India, which highlights that when debt surpasses a specified limit then debt servicing becomes a burden.
Table 4
Granger Causality Test
|
Null Hypothesis: |
Observation |
F-Statistic |
Probability |
Decision |
|
LED does not Granger Cause LGDPPC |
35 |
0.20 |
0.66 |
No Causality |
|
LGDPPC does not Granger cause LED |
3.86 |
0.06 |
Causality |
|
|
LDS does not Granger Cause LGDPPC |
35 |
0.00 |
0.93 |
No Causality |
|
LGDPPC does not Granger cause LDS |
4.05 |
0.05 |
Causality |
|
|
LX does not Granger Cause LGDPPC |
35 |
6.30 |
0.02 |
Causality |
|
LGDPPC does not Granger cause LX |
0.04 |
0.84 |
No Causality |
|
|
LDS does not Granger cause LED |
35 |
0.37 |
0.55 |
No Causality |
|
LED does not Granger cause LDS |
13.50 |
0.00 |
Causality |
The present paper takes an effort to investigate the short run and long run causal relationship among the economic growth, external debt, external debt servicing and exports in India during the time period from1979 to 2014.As concerns economic analysis, the ADF and PP tests is used to test for stationarity. After finding all of the time series variables to be stationary, Johansen cointegration method and Granger Causality test is applied for the long run and short run effects of economic growth, external debt, external debt servicing and exports. The outcome of the Johansen cointegration test reveals that there is no long run relationship between economic growth and other economic indicators. The Granger causality test shows the unidirectional causality runs from GDP per capita to external debt, GDP per capita to external debt servicing, export to GDP per capita, external debt to external debt servicing. The result of unidirectional causality from GDP per capita to exports and external debt servicing corroborates with the findings of the literatures of Ahmed et al (2000), Bashir et al (2014). Thus it can be concluded that causality running from economic growth to external debt means that higher growth stimulates the external debt to boost on-going development processes in the economy. So it is recommended that Focus should be made on efforts to manage the debt by using them in productive activities, increase the export earnings so that the economic growth will increase in the country which will eventually reduce the demand for further external debt. Secondly, export earnings are the most important source of foreign exchange that can be used to ease the pressure of balance of payment and reduce the impact of external shocks on domestic economy.
Abdullahi,Y. Z., Aliero,H. M. and Abdullahi, M. (2013). Analysis of the Relationship between External Debtand Economic Growth in Nigeria.Interdisciplinary Review of Economics and Management, 3(1), 1-11.
Ahmed, Q. M., Butt, M. S. and Alam, S. (2000). Economic Growth, Export, and External DebtCausality: The Case of Asian Countries.The Pakistan Development Review,39 (4), 591-608.
Alfredo, S. and Francisco, I. (2004). Debt and Economic Growth in Developing and IndustrialCountries. http://project.nek.lu.se/publications/workpap/Papers/WP05_34.pdf .
Awan, A., Asghar, N. and Rehman, H.(2011). The Impact of Exchange Rate, Fiscal Deficit and Terms of Trade on External Debt of Pakistan: A Cointegration and Causality Analysis.Australian Journal of Business and Management Research,1(3),10-24.
Awokuse, T.O. (2003). Is the Export-led Growth Hypothesis valid for Canada? Canadian journal of economics,36(1),126-136.
Awokuse, T.O. (2005). Exports, Economic Growth and Causality in Korea . Applied Economics Letters,12(11), 693-696.
Baharumshah, A. Z. and Rashid, S. (1999). Exports, Imports and Economic Growth in Malaysia: Empirical Evidence Based on Multivariate Time Series.Asian Economic Journal,13(4), 389-406.
Dickey, D.A. and Fuller, W.A. (1979). Distribution of the Estimators for Autoregressive Time-series with a Unit Root. Journalof the AmericanStatistical Association,74(366),427-431.
Erhieyovwe, E.K. andOnovwoakpoma, O.D.(2013). External Debt Burden and its Impact on Growth: An Assessment of Major Macro-Economic Variables in Nigeria.Academic Journal of Interdisciplinary Studies,2(2),143-153.
Ezeabasili, V.N.,Isu, H.O. and Mojekwu, J.N.(2011). Nigeria’s External Debt and Economic Growth: An Error Correction Approach . International Journal of Business and Management,6(5), 156-170.
Granger, C.W.J. (1969). Investigating Causal Relations by Econometric models and Cross Spectral Methods . Econometrica,37(3), 424-438.
Hameed, A.,Ashraf, H. andChaudhary, M.A. (2008). External Debt and its Impact onEconomic and Business Growth in Pakistan.International Research Journal of Finance and Economics, 20, 132-140.
Johansen, S. and Juseline, K.(1990). Maximum likelihood estimation andinference on cointegration with applications to the demand formoney.Oxford Bulletin of Economics and Statistics,52(2), 169- 210.
Loganathan,N.,Sukemi, M.N. and Sanusi,N.A.(2010). External Debt and Macroeconomics Performance inMalaysia: Sustainable or Not.Global Economy and Finance Journal, 3(2), 122 – 132.
Nawaz, M., Qureshi, M. and Awan, N.W. (2012). Does External Debt Causes Economic Growth: A Case Study of Pakistan. The Romanian Economic Journal,15(43), 131-144.
Patillo, C., Poirson, H. and Ricci, L. (2002). External Debt and Growth. IMF Working paper.http://www.imf.org.
Phillips, Peter, C.B. and Perron, P. (1988). Testing for Unit Root in Time Series Regression.Biometrika, 75(2), 335-346.
Rahman, M.M.,Bashar, M.A. and Dey,S.(2012). External debt and Gross Domestic Product in Bangladesh: A Co-integration Analysis.Management Research and Practice,4(4), 28-36.
Saad,W.(2012). Causalitybetween Economic Growth, Export and External Debt Servicing: The Case of Lebanon . International Journal of Economics and Finance, 4(11),134-143.
Siddiqui, R. and Malik, A.(2002). Debt and Economic Growth in South Asia . The Pakistan Development Review,40(4),677- 688.