Pacific B usiness R eview I nternational

A Refereed Monthly International Journal of Management Indexed With THOMSON REUTERS(ESCI)
|
Niyati Chaudhary Assistant Professor Department of Management Studies, PDMU Bahadurgarh, Jhajjar |
Foreign Direct Investment is a pool which minimize the gap of saving - investment. It is very important to fill the saving investment gap and export import gap, for a country like India. The main problem of India is deficit of savings which can be reduce by FDI. Integration of International Economic plays a very noteworthy role in the economy’s development. Foreign investments is needed for the sustainable GDP growth rate. The present Indian government has launched Make in India program to boost manufacturing sector for increasing output and employment opportunities in the country. Steps have been taken to incentivize domestic and foreign investors. The present study has focused on the trends of FDI Flow in India during 2000-01 to 2014-15. A comparison of different countries contribution to FDI inflows was also analyzed. FDI inflows in different sectors as well as distribution of the foreign investment in different states was also studied. To analyze all these objectives, data has been collected through secondary sources like reports and publication of Govt., Ministry of Commerce and Industry, Department of Industrial Promotion and Policy, Government of India, Reserve Bank of India, and World Investment Report. This research article is descriptive in nature.
Keywords - Foreign Direct Investments, Foreign Investors, Foreign Indirect Investment, Regional Distribution, Economic Growth.
FDI means any investment in a foreign country where the investing party retains control over the investment. Many countries offer many incentives for fascinating the foreign direct investment (FDI). Need of FDI depends on saving and investment rate in any country. Foreign direct investment (FDI) is a major source for the development of economy. It has an integral part of an effective international economic system. FDI can open up export markets, because of the marketing expertise, global contracts and outlets of parent firm. In the case of FDI, the risk of fluctuations in the value of currency is borne by the foreign investor. Developing economy are using FDI as the source of industrial technology, managerial expertise and marketing know-how for the growth, productivity and employment enhancement. They also liberalizing the regimes for the foreign investment in their country.
As India is a developing economy, it has one scare resource that is capital which is required for the development of the economy. Capital is restricted and there are numerous concerns such as Health, poverty, employment opportunity, education, R &D, technology obsolesce, global competition. The flow of FDI assist the economy in attaining the funds at cheaper cost, better technology, employment generation, and upgraded technology transfer, scope for more trade, linkages and spill overs to domestic firms.
The following opinions are advanced in favour of foreign capital.
1) Sustaining a high level of investment: Developing countries needed investment for the industrialization and develop themselves because the savings are very low due to low GDP and poverty. Therefore, there is a requirement for the investments for the filling the gap of the income and savings.
2) Technological gap: There is technological gap between the foreign and domestic technology in India. It can be filled only by the expert services, training of Indian personnel and educational, research and training institutions in the industry. One more option to fill only through private foreign investment or foreign collaborations.
3) Consideration the initial risk:There is high risk in the investing in developing countries. In developing countries mainly capital is a scare resource. There is also high risk in the investments in new ventures or projects for industrialization. Therefore foreign capital requires in these investments which require high risk.
4) Development of basic economic infrastructure: In the recent years foreign financial institutions and government of advanced countries have made substantial capital available to the under developed countries. There are special economic zones which have been developed by government for improvising the industrial growth.
5) Improvement in the balance of payments position: The inflow FDI will help in improving the balance of payment. Firms which feel that the goods produced in India will have a low cost, will produce the goods and export the same to other country. This helps in increasing the exports.
There are many studies which have identified technology, labour skills and infrastructure as the major determinants of foreign investment. These factors are very important to explain the trend and pattern of FDI inflows and outflows (Hummels and Stern, 1994).Wang & Swain (1995) found low cost labor to be an important factor in attracting FDI inflows. Root & Ahmed (1979) concluded that rate of growth of GDP, Quality of a country's telecommunication infrastructure and transport were more significant factors for attracting FDI inflows while Agodo (1978) found the opposite results for US investments in Africa as GDP growth rate was insignificant determinant. Wheeler and Mody (1992) found that market size is more important for developed countries, while per capita GDP is more important for developing countries. The establishment of property rights – in particular intellectual property rights – is crucial to attract high technology FDI (Smarzynska, 1999).
Peng Hu (2006) analyses various determinants that influence FDI inflows in India which include economic growth, domestic demand, currency stability, government policy and labour force availability against other countries that are attracting FDI inflows. He found that India has some competitive advantage in attracting FDI inflows, like a large pool of high quality labour force.Analyzing the new findings, it is observed that India has some competitive advantages in attracting FDI inflows, like a large pool of high quality labour force.
Sharma Reetu and Khurana Nikita (2013)studied sector-wise distribution of FDI inflow to know about which has concerned with the chief share, used a data from 1991-92 to 2011-2012 (post-liberalization period). In this study found that, Indian economy is mostly based on agriculture. So, there is a most important scope of agriculture services. Therefore, the foreign direct investment in this sector should be encouraged.
Laura Alfaro (2003) finds that FDI flows into the different sectors of the economy (namely primary, manufacturing, and services) exert different effects on economic growth. FDI inflows into the primary segment have a negative consequence on growth, whereas FDI inflows in the manufacturing sector a positive one. Evidence from the foreign investments in the service sector is ambiguous. Sebastin Morris (2004) has discussed the determinants of FDI over the regions of a large economy like India. He argues that, for all investments it is the regions of metropolitan cities that attract the bulk of FDI.FDI has empirically been found to stimulate economic growth by a number of researchers (Borensztein et al., 1998).
The present study has focused on the trends of FDI Flow in India during 2000-01 to 2014-15. A comparison of different countries contribution to FDI inflows was also analyzed. FDI inflows in different sectors as well as distribution of the foreign investment in different states was also studied. To analyze all these objectives, data has been collected through secondary sources like reports and publication of Govt., Ministry of Commerce and Industry, Department of Industrial Promotion and Policy, Government of India, Reserve Bank of India, and World Investment Report. This research article is descriptive in nature.
ANALYSIS AND INTERPRETATION:
Figure 1: COUNTRY WISE CONTRIBUTION OF FDI INFLOWS in period 2008-2017.
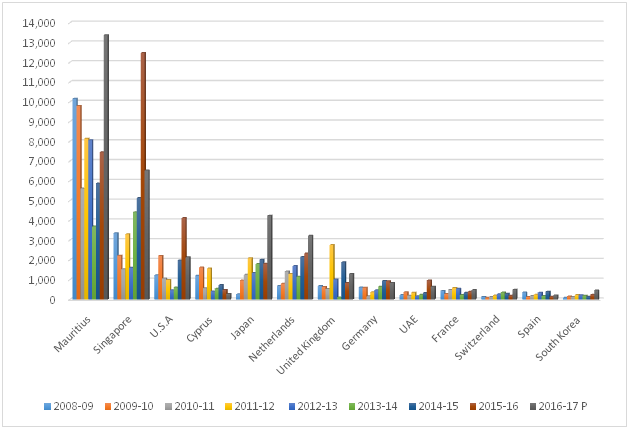
Source: Reserve Bank of India database
Figure 1 shows a comparison of the FDI inflows of different countries to Indian economy for the period of 2008-2017.In 2017, Mauritius has highest investment in the India’s FDI. Spain has lowest investment in Indian FDI inflow. In 2016, Singapore has highest inflow of the investments in FDI. USA, Japan, Netherlands, UK are the other countries which also taking more participate in the FDI in the India.
Figure 2 Distribution of FDI inflows in Different sectors of India.
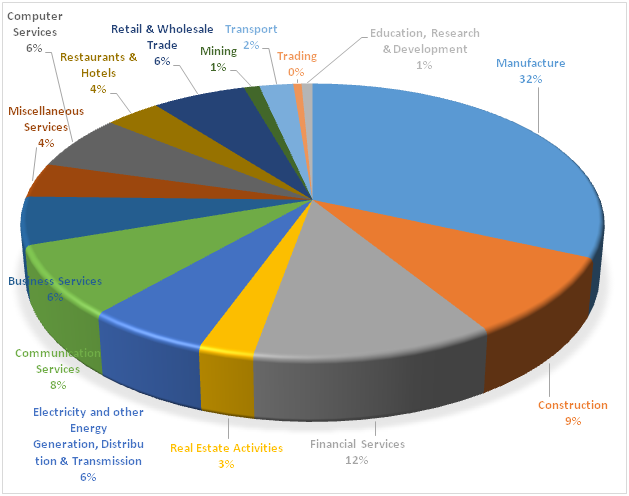
Source: Reserve Bank of India database
Distribution of FDI inflows in different sector of the Indian economy is shown in figure 2. In manufacturing sector the inflow of FDI was 32% while it was 12% in the financial services. In construction 9% and 8% FDI inflows in the communication services while 6% in the business services, computer services, wholesale and retail services and electricity and other energy generation, distribution and transmission.
Figure 3. Comparison of percentage growth of FDI inflows
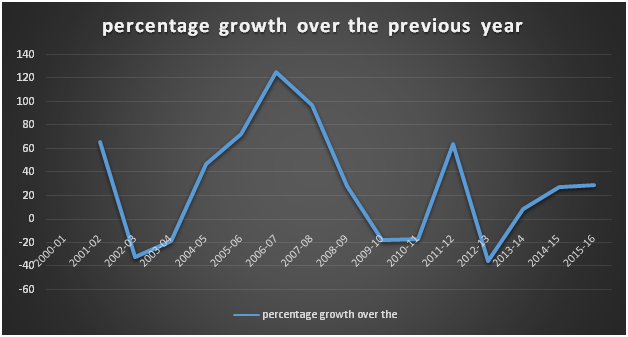
Source: Reserve Bank of India database
Figure 3 indicates the percentage growth of the FDI Inflows in India. The flows of FDI was fluctuated continuously. There was decline in the period of 2003-04 while in 2006-07 there was peak in the flow of FDI in India. As per trend it shows that the FDI will increase in future and fill the gap of saving investment. It also shows that the deficit of balance of payment will be minimized in future.
Table 1:RBI REGIONAL OFFICES (COVERED STATES) FDI EQUITY INFLOWS
(Financial year-wise) (From April 2000 to March 2016):
Amount Rupees in crores (US$ in million)
|
S. |
RBI‟s - Regional |
State covered |
2013-14 |
2014-15 |
2015-16 |
Cumulative |
%age to total |
|||||||||
|
Office 1 |
||||||||||||||||
|
No. |
( April - |
( April - |
(April,15 |
Inflows |
Inflows |
|||||||||||
|
March) |
March) |
– March , 16) |
(April ‟00 - |
(in terms |
||||||||||||
|
March „16) |
of US$) |
|||||||||||||||
|
1 |
MUMBAI |
MAHARASHTRA, |
20,595 |
38,933 |
62,731 |
415,753 |
29 |
|||||||||
|
DADRA & |
(3,420) |
(6,361) |
(9,511) |
(82,629) |
||||||||||||
|
NAGAR HAVELI, |
||||||||||||||||
|
DAMAN & DIU |
||||||||||||||||
|
2 |
NEW DELHI |
DELHI, PART OF |
38,190 |
42,252 |
83,288 |
332,312 |
22 |
|||||||||
|
UP AND |
(6,242) |
(6,875) |
(12,743) |
(62,154) |
||||||||||||
|
HARYANA |
||||||||||||||||
|
3 |
CHENNAI |
TAMIL NADU, |
12,595 |
23,361 |
29,781 |
118,547 |
7 |
|||||||||
|
PONDICHERRY |
(2,116) |
(3,818) |
(4,528) |
(21,542) |
||||||||||||
|
4 |
BANGALORE |
KARNATAKA |
11,422 |
21,255 |
26,791 |
108,912 |
7 |
|||||||||
|
(1,892) |
(3,444) |
(4,121) |
(20,241) |
|||||||||||||
|
5 |
AHMEDABAD |
GUJARAT |
5,282 |
9,416 |
14,667 |
68,464 |
5 |
|||||||||
|
(860) |
(1,531) |
(2,244) |
(13,285) |
|||||||||||||
|
6 |
HYDERABAD |
ANDHRA |
4,024 |
8,326 |
10,315 |
59,556 |
4 |
|||||||||
|
PRADESH |
(678) |
(1,369) |
(1,556) |
(11,571) |
||||||||||||
|
7 |
KOLKATA |
WEST BENGAL, |
2,659 |
1,464 |
6,220 |
20,847 |
1 |
|||||||||
|
SIKKIM, |
(436) |
(239) |
(955) |
(3,936) |
||||||||||||
|
ANDAMAN & |
||||||||||||||||
|
NICOBAR |
||||||||||||||||
|
ISLANDS |
||||||||||||||||
|
8 |
CHANDIGARH |
CHANDIGARH, |
562 |
234 |
177 |
6,538 |
0.5 |
|||||||||
|
PUNJAB, |
(91) |
(39) |
(27) |
(1,358) |
||||||||||||
|
HARYANA, |
||||||||||||||||
|
HIMACHAL |
||||||||||||||||
|
PRADESH |
||||||||||||||||
|
9 |
JAIPUR |
RAJASTHAN |
233 |
3,237 |
332 |
7,126 |
0.5 |
|||||||||
|
(38) |
(541) |
(50) |
( 1,315 ) |
|||||||||||||
|
10. |
KOCHI |
KERALA, |
411 |
1,418 |
589 |
6,739 |
0.5 |
|||||||||
|
LAKSHADWEEP |
(70) |
(230) |
(90) |
( 1,301 ) |
||||||||||||
The inflows of the FDI in the different regions of the India was shown in table 1. Which indicates that Mumbai has the maximum inflow of FDI in the period of April 2000- March 2016. New Delhi has 22% of the total inflow of the FDI while Chennai and Bangalore both has 7% of the Total FDI. Top 10 regions of the FDI inflow in the India was also shown in table 1. Chandigarh, Jaipur and Kochi has the minimum less than 1% flow of FDI.
Table 2. RBI’S FDI INFLOWS DATA AS PER INTERNATIONAL BEST PRACTICES (as per RBI’s monthly bulletin) :
|
S. No. |
Financial Year |
FOREIGN DIRECT INVESTMENT (FDI) |
||||||||||||||||
|
(April-March) |
||||||||||||||||||
|
Equity |
Re- |
Other |
FDI FLOWS INTO INDIA |
|||||||||||||||
|
invested |
capital |
|||||||||||||||||
|
FIPB Route/ |
Equity |
|||||||||||||||||
|
earnings |
+ |
|||||||||||||||||
|
RBI‟s |
capital of |
|||||||||||||||||
|
+ |
|
|||||||||||||||||
|
Automatic |
unincorporated |
|||||||||||||||||
|
Total |
||||||||||||||||||
|
Route/ |
bodies # |
|||||||||||||||||
|
Acquisition |
FDI |
|||||||||||||||||
|
Route |
Flows |
|||||||||||||||||
|
FINANCIAL YEARS 2000-01 to 2015-16 (up to March, 2016) |
||||||||||||||||||
|
1. |
2000-01 |
2,339 |
61 |
1,350 |
279 |
4,029 |
||||||||||||
|
2. |
2001-02 |
3,904 |
191 |
1,645 |
390 |
6,130 |
||||||||||||
|
3. |
2002-03 |
2,574 |
190 |
1,833 |
438 |
5,035 |
||||||||||||
|
4. |
2003-04 |
2,197 |
32 |
1,460 |
633 |
4,322 |
||||||||||||
|
5. |
2004-05 |
3,250 |
528 |
1,904 |
369 |
6,051 |
||||||||||||
|
6. |
2005-06 |
5,540 |
435 |
2,760 |
226 |
8,961 |
||||||||||||
|
7. |
2006-07 |
15,585 |
896 |
5,828 |
517 |
22,826 |
||||||||||||
|
8. |
2007-08 |
24,573 |
2,291 |
7,679 |
300 |
34,843 |
||||||||||||
|
9. |
2008-09 |
31,364 |
702 |
9,030 |
777 |
41,873 |
||||||||||||
|
10. |
2009-10 |
25,606 |
1,540 |
8,668 |
1,931 |
37,745 |
||||||||||||
|
11. |
2010-11 |
21,376 |
874 |
11,939 |
658 |
34,847 |
||||||||||||
|
12. |
2011-12 |
34,833 |
1,022 |
8,206 |
2,495 |
46,556 |
||||||||||||
|
13. |
2012-13 |
21,825 |
1,059 |
9,880 |
1,534 |
34,298 |
||||||||||||
|
14. |
2013-14 |
24,299 |
975 |
8,978 |
1,794 |
36,046 |
||||||||||||
|
15. |
2014-15 |
30,933 |
978 |
9,988 |
3,249 |
45,148 |
||||||||||||
|
16. |
2015-16 |
40,001 |
1,042 |
10,049 |
4,365 |
55,457 |
||||||||||||
|
|
||||||||||||||||||
|
CUMULATIVE TOTAL
|
290,199 |
12,816 |
101,197 |
19,955 |
424,167 |
|||||||||||||
Table 2 demonstrations that Equity flow from RBI automatic route/ FIPB route / Acquisition route was more than others. The flow from equity capital from uncorporated bodies was low in comparison to others. This indicates that the investors were invested more by the equity FIPB or RBI route in comparison to others route. The re-invested earnings was also used by the investors to invest in FDI. These two routes mostly used by the investors.
· Mauritius has highest investment in the India’s FDI. Spain has lowest investment in Indian FDI inflow.
· The volume of FDI Equity Inflow in All Sectors was US$ 37534.55 million in the period of April, 2015 to February, 2016. The top ten sectors in terms of the volume of FDI Equity Inflow were: Services Sector, Computer Software and Hardware, Construction (Infrastructure) Activities, Trading, Automobile Industry, Chemicals (other than Fertilizers), Hotel and Tourism, Telecommunications, Information and Broadcasting (including Print Media) and Drugs and Pharmaceuticals in the period of April, 2015 to February, 2016.
· In manufacturing sector the inflow of FDI was 32%. This sector has more share of FDI in comparison to other sectors.
· Education and R&D has less FDI share in comparison to other sectors.
· The flows of FDI was fluctuated continuously. It also shows that the deficit of balance of payment will be minimized in future.
· Mumbai and New Delhi has the more FDI flow in comparison to other regions.
· Destination wise, economically progressive states have concerned the share of FDI flows to India. The top six Indian states, viz ., Maharashtra, Delhi, Karnataka, Tamil Nadu, Gujarat and Andhra Pradesh composed accounted for over 70 per cent of FDI equity flows to India. Chandigarh, Jaipur and Kochi has the minimum less than 1% flow of FDI.
· The flow from equity capital from uncorporated bodies was low in comparison to others.
· This indicates that the investors were invested more by the equity FIPB or RBI route in comparison to others route.
Government must liberalize the FDI policy along with emphasis on integrity, transparency and responsibility. Indian economy is facing numerous challenges to fascinate more FDI. India scores poorly on the indices of comfort of doing business and corruption, infrastructure is deprived in contrast with most other competing economies. Foreign direct investment (FDI) inflows to India declined by 29 per cent to $26 billion in 2012 due to slow economic growth and high inflation. Mauritius has emerged as the most important source of FDI to India over the last decade.
. Agodo, O. (1978). The determinants of US private manufacturing investments in Africa. Journal of international business studies, 9(3) winter 95-107.
· Borensztein, E., DeGregorio, J. and Lee, J.W. (1998). How does foreign investment affect growth? Journal of International Economics, 45.
. Hummels, D.L. and Stern, R. (1994). Evolving Patterns of North American Merchandise Trade and Foreign Direct Investment, 1960 – 1990, The World Economy, January, pg 5-29. http://dx.doi.org/10.1111/j.1467-9701.1994.tb00806
· Laura Alfaro (2003). Foreign Direct Investment and Growth: Does the Sector Matter?, Working Paper Harvard Business School.
· Peng Hu (2006). India’s suitability for Foreign Direct Investment. Working Paper No.553, International Business with special reference to India, University of Arizona.
. Reserve Bank of India (2015), Monthly Bulletin, July.
. Root F.R. and Ahmed A.A. (1978). The influence of policy instruments on manufacturing direct investment in developing countries. Journal of international business studies, 9 winter 81-93.
· Sharma Reetu and Khurana Nikita (2013). Role of Foreign Direct Investment (FDI) in Different Sectors, International Journal of Advances in Management and Economics, Pp-14-19
· Sebastin Morris (2004). A Study of the Regional Determinants of Foreign Direct Investment in India, and the case of Gujarat, Working Paper No. 2004/03/07, Indian Institute of Management.
. Smarzynska, B.K. (1999). Composition of Foreign Direct Investment and Protection of Intellectual Property Rights in Transition Economies, unpublished working paper, New Haven: Yale University.
. Wang, Z. Q. & Swain, N.J. (1995). The determinants of foreign direct investment in transforming economies: empirical evidence from Hungary and china. Weltwirtsch Arch131(2):359-82.
. Wheeler, D. and Mody, A. (1992). International Investment Location Decisions: The Case of US Firms. Journal of International Economics , Vol. 33, No. 1/2, pp. 57-76.
http://www.economywatch/fdi
http://www.epw.com
http://www.imf.com
http://www.indiastat.com
http://www.isid.com
http://www.NCAER.com
http://www.rbi.co.in
http://www.proquest.uni.com.
http://www.ssrn.co.in