Pacific B usiness R eview I nternational

A Refereed Monthly International Journal of Management Indexed With THOMSON REUTERS(ESCI)
|
Dr. Ashok Kumar Gupta Lecturer (ABST) Govt. Commerce College, Kota (Raj.) |
Dr. Meenu Maheshwari Assistant Professor Deptt. Of Commerce and Management University of Kota, Kota (Raj.) |
Mrs. Sudarshana Sharma Research Scholar Govt. Commerce College, Kota (Raj.) |
Research Issue: Banks need to pay attention in evaluating and improving their performance continuously for increasing their market share and profitability and to survive in current competitive, challenging and changeable environment. Products and services are of intangible nature in banksthereforemeasuring performance on financial aspect as well as on Non-financial aspects is equally important. Balanced Scorecard is a strategic performance measurement and management system that helps to improve the planning, control and performance measurement functions of management accounting.
Research Objective: To evaluate and compare the performance of HDFC bank on four basic perspectives of Balanced Scorecard and other identified perspectives.
Method of Data Collection: Through Secondary sources which includes Annual reports, Sustainability reports, various websites, articles, journals, etc.
Tools & Techniques: Through Graphs, charts, percentages, mean, averages and standard deviation using MS-Excel.
Research Conclusion & Suggestions: It has been concluded that highly skilled and trained employees has resulted in improved operations of the HDFC bank. Bank has a responsible behaviour towards its stakeholders, society, and environment which has led the bank increase its customer base and high customer base has increases the business of bank. High growth in business has maintained the profitability of the bank in last five years. Performance evaluation on each perspective of Balanced Scorecard is necessary requirement for each bank so that the key areas for improvement can be identified and improved. It is suggested more studies are needed on comparative studies with others Indian banks based on BSC.
Keywords: Balanced Scorecard, Performance Measurement, Banks, Social & Environment.
To become the largest banking industry in the world, India’s banking and financial sector is expanding rapidly by incorporating the advanced technology in the industry like internet & Mobile devices to carry out the transactions and to communicate with masses and continuously improving customer experiences. Banking industry is challenged by competitive pressure from national and global banks, changes in customer preferences and loyalty, introducing new infrastructural and technological advancement, meeting stakeholder’s expectations, complying with stringent regulatory environment. All these factors pressurise the banks to pay attention in evaluating their performance by introducing new performance evaluation models and scientific techniques to streamline operations and improve processes and performance. A performance measurement system of a bank must be able to balance between the financial and non-financial measures, leading and lagging indicators, short term as well as long term objectives and supports management in predicting future fiscal performances in addition to highlight possible changes in operations to maintain congruence with the intended strategy. Balanced Scorecard is such a strategic performance measurement and management system that has gained a much focus over the last decades to improve the planning, control and performance measurement functions of management accounting.
The concept of Balanced Scorecard was introduced by Kaplan and Norton in a Harvard Business Review Article on “The Balanced Scorecard-Measures that Drive Performance” in 1992.According to Kaplan and Norton, “Balanced Scorecard is a business management concept that transforms both financial and non-financial data into a detailed roadmap that helps the organization measure its performance and meet long and short term objectives”. It translates mission and vision statements into a comprehensive set of objectives and performance measures that can be quantified and appraised. It is a method of identifying strategic objectives based on mission and vision of an organization and developing the key performance indicators based on financial, customer, internal processes and learning and growth perspective to transform a bank’s strategy into action and then evaluating the performance of an organization based on these indicators.
A series of articles, research papers, research thesis and reports on Balanced Scorecard have been written and gone through at national and international level both. This part of this paper attempts to review those studies, papers, articles etc. provided by different authors from time to time and to identify research gap in the field of Balanced Scorecard.
Vola, et al. (2009), in their paper on, “Performance Measurement under Balanced Scorecard: The case study of a Co-operative Credit Bank in Piedmont”, concluded that a control system is needed based on comprehensive framework that translates company’s strategy into a coherent set of performance measures for the bank. An empirical analysis through exploratory case study method has been conducted. They concluded that a logical model in strategic process is necessary in which a strategic map is designed and then the Balanced Scorecard is formalized in addition to the need of alignment of the organizational units.
Tekar et al. (2011) , in their article on, “Measuring Commercial Bank’s Performance in Turkey: A Proposed Model”, conducted an empirical research in Turkey to evaluate the financial performance of 13 commercial banks and ranked them for each year using a performance indexing approach from 2003-2010. Data has been collected from the web pages of Turkish Banks Association. The study concluded that non- financial performance measures have become more important in recent years for measuring overall performance of any firm and the inclusion of measures like higher customer satisfaction, effective management and leadership and using advanced technology in banking operations makes valuable contribution to the measurement of overall performance of banks rather than limiting the measures by financials only.
Amiri et al. (2012) , in their paper on “An Analytical Network Process Approach for Evaluating Banking Performance Based on Balanced Scorecard”, proposed an analytical network process approach for banking performance evaluation based on Balanced Scorecard. They concluded that this model can be a useful and effective assessment tool. It was found that more emphasis on financial factors and customer satisfaction must be given to improve banks performance. It was recommended to explore more cases and to conduct more empirical studies to further validate the usefulness of the proposed evaluation model.
Dave and Dave (2012) in their research paper on, “Applying Balanced Scorecard in Indian Banking Sector: An empirical study of the State Bank of India” concluded that being a part of the service sector, long-term strategic planning in a bank needs to concentrate on a comprehensive performance evaluation system. BSC emerges to be an efficient and all inclusive tool and encompassing various aspects of Banks performance. It is helpful in understanding the complementarities among various performance indicators for a bank and makes a strategy designing ad implementation process more efficient. Implementing BSC technique becomes complicated due to the difficulties in measurement of the intangible assets, existence of interrelations among these indicators, differences in the significance assigned to various indicators within the organization and trouble in setting the linkages between the employee’s performance and the reward mechanism. For the study, a balanced scorecard was constructed and performance of bank over twelve years from 1997 to 2008 was evaluated using 29 indicators of the banks.
Michael and Tobi (2014) , in their research paper on, “Performance Measurement in the United Kingdom (UK) retail banking industry”, found that the Balanced Scorecard, performance dashboards and use of financial measures are the three most common PMS utilized in UK retail banking industry. The data for the study was collected through a survey using questionnaire with a sample size of 15 retail banks of UK selected from multiple stage sampling method. Charts, percentage analysis, Wilcoxon signed rank test, Pearson Chi-square, kruskal wallis test and Mann-Whitney u test were utilized for analysis of data. It was observed that there are strong indicators as to a relationship between the PMS and the Bank’s strategy. No specific bank characteristic like age, base/ownership structure and market position shows a significant association with the PMS adopted in the banking industry. It is recommended that organisational strategies should be linked with the performance measures in order to develop an efficient PMS. This will increase its direct relationship with strategies, thereby improving its appropriateness within the industry. It is also needed for the UK banking PMS to account for more externalities and all stakeholders.
Shahroodi and Bahraloloom (2014) , in their article on , “Evaluating the Efficiency of Banking Industry by DEA: Balanced Approach”, used Balanced Scorecard Model to select the indicators and CCR Model to evaluate and ranked the 29 Sederat Bank branches in Gullian during a one year period (2010). To collect data for all indicators except customer satisfaction, bank data base has been used and questionnaire has been used for customer satisfaction data. It was found that 8 branches (40%) out of 29 branches were efficient with efficiency scores 1 in 2010 and the other branches with score between 0 to 1 were considered as in efficient.
Ibrahim and Murtala (2015 ), in their research study on, “The Relevance of Balanced Scorecard as a technique for Assessing Performance in the Nigerian Banking Industry”, examined the perceptions of banks on the relevance of BSC as a technique for assessing performance. A judgemental sampling technique was used to arrive at the sample of 11 banks out of 21 banks operating in Gombe State, Nigeria. The questionnaire was used as survey instruments for collection of data filled by banking executives from top management. Data was analysed through SPSS version 19.0 using mean rating, percentage score, Krusal Wallis Anova. The study concluded that there is recognition of the importance of using BSC by the management of Nigerian Banks for performance evaluation and the use of the full structure of BSC cannot be seen and this will jeopardized their performance measurement system.
Balkovskaya and Filneva (2016) , in their study on, “The use of the Balanced Scorecard in Bank Strategic Management”, constructed a strategy map of the BSC for banking institutions using the example of one of the Russian regional bank. On the basis of Mission and Strategic Vision of a sample bank KPI’s have been selected. A questionnaire was used to evaluate the mutual influence among KPI’s based on their own judgement. DEMATEL method was employed in order to identify causal relationship between the KPI’s. It was found that transaction efficiency, sales channel development and rationalised processes are three critical factors that need to be enhanced as they have high impact on bank’s performance. Automated processes as well as enhanced transaction efficiency help to optimize operations boosting the quality of customer service and therefore increase the number of customers. Developing remote banking channels leads to increase in profitability both directly (Cost Saving) and indirectly (Customer base expansion). It was recommended that BSC should be complemented with some other analytical tools like Analytical Hierarchy Process, Fuzzy Integral etc. to verify causal relationship among the performance indicators.
Hacioglu and Yuksel (2016) , in their paper on “Balanced Scorecard-Based Performance assessment of Turkish Banking Sector with Analytic Network Process” evaluated the performance of 33 deposit banks of Turkish through BSC using Analytic Network Process Approach and determined which perspective of Balanced scorecard are more significant with respect to the state banks, private banks and foreign banks. It was found that the financial perspective of BSC has the first rank with 65.7%, customer perspective is within the second rank with 22.1%, learning& growth perspective stays in the third rank with 6.3% and internal factors has the weakest importance with 5.9%. It was also found that state banks have the highest rank with 53.9% into bank ownership, private owned banks as the second with 36.1% and foreign banks as in the last order with 10% in performance based on balanced scorecard.
After reviewing the extensive literature on Balanced Scorecard with particular reference to banking industry, A Balanced Scorecard model is developed for sample bank.
A. OBJECTIVES OF THE STUDY: - The main Objectives of the study are:
1. To develop a Balanced Scorecard Model for Sample Bank.
2. To evaluate and compare the performance of HDFC bank during 2011-12 to 2015-16 based on Balanced Scorecard Model.
B. SAMPLE SIZE AND COLLECTION OF DATA:-
HDFC bank has been taken as a sample bank for the Study which is selected on the basis of highest market capitalization in Private Sector Banks. The data has been collected through secondary sources which include various publications of Annual reports and Sustainability reports of HDFC bank, various websites, journals etc.
C. TOOLS AND TECHNIQUES: Data has been analysed through Graphs, charts, percentages, mean, and standard deviation using MS-Excel.
D. SCOPE OF THE STUDY:-
The study covers a time period of five financial year from 2011-12 to 2015-2016.
E. HYPOTHESIS OF THE STUDY:-
H0 - There is no significant difference in the overall performance of HDFC Bank during the last 5 Years based on BSC.
H1 - There is a significant difference in the overall performance of HDFC Bank during the last 5 Years based on BSC.
F. LIMITATIONS OF THE STUDY
· The study is restricted to HDFC bank only.
· The study is based on secondary data only.
· Period taken for the study is limited.
· Tools and techniques used for analysing data are limited.
· Due to non-availability of data on few measures may affect the results.
HDFC BANK
The HDFC Bank was incorporated on August 1994 by the name of 'HDFC Bank Limited', with its registered office in Mumbai, India. As of March 31, 2017, the Bank had a nationwide distribution network of 4,715 branches and 12,260 ATM's in 2,657 cities/towns. The vision, mission and objectives of HDFC bank are as follows:
VISION&MISSION - To be a “World class Indian Bank” benchmarking itself against International Standards and best Practices in terms of product offerings, technology, customer service levels, risk management , audit and compliance.
OBJECTIVES - To continue building sound customer franchises across distinct businesses so as to be a preferred provider of banking services for its target retail and wholesale segments and to achieve a healthy growth in profitability consistent with the risk appetite.
STRATEGIC FOCUS AREAS -
1. Increase Market Share
2. Increase Geographical reach
3. Cross sell broad financial product portfolio across customer base.
4. Continue investment in technology to support digital strategy.
5. Maintain strong asset quality.
6. Maintain a low cost of funds.
7. Integrating Activities in community development, social responsibility with business practices and operations.
8. Ensuring the highest level of Ethical standards, professional integrity, corporate Governance and regulatory compliance. Based on above Vision, Mission and Strategic Objectives of HDFC bank, following BSC model for HDFC Bank has been developed and Performance has been measured during 2011-12 to 2015-16:
A. Measurement of Performance on Financial Perspective:- To measure and evaluate the performance of HDFC bank on financial perspective following measures (as shown in Table 1) have been selected based on strategic objectives of the bank:
|
Table1: HDFC Bank's Performance on Financial Perspective |
|||||||||
|
Strategic Objectives |
Measures |
Unit |
2015-16 |
2014-15 |
2013-14 |
2012-13 |
2011-12 |
Mean |
Std.Dev. |
|
Healthy Growth In Profitability |
Growth Rate of Profits (%) |
% |
20.36 |
20.49 |
26 |
30.18 |
31.61 |
25.291 |
5.262 |
|
Return on Assets (ROA) |
% |
1.92 |
2.02 |
2 |
1.9 |
1.77 |
1.920 |
0.099 |
|
|
Increasing Shareholder Value |
Return on Equity (ROE) |
% |
16.92 |
16.47 |
19.5 |
18.57 |
17.26 |
17.709 |
1.255 |
|
EPS |
48.84 |
42.15 |
35.47 |
28.49 |
22.11 |
34.083 |
10.613 |
||
|
Maintaining Liquidity |
Cash-Deposit Ratio |
% |
5.5 |
6.1 |
6.9 |
4.94 |
6.08 |
5.867 |
0.734 |
|
Credit-Deposit Ratio |
% |
85.02 |
81.08 |
82.49 |
80.92 |
79.21 |
81.721 |
2.170 |
|
|
Improving Asset Quality |
Net NPA's to Net Advances Ratio |
% |
0.28 |
0.25 |
0.27 |
0.2 |
0.18 |
0.233 |
0.044 |
|
Capital Adequacy |
Capital Adequacy Ratio |
% |
15.53 |
16.79 |
16.07 |
16.8 |
16.52 |
16.335 |
0.542 |
|
Improving Earning Quality |
Interest Income to Total Assets(Average) Ratio |
% |
9.27 |
8.96 |
9.22 |
9.5 |
9.06 |
9.200 |
0.208 |
|
NIM to Total Assets Ratio |
% |
4.25 |
4.14 |
4.14 |
4.28 |
4.19 |
4.200 |
0.064 |
|
|
Investment Deposit Ratio |
% |
33.13 |
35.13 |
32.93 |
37.68 |
39.51 |
35.585 |
2.874 |
|
Source: Compiled from Annual Reports & other reports of HDFC Bank from 2011-12 to 2015-16
Graphical Presentation:
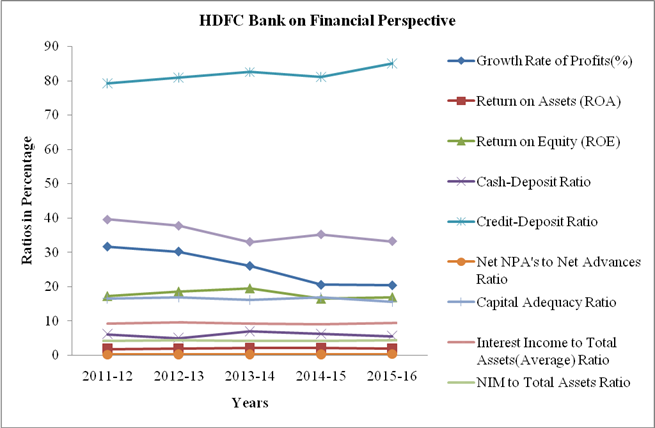
Chart 1
Interpretation and Analysis:
1. Growth rate of profits has been decreased to 20.36% in 2015-16 from 31.61% in 2011-12 which was less than the mean value of 25.29. Return on assets has been increased to 1.92% in 2015-16 from 1.77% in 2011-12. Return on equity has been volatile as it increased to 19.5% in 2013-14 from 17.26% in 2011-12 and then decreased to 16.92% in 2015-16. Earnings per Share have been increased just twice to ₹ 48.84 in 2015-16 from ₹ 22.11 in 2011-12. Overall HDFC bank has declining trend in growth rate of profits yet it has maintained a sustainable growth in profitability and also able to maintained its shareholder value.
2. The cash deposit ratio of bank has been declined to 5.5% in 2015-16 from 6.08% in 2011-12. Bank is maintaining sufficient cash as a proportion to its deposits. It implies that bank utilizes its funds properly and maintains sufficient liquidity to repay its deposits. The credit deposit ratio has increased from 79.21% in 2011-12 to 95.02% in 2015-16 which is above then the average of 81.74. It shows bank is lending more and more credit out of its deposits by maintaining sufficient funds.
3. The ratio of Net NPA’s to Net advances has been increased to 0.28% in 2015-16 from 0.18% in 2011-12. This increase may be due to increase in credit granted to customers or inefficiency and effectiveness of recovery department.
4. Capital Adequacy ratio has been declined to 15.53% in 2015-16 as it was 16.52% in 2011-12. Well this ratio is higher than the BASEL III norms which ask for 9% capital adequacy on regular basis. This is a good sign for the bank.
5. Interest Income to total assets (Average) ratio had a slightly volatile trend but it has been increased to 9.27% in 2015-16 from 9.06% in 2011-12. Net interest margin to total assets ratio has also been increased to 4.25% in 2015-16 from 4.2% in 2011-12. Bothe the ratio indicates the improved earning quality of bank.
6. Investment deposit ratio has a declining trend. It was 39.51% in 2011-12 and decreased to 33.13% in 2015-16. It shows that bank may have started creating more credit in open and private market which are more profitable and high risky as compared to investments in government securities, bonds or in any other form as provided by banking regulation act which are safe instruments and bears low risk.
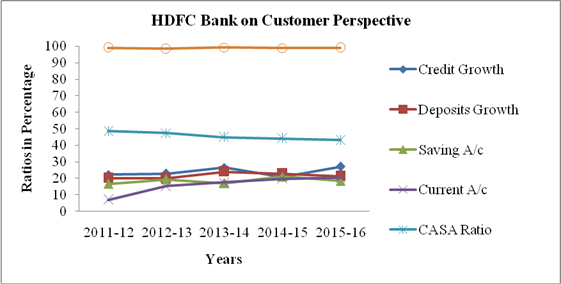
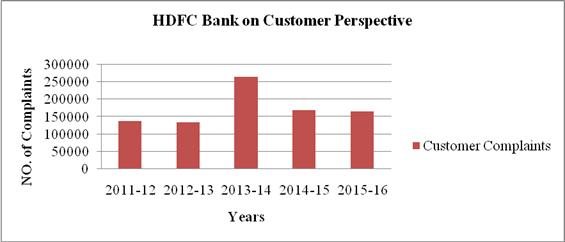
B. Measurement of Performance on Customer Perspective:- To measure and evaluate the performance of HDFC bank on Customer perspective following measures (as shown in Table 2) have been selected based on strategic objectives of the bank:
|
Table 2: HDFC Bank's Performance on Customer Perspective |
|||||||||
|
Strategic Objectives |
Measures |
Unit |
2015-16 |
2014-15 |
2013-14 |
2012-13 |
2011-12 |
Mean |
Std.Dev. |
|
Business Growth |
Credit Growth |
% |
27.1 |
20.63 |
26.4 |
22.7 |
22.15 |
23.664 |
2.812 |
|
Deposits Growth |
% |
21.2 |
22.72 |
24 |
20.1 |
20.1 |
21.571 |
1.708 |
|
|
Customer Growth |
Customer Growth |
In Million |
3.77 |
3.27 |
2.89 |
2.87 |
2.6 |
3.054 |
0.454 |
|
Saving A/c |
% |
18.4 |
21.1 |
16.9 |
19.2 |
16.6 |
18.369 |
1.831 |
|
|
Current A/c |
% |
20.2 |
19.6 |
17.5 |
15.2 |
6.9 |
14.869 |
5.390 |
|
|
CASA Ratio |
% |
43 |
44 |
44.8 |
47.4 |
48.4 |
45.474 |
2.292 |
|
|
|
|||||||||
|
Providing excellent after sales services |
Customer Complaints |
Nos. |
165369 |
168947 |
264401 |
135145 |
138769 |
- |
- |
|
Complaints Redressed Ratio |
% |
98.88 |
98.87 |
99.17 |
98.3 |
98.97 |
98.838 |
0.324 |
|
Source: Compiled from Annual Reports & other reports of HDFC Bank from 2011-12 to 2015-16
Graphical Presentation:
GRAPH 2 a
GRAPH 2 b
GRAPH 2 c
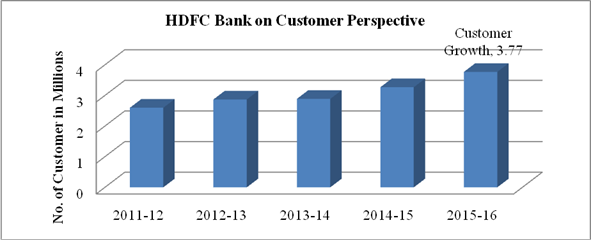
Interpretation and Analysis:
1. HDFC bank has a volatile trend in growth of both advances and deposits. Credit growth rate has been increased to 27.1% in 2015-16 from 22.15% in 2011-12. But it has been declined to 20.63% in 2014-15 from 26.4% in 2013-14. Deposits growth rate has been increased to 21.2% in 2015-16 from20.1% in 2011-12. During 2014-15 deposits has also declining trend from previous year. During the same period profits has also been declined. It shows that satisfied customers lead to high business growth and growth in business leads to High profits.
2. Saving a/c deposits has been increased to 18.4% in 2015-16 from 16.6% in 2011-12 but declined from 21.1% in 2014-15 and current a/c deposits has continuously increasing trend as it has increased to 20.2% in 2015-16 from 6.9% in 2011-12. Increase in current a/c deposits may be due to focus of bank on wholesale business segment market by providing them more conveniences in speed and frequency of transactions.
3. The customer base of HDFC bank has been increased from 26 Million in 2011-12 to 3.77 million customers in 2015-16. Continuous increase in customer base is an indicator of sustainable growth and development of a bank by providing better customer services, increased marketing efforts, introduction of innovative products & services, better infrastructural facilities etc.
4. Customer complaints have been decreased to 165369 in 2015-16 from 264401 in 2013-14. Complaints redressed ratio was consistent with mean of 98.84%. This can be said that bank is providing excellent after sales services to its customers that leads to reduction in customer complaints and high complaints redressed ratio.
C. Measurement of Performance on Internal Process Perspective:- To measure and evaluate the performance of HDFC bank on internal process perspective following measures (as shown in Table 3) have been selected based on strategic objectives of the bank:
|
Table 3: HDFC Bank's Performance on Internal Process Perspective |
|||||||||
|
Strategic Objectives |
Measures |
Unit |
2015-16 |
2014-15 |
2013-14 |
2012-13 |
2011-12 |
Mean |
Std. Dev. |
|
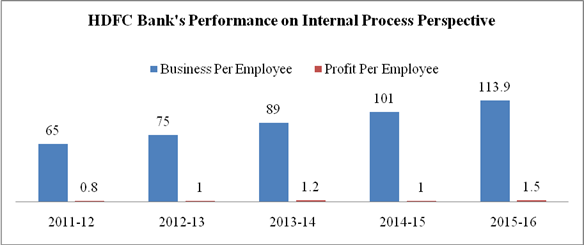
Productivity Growth |
Business Per Employee |
Million ₹ |
113.9 |
101 |
89 |
75 |
65 |
87.025 |
19.594 |
|
Profit Per Employee |
Million ₹ |
1.5 |
1 |
1.2 |
1 |
0.8 |
1.076 |
0.265 |
|
|
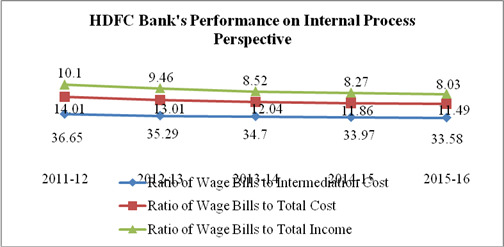
Reducing Cost of business operations |
Ratio of Wage Bills to Intermediation Cost |
% |
33.58 |
33.97 |
34.7 |
35.29 |
36.65 |
34.821 |
1.209 |
|
Ratio of Wage Bills to Total Cost |
% |
11.49 |
11.86 |
12.04 |
13.01 |
14.01 |
12.449 |
1.022 |
|
|
Ratio of Wage Bills to Total Income |
% |
8.03 |
8.27 |
8.52 |
9.46 |
10.1 |
8.842 |
0.873 |
|
|
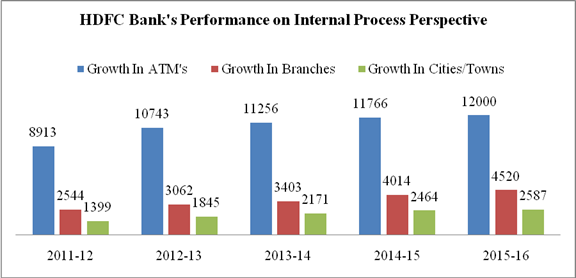
Increasing Geographical reach for customers |
Growth In ATM's |
Numbers |
12000 |
11766 |
11256 |
10743 |
8913 |
- |
- |
|
Growth In Branches |
Numbers |
4520 |
4014 |
3403 |
3062 |
2544 |
- |
- |
|
|
Growth In Cities/Towns |
Numbers |
2587 |
2464 |
2171 |
1845 |
1399 |
- |
- |
|
Source: Compiled from Annual Reports & other reports of HDFC Bank from 2011-12 to 2015-16
Graphical Presentation:
GRAPH 3 a
GRAPH 3 b
GRAPH 3 c
Interpretation and Analysis:
1. Business per Employee has been increased to ₹ 113.9 million in 2015-16 from ₹ 65 Million in 2011-12 and profit per employee has also been increased to ₹ 1.5 million in 2015-16 from ₹ 0.8 million in 2011-12. Both ratios has increasing trend which shows that HDFC bank has a higher productivity growth resulted from highly skilled, trained employee which are able to bring more business to bank and increases its profitability by completing the targets given to them by bank.
2. Ratio of wage bill to intermediation cost, ratio of wage bills to total cost and ratio of wage bills to total income all three have been declined from 36.65%,14.01% and 10.1%in 2011-12 to 33.58%, 11.49% and 8.03% in 2015-16 respectively. Low wage ratios and high productivity ratios indicates efficient and skilled employees are able to provide satisfying services to their customers which leads to smooth running of business.
3. There has been a continuous increase in number of ATM’s, Branches and cities/towns. 234 new ATM’s and 506 new branches were opened in year 2015-16. Increase in distribution channels leads to customer reach to bank easily, ultimately more connectivity more customers and more customers more business growth.
D. Measurement of Performance on Learning & Growth and Innovation Perspective:- To measure and evaluate the performance of HDFC bank on learning & growth and Innovation perspective following measures (as shown in Table 4) have been selected based on strategic objectives of the bank:
|
Table 4:HDFC Bank's Performance on Learning & Growth and Innovation Perspective
|
|||||||||
|
Strategic Objectives |
Measures |
Unit |
2015-16 |
2014-15 |
2013-14 |
2012-13 |
2011-12 |
Mean |
Std. Dev. |
|
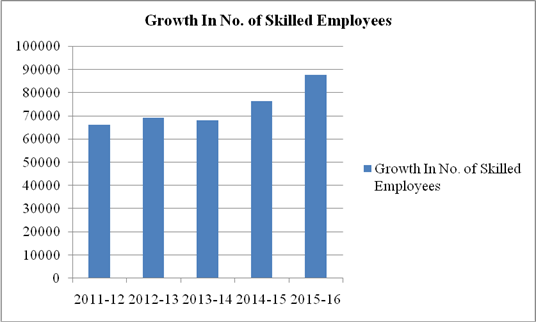
Training & Development |
Growth In No. of Skilled Employees |
No. |
87555 |
76286 |
68165 |
69065 |
66076 |
- |
- |
|
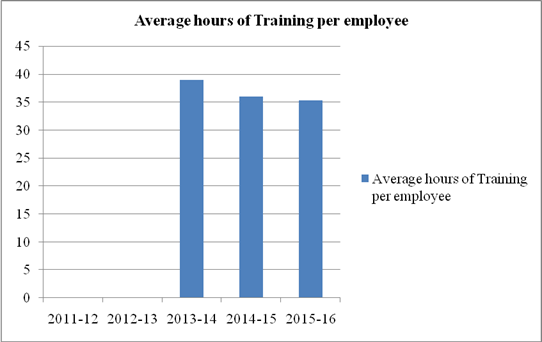
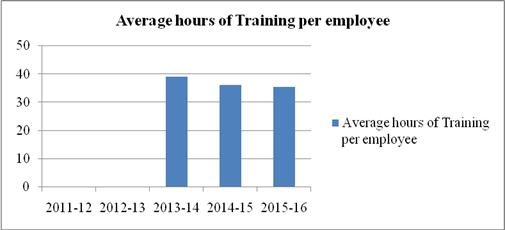
Average hours of Training per employee |
Hours |
35.32 |
36 |
39 |
- |
- |
36.739 |
1.958 |
|
|
Expenditure on employees |
Million ₹ |
57021.9 |
47509.5 |
41789.8 |
39653.8 |
33999 |
43324.013 |
8741.864 |
|
|
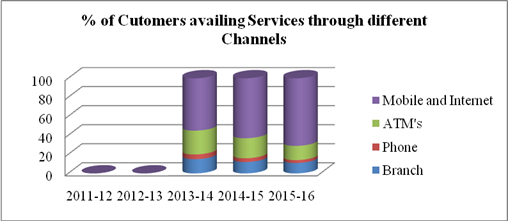
Digitalization of Products & Services (% of Customer availing services through) |
Branch |
% |
11 |
12 |
15 |
- |
- |
12.557 |
2.082 |
|
Phone |
% |
3 |
4 |
5 |
- |
- |
3.915 |
1 |
|
|
ATM's |
% |
15 |
21 |
25 |
- |
- |
19.895 |
5.03 |
|
|
Mobile and Internet |
% |
71 |
63 |
55 |
- |
- |
62.660 |
8 |
|
|
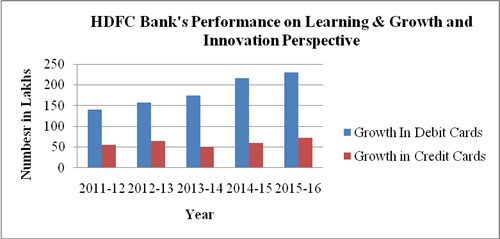
Growth In Debit Cards |
In Lacs |
230.3 |
216.3 |
174.2 |
157.6 |
141.1 |
180.758 |
38.146 |
|
|
Growth in Credit Cards |
In Lacs |
72.8 |
59.7 |
51.4 |
64.2 |
56 |
60.389 |
8.188 |
|
Source: Compiled from Various Publications of Annual Reports & other reports
Graphical Presentation:
HDFC Bank's Performance on Learning & Growth and Innovation Perspective
Graph 4 a
Graph 4 b
Graph 4 c
Graph 4 d
Graph 4 e
Interpretation and Analysis:
1. Bank has significantly increased the number of skilled employees. Number of employees has been increased to 87555 in 2015-16 from 66076 in 2011-12.Average hours of training per employee have also been increased to 35.32 in 2015-16 from 39 in 2013-14.
2. Expenditure on employees has also been increased from ₹ 33999 million in 2011-12 to ₹ 57021.9 million in 2015-16. This may be due to increased expenditure on training & Development of employees or increased cost of retaining and hiring highly skilled employees.
3. In 2015-16, 71% customers were availing banking services through mobile and internet, 15% through ATM’s, 3% from phone and 11% from branches. There has been a continuous increase in usage of digitalized products & services due to introduction of advanced technology, innovations in products & Services by bank.
|
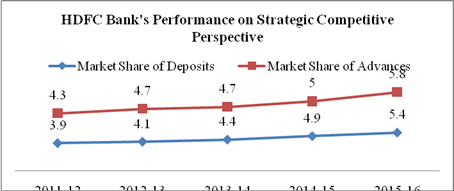
Table 5: HDFC Bank's Performance on Strategic Competitive Perspective |
|||||||||
|
Strategic Objectives |
Measures |
Unit |
2015-16 |
2014-15 |
2013-14 |
2012-13 |
2011-12 |
Mean |
Std. Dev. |
|
Increasing Market Share |
Market Share of Deposits |
% |
5.4 |
4.9 |
4.4 |
4.1 |
3.9 |
4.508 |
0.611 |
|
Market Share of Advances |
% |
5.8 |
5 |
4.7 |
4.7 |
4.3 |
4.875 |
0.561 |
|
E. Measurement of Performance on Strategic Competitive Perspective:- To measure and evaluate the performance of HDFC bank on Strategic Competitive perspective following measures (as shown in Table 5) have been selected based on strategic objectives of the bank:
Source: Compiled from Various Publications of Annual Reports & other reports
Graph 5 a
Interpretation and Analysis:
The market share of Deposits and Advances of HDFC bank has continuously increased in comparison to other competitors from 3.9% and 4.3% in 2011-12 to 5.4% and 5.8 % in 2015-16 respectively.
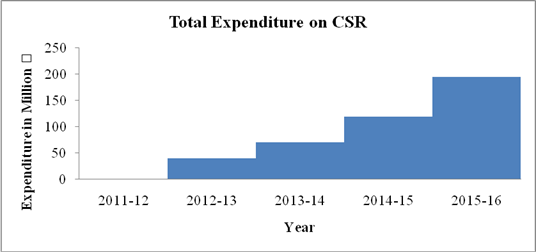
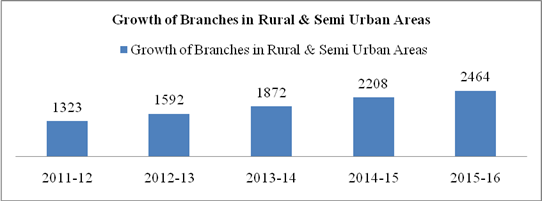
E. Measurement of Performance on Social Perspective:- To measure and evaluate the performance of HDFC bank on Social perspective following measures (as shown in Table 6) have been selected based on strategic objectives of the bank:
|
Table 6: HDFC Bank's Performance on Social Perspective
|
||||||||
|
Strategic Objectives |
Measures |
Unit |
2015-16 |
2014-15 |
2013-14 |
2012-13 |
2011-12 |
Mean |
|
Corporate Social Responsibility |
Total Expenditure on CSR |
Million |
194.81 |
118.55 |
70.37 |
39.01 |
- |
89.232 |
|
Development of Semi urban & rural areas |
Growth of Branches in Rural & Semi Urban Areas |
Numbers |
2464 |
2208 |
1872 |
1592 |
1323 |
1846.247 |
Source: Compiled from Various Publications of Annual Reports & other reports
HDFC Bank's Performance on Social Perspective
Graph 6 a
Graph 6 b
Interpretation and Analysis:
The expenditure on Social activities has been increased continuously in the last four years. It was ₹ 39.01 million in 2012-13 and increased to ₹ 194.81 million in 2015-16. Creating sustainable communities is overall objective of CSR activities. To improve access of banking services as a rural development initiative, bank has grown no. of branches in rural and semi urban areas to 2464 in 2015-16 from 1323 in 2011-12. Expenditure on health & Sanitation, financial inclusion & literacy, sustainable livelihood initiatives, skills & livelihood enhancement etc. has been continuously increased by bank in recent years.
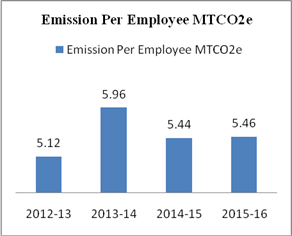
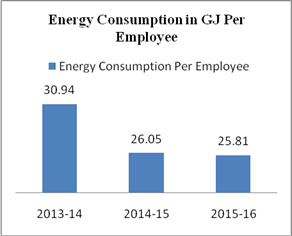
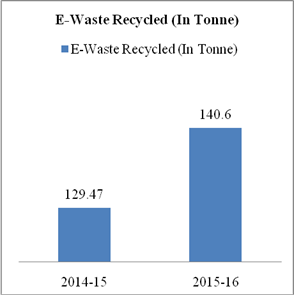
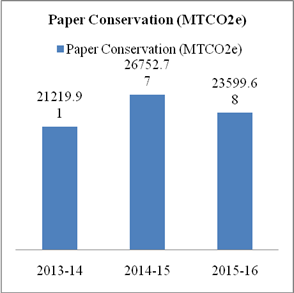
E. Measurement of Performance on Environment Perspective:- To measure and evaluate the performance of HDFC bank on Environment perspective following measures (as shown in Table 7) have been selected based on strategic objectives of the bank:
|
Table 7: HDFC Bank's Performance on Environment Perspective
|
||||||||
|
Strategic Objectives |
Measures |
Unit |
2015-16 |
2014-15 |
2013-14 |
2012-13 |
2011-12 |
Mean |
|
Protecting Environment |
Emission Per Employee |
MTCO2e |
5.46 |
5.44 |
5.96 |
5.12 |
- |
5.487 |
|
Energy Consumption Per Employee |
GJ/employee |
25.81 |
26.05 |
30.94 |
- |
- |
27.502 |
|
|
E-Waste Recycled |
Tonne |
140.6 |
129.47 |
- |
- |
- |
134.920 |
|
|
Paper Conservation |
MTCO2e |
23599.68 |
26752.77 |
21219.91 |
- |
- |
23750.502 |
|
Source: Compiled from Various Publications of Annual Reports & other reports
Graph 7 a and b
 <
<
Graph c Graph d
Interpretation and Analysis:
Paper forms major part of bank’s resource consumption. HDFC bank has initiated for saving paper consumption by adoption of digital banking channels, energy efficiency and paper conservation measures. Emission of carbon from paper consumption, e –waste and business travel has increased to 23599.68 MTCO2e in 2015-16 from 21219.91 MTCO2e in 2013-14. 140.6 tonne of e-waste has been given for recyclation to concerning authorities. Carbon Emission per employee has also increased to 5.46 MTCO2e in 2015-16 from 5.12 MTCO2e in 2012-13. Energy consumption also decreased to 25.81 GJ in 2015-16 from 30.94 GJ per employee in 2013-14.
HDFC bank has constantly increases innovations in Products, Processes and Technology as per the need and demands of the different customer segments which resulted in high customer base of bank. Latest technology and innovations in banking services demands for highly skilled & trained workforce who can upgrade themselves with the changes and provide best customer experiences. As the figures shows that HDFC bank has continuously increased number of skilled employees in the recent years and provide various trainings on behavioural and functional and technical aspects which resulted in improved operations and smooth functioning of business. Improved operations has led the bank increases its customer base and high customer base has increases the business of bank and high growth in business has maintained the profitability of the bank in last five years. Yet there is a decline in growth rate of profits in these years which may be due to increase in cost of infrastructure, investments in new technology or due to increase in other cost of business operations. Responsible behaviour of HDFC bank towards its key stakeholders, society and environment has contributed in achieving & sustaining competitive advantage. It is concluded that financial performance of HDFC bank has a significant impact of other perspectives such as customer, internal processes, learning & growth and innovations, social, environment, and strategic competitiveness based on balanced scorecard approach during 2011-12 to 2015-16.
Performance evaluation on each perspective of Balanced Scorecard is necessary requirement for bank so that the key areas/measures for improvement can be identified and improved. Further it is suggested more studies are needed on comparative studies with others Indian banks based on BSC. For more reliability and accuracy in results more years can be taken for study. The data was based on secondary sources but for perspective other than financial, primary data is required to be gathered and analysed. More tools and techniques to analyse data for more accuracy and validity of results is needed.
JOURNALS
1. Amiri, M.P., Amiri A.P. and Amiri M.P. (2012). An Analytical Network Process Approach for evaluating Banking Performance based on Balanced Scorecard. Trends Applied Sciences. 1-11. 2012.
2. Balkovskaya D. and Filneva L. (2016). The Use of Balanced Scorecard in Bank Strategic Management. International Journal of Business Excellence. 9 (1). 48-67.
3. Dave, S. R. & Dave, S. R. (2012, December). Applying Balanced Scorecard in Indian banking Sector: An Empirical Study of the State bank of India. Pacific Business Review International, 5 (6), 108-120.
4. Hacioglu, U. and Yuksel, S. (2016). Balanced Scorecard-Based Performance assessment of Turkish Banking Sector with Analytic Network Process. International Journal of Decision Sciences Applications. 1 (1),1-21.
5. Ibrahim, M. and Murtala, S. (2015). The Relavance of Balanced Scorecard as a Technique for assessing Performance in the Nigerian Banking Industry. European Journal of Business , Economics and Accountancy. 3 (4), 71-80.
6. Kaplan, R.S. & Norton, D.P. (1992). The Balanced Scorecard – Measures that Drive Performance. Harvard Business Review, 70 (1), 71- 79.
7. Michael, O. W. B. and Tobi, A. B. (2014). Performance Measurement in the United Kingdom (UK) retail banking industry. European Journal of Business and Management. 6 (19). 70-80.
8. Shahsoodi K. and Bahraloloom S. A. (2014). Evaluating the Efficiency of Banking Industry by DEA: Balanced Scorecard Approach. Indian Journal of Fundamental and Applied Life Sciences. 4 (S1). April-June, 1426-1435.
9. Tekar, Teker and Kent (2011). Measuring Commercial Bank’s Performance in Turkey: A Proposed Model. Journal of Applied Sciences. 1 (3). 97-112.
10. Vola, P., Broccardo, L. and Truant, E. (2009). “Performance Measurement under Balanced Scorecard: The case study of a Co-operative Credit Bank in Piedmont”. Economia Aziendale Online, International Business Review. July, 2009.
WEBSITES