Pacific B usiness R eview I nternational

A Refereed Monthly International Journal of Management Indexed With THOMSON REUTERS(ESCI)
|
Muhammad Haris School of Finance and Economics Jiangsu University, Zhenjiang, China |
HongXing Yao School of Finance and Economics Jiangsu University, Zhenjiang, China |
Gulzara Tariq School of Finance and Economics Jiangsu University, Zhenjiang, China |
Hafiz Mustansar Javaid College of Management Shenzhen University, Shenzhen, China |
Ali Malik QFBA-Northumbria University, Doha, Qatar |
This study compares the magnitude of the impact of the value-added intellectual coefficient (VAIC) and large employee size on the profitability of Islamic and conventional banks in Pakistan. To examine the impact of intellectual capital (IC) on profitability, the graphical method and t-test are used. The robust results of this study suggest that value-added intellectual coefficient (VAIC) has the higher positive impact on the profitability of conventional banks than Islamic banks, while human capital efficiency (a component of VAIC) has the higher positive impact on the profitability of Islamic banks than conventional banks. This study has found lower profitability for conventional and Islamic banks having large employee size. The t-test comparison indicates that conventional banks have the higher mean profitability and value-added intellectual coefficient than Islamic banks. Overall, the findings of the study suggest that investment in human capital has potential to engender higher value forthe sustained growth of banks.
GEL Classificatio: G11, G21, E24, O34
Keywords : Islamic banks, conventional banks, Pakistan, intellectual capital, employee size
The banking industry of Pakistan is based on the dual banking system of conventional and Islamic ideologies. At present, 24 conventional banks (CB) and 5 Islamic banks (IB) are operating in Pakistan. The conventional banking industry has a long history of inception while the first Islamic bank (Meezan bank limited) was established in the year 2002. Over the past decade (2007-2016), the Islamic banking industry of Pakistan has performed remarkably. As on December 2016, the share of full-fledged Islamic banks in terms of assets increased to 7.47 percent from 2.34 percent, deposits increased to 8.31 percent from 2.39 percent, advances increased to 10.38 percent from 2.16 percent, and value-added increased to 3.26 percent from 1.07 percent ( Based on the authors estimations from the audited annual financial statements) . Comparatively, the share of conventional banks in terms of assets, deposits, advances, and value-added are decreased [1] . It shows that the Islamic banking industry in Pakistan is growing. As for the profitability, measured by return on assets (ROA), comparison over the past decade (2007-2016); the profitability of the IB is found to be consistently lower than the profitability of CB (see Figure 1) and t-test comparison also shows significantly higher mean value of ROA of CB compared to IB. It shows that irrespective of the growth, IB in Pakistan are still generating lower profitability than CB.
[FIGURE 1 ABOUT HERE]
[TABLE 1 ABOUT HERE]
Banks as financial intermediaries accept money from those having surplus amounts of funds and lend it to those having deficit amount of funds. Berger et al. (2010) argue that banks play an important role to the reallocation of funds from surplus to deficit units. Banks provide services which are intangible in nature, therefore, the intangible resources are more important to create value for the banks. These intangible resources include information, intellectual property knowledge and experience of the employees (Stewart 1997). The banking sector is considered as more intellectual capital intensive (Branco et al. 2011), therefore, the staff of banks is intellectually demanded (Mavridis 2004). Banks, as a skill-based and knowledge intensive industry, use a huge amount of human capital to sustain competitiveness (Kamath 2007). With regards to service provision, intellectual capital (IC)is considered the most important factor to determine the quality of services provided by the banks (Goh 2005).
This study has attempted to compare the importance of IC performance and its impact on the profitability of Islamic and conventional banks in Pakistan. The study is conducted over the ten years period of 2007-2016. To compare IC, this study has used a Value Added Intellectual Coefficient (VAICTM) developed by Pulic (1998) to measure the intellectual capital performance of firms. The VAIC is the sum of three components: (a)human capital efficiency (HCE) that determines the value-added efficiency of human capital, (b) structural capital efficiency (SCE) that determines the value-added efficiency of structural capital, and (c) capital employed efficiency (CEE) that determines the value-added efficiency of financial capital employed.
The result of the multiple regressions indicates that the magnitude of the estimated VAIC coefficient is higher for conventional banks (CB) as compared to Islamic banks (IB). It suggests that conventional banks in Pakistan have a more developed mechanism of intellectual capital which contributes to higher profitability. Among VAIC components, only HCE has found to be significantly positive to profitability of both conventional and Islamic banks. On the other hands, the estimated coefficient of HCE is higher for Islamic banks suggesting a higher value-added efficiency of every rupee invested in employee. Further, the study has also found lower profitability of conventional and Islamic banks having a large employee size, thus indicating a significantly negative impact.
The rest of the paper is arranged as; section 2 reviews the literature, section 3 discusses methodology, sections 4 covers analysis and findings and finally section 5 provides conclusion and implications.
There is abundant literature available on intellectual capital (IC) and bank's profitability across emerging and developing markets. A recent study was conducted by Nawaz and Haniffa (2017) to examine the impact of intellectual capital on the profitability of 64 Islamic financial institutions in 18 countries over the period 2007-2011. The study used cross-sectional regression and found a positive effect of VAIC, CEE and HCE on ROA with estimated coefficient values of 0.664, 11.76 and 1.118 respectively.
Meles et al. (2016) extended their study to analyse the impact of intellectual capital efficiency on banks profitability of 5749 US commercial banks over the period 2005-2012. They have used OLS regression and found a positive and statistically significant impact of VAIC on ROA and ROE with coefficient values of 0.113 and 0.536 respectively. Among VAIC components, only HCE has found a positive and significant impact on ROA and ROE with estimated coefficients of 0.109 and 0.526 respectively.
Al-Musali and Ismail (2016) devoted their study to the banking sector of GCC countries. They have taken a sample of 214 both conventional and Islamic banks operating in six GCC countries over the period 2008-2010. Their study applied multiple regression and found a positive and statistically significant impact of VAIC on the profitability (ROA) with different coefficients for different GCC countries, for instance; 0.763 for banks in Bahrain, 0.881 for banks in Kuwait, 0.933 for banks in Oman, 0.687 for banks in Qatar, 0.898 for banks in Saudi Arabia, and 0.329 for banks in UAE. Among VAIC components; their study found different results in different countries, for instance; a positive and significant impact of the HCE on the profitability of banks in Bahrain, a positive impact of the SCE on ROA &ROE while a negative impact of the CEE on ROE of banks in Kuwait, a positive impact of both HCE and CEE on the profitability of banks in Oman, a negative impact of HCE on ROA of banks in Qatar and UAE, and a positive impact of both HCE & CEE on ROA of banks in Saudi Arabia.
A recent study by Ozkan et al. (2016) was conducted on 44 Turkish banks over the period 2005-2014. Their study used multiple regressions to test the impact of VAIC and its components on ROA. Their study does not find any significant impact of VAIC and SCE on ROA, but find a positive and significant impact of both CEE and HCE on ROA with coefficient values of 0.0933 and 0.0056 respectively. Another study by Mondal and Ghosh (2012) was conducted on 65 Indian banks over the period 1999-2008,which used multiple regression to test the relationship between the bank’s profitability and VAIC and its components. The analysis of their study is based on yearly data. Their study found positive and statistically significant impact of VAIC on ROA in each year under the analysis except the years2005 and 2008, a positive influence of HCE on ROA in each year except 2000, 2003 and 2008. Furthermore, they found both insignificant and significant impacts of SCE and CEE on the profitability in different years.
An earlier study used multiple regression to test the impact of VAIC components on the ROA of 22 financial institutions listed on Bursa Malaysia over the period 1999-2007 (Ting and Lean 2009). The study found a positive and significant impact of HCE and CEE on ROA with coefficient values of 10.33 and 417.731 respectively, and found a negative and insignificant impact of SCE. The study also found a significant positive correlation between VAIC and ROA. Another study by Puntillo (2009) empirically examined the relationship between the intellectual capital and bank’s performance, measured by return on investment, market to book ratio and return on assets. The study applied multiple regression over the data of 21 Italian banks were listed in Borsa Valori (Italian Stock Exchange) and found a positive relationship between capital employed efficiency (CEE) and bank’s performance.
Among some other earlier studies, Pulic (2001) extended his study to evaluate the information coefficient performance of Croatian banks over the period 1996-2000 and found a wide range of variation in IC performance. Further, Mavridis (2004) extended his study to 141banks member of the Japanese bankers association and found value added has changed with the same direction in physical capital.
Apart from the above studies extended to empirically examine the relationship between banks performance and intellectual capital, some studies have just analysed and compared the VAIC performance of different sectors. For instance; Goh (2005) analysed and compared the VAIC performance between ten domestic and six foreign banks in Malaysia over the period 2001-2013. He found foreign banks more efficient than domestic banks and also found HCE as the main VAIC component that contributes more to generate value, Kamath (2007) analysed the intellectual capital performance of 98 schedule banks over the period 200-2005 and found foreign banks performed well than domestic banks. Further, Joshi et al. (2010) analysed the intellectual capital performance of 11 Australian banks over the period 2005-2007 and found a higher human capital efficiency of Australian banks than structural capital and capital employed efficiency.
2.1.VAIC studies on banking industry of Pakistan.
The VAIC studies on Pakistani banking industry are scarce and weakened either by small sample size or small data set. However, as per best of our knowledge, one study used OLS regression and compared the IC performance between six Islamic and six conventional banks in Pakistan over the period 2006-2010 (Latif et al. 2012). The study found an insignificant impact of VAIC on ROA of Islamic and conventional banks. The study also found that among all VAIC components, only HCE translates performance of Islamic banks while CEE translates the performance of conventional banks. Another study by Bharathi (2010) , used a sample of 34 banks over the 2 year period and found private banking industry performed well relative to intellectual capital. A study by Khan et al. (2015) , examined the relationship of VAIC and performance of the 5 Islamic bank’s over the period 2009-2014. They found a positive relationship between VAIC and Islamic bank’s performance. Another study by Rehman et al. (2012) , analysed the VAIC performance of 20 banks just for the one year period (2010) and found an insignificant relationship between ROA and VAIC. Consistent with the above all studies, we expect that magnitude of the impact of VAIC is higher for CB compared to IB, while the magnitude of the impact of HCE is higher for IB compared to CB. Further, we do not expect any significant impact of CEE and SCE on the profitability.
3.1. Sample and Data
This study is about the comparative analysis of intellectual capital performance of Islamic and conventional banks in Pakistan. Currently, in Pakistan, 5 full-fledged Islamic banks and 21 conventional banks are operating (SBP 2016) [i] . All Islamic banks are operating under the private ownership, while out of 21 conventional banks, 5 banks are state-owned and 16 banks are private-owned. For this study, we have considered only private conventional banks, to get more consistent results by removing the ownership effect(for the list of banks see Appendix). Out of 5 Islamic banks, only 02 years data of one Islamic bank was available [ii] , which has been excluded from the study, so the final sample of this study is 20 banks including, 4 Islamic and 16 conventional banks.
The calculation of VAIC is based on the audited financial statements, which makes the calculation verifiable and more impartial. So for this study, the audited financial statement has been obtained from databases maintained by each bank and the central banks of the country (SBP). To get more consistent results, the period of this study is based on latest and large data set over the years 2007-2016. Finally, we get 200 bank year observation based on 10 years data of 20 commercial banks.
3.2. Variables Measurement
3.2.1. Dependent variable
In the past, Mondal and Ghosh (2012) argued that there is no adequate empirical evidence which determines the power of any profitability indicator, but for IC studies ROA is a more appropriate financial indicator to measure the financial performance of a firm also argued by Stewart (2007) . So for this study, we use return on assets ROA as a measure of profitability, which represents the financial performance, commonly used by many previous studies (e.g. Nawaz and Haniffa (2017) ; Meles et al. (2016) ; Mondal and Ghosh (2012) ; Ting and Lean (2009) ). ROA is measured as the net profit divided by average total assets of a bank, the average calculated as total assets of the first year plus total assets of the previous year divided by two. ROA indicates an efficient assets utilization ability of a firm to generate adequate earnings, more efficient utilization of the assets leads to more profitability.
3.2.2. Independent variables
Intellectual Capital
For intellectual capital performance, value-added intellectual capital coefficient (VAICTM) has been used, which is developed by Pulic (1998, 2000, 2004) and used by many previous studies, for instance; Ozkan et al. (2016) , Alhassan and Asare (2016) , Meles et al. (2016) Yalama and Coskun (2007) , Mavridis (2004) , and Ting and Lean (2009) . VAIC has three components and measures as follows;
VAICit = HCEit + SCEit+ CEE it (1)
HCE is the human capital efficiency of i banks at time t, SCE is the structural capital efficiency of i banks at time t, and CEE is the capital employed efficiency of i banks at time t. VAIC provides an insight to the management of banks to evaluate and monitor the value-added (VA) efficiency, so higher value of VAIC indicates the higher value added efficiency generated by firm’s total resources and each component of total resources available (Pulic 1998). In order to calculate the VAIC components, we first need to calculate the VA by using following;
VAit = OPit + ECit + Dit + Ait (2)
In the above equation 2, OP is operating profit of i banks at time t, EC is the employment cost (total salaries and other expenses related to employees) of i banks at time t, D is the depreciation and A is the amortization of i banks at time t. The calculation of VAIC components is given below;
HCEit = VAit / HCit (3)
SCEit = SCit / VAit (4)
SCit = VAit – HCit (5)
CEEit = VAit / CEit (6)
In above equations 3, 4 and 6, HC is the human capital (calculated as the salaries and wages, plus other employee expenses) is used to measure VA efficiency of human capital, SC represents the structural capital is used to measure the VA efficiency of structural capital and CE is capital employed (value of equity invested by shareholders) is used to measure of VA efficiency of capital employed i.e. physical capital.
Employee Size
Employee Size (ESIZE); this study analyses the effect of employee size and proposes negative impact of large employee size on profitability. We utilise a dummy variable by assigning the value 1 if a bank has employee size larger than employees mean value [iii] of total banks used in this study and 0 otherwise. For the robust check, we analyse the reversal effect of ESIZE, we then assigned the value 1 if the bank has employee size less than the employees mean value of total banks used in this study and 0 otherwise.
3.2.3. Control Variables
This study has controlled the impact of some banks-specific variables in order to get more consistent and unbiased results. The detail of control variables is given below;
1. Banks size (BSIZE): has been controlled by the natural logarithm of total loans.
2. Credit Risk (Risk); the nonperforming loan ratio has used as a proxy of credit risk, calculated as the amount of total nonperforming loan in a year divided by total loans outstanding.
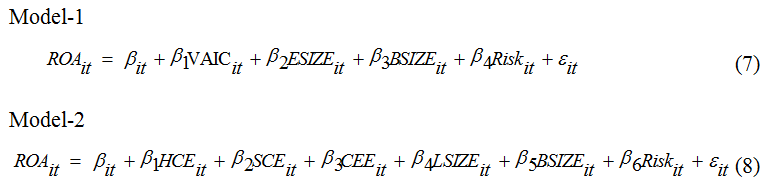
3.3. Regression model
A multiple regression analysis over the data has been used to determine the impact and importance of employee size and IC for Islamic and conventional banks in Pakistan on/for their profitability. For this, 2 following regression models have developed. Model 1 is used to examine the impact of ESIZE and VAIC on ROA while controlling the bank-specific factors and Model 2 examines the impact of ESZIE and VAIC components (HCE, CEE, and SCE) on profitability while controlling the banks’ specific factors.
4.1.Intellectual Capital Comparison
VAIC has used to compare the IC performance, for that, Table 2 presents the intellectual capital comparison between IB and CB while Figure 2 presents the VAIC comparatively trend between IB and CB and Figures 2a, 2b and 2c reveal the comparative trend in CEE, HCE, SCE respectively over the period 2007-2016. For VAIC performance trend over the period, 2007-2016 of each bank see Appendix-Table B, where MCB bank has the highest average of VAIC among all conventional banks whereas Meezan bank has the highest average of VAIC among all Islamic banks.
[TABLE 2 ABOUT HERE]
The VAIC performance of CB remained higher than IB over the period under analysis. Table 2 also reports the significant difference of (1.4772) in the mean VAIC, where CB has the higher mean VAIC than IB. As for the VAIC components; HCE and SCE performance of IB has remained consistently lower than the CB over the period 2007-2016.The t-test comparison shows a significant difference in the mean value of HCE&SCE by 0.8123697 & 0.6106019 respectively, where CB has higher the mean HCE & CEE than IB, which means that CB in Pakistan are generating higher value-added efficiency than IB. The CEE performance of IB also remained lower than the CB except the year 2014 and therefore, t-test shows an insignificant difference in the mean value of CEE.
[FIGURE 2, 2a, 2b, 2c ABOUT HERE]
[TABLE 3 ABOUT HERE]
4.2. Descriptive Statistics
Table 04 presents the summary statistics comparison between the conventional banks (CB) and Islamic banks (IB) for dependent and independent variables over the period of ten years.
The mean ROA of CB is 0.0066594 but the mean ROA of IB is negative (-0.0005361), it shows that on an average Islamic banking industry is still in developing stage and managing to create the balance between the revenues and expenses, while the ROA standard deviation (SD) of CB (0.0180461) is higher than the ROA SD of IB (0.0140554) due the large number of banks.
The mean VAIC of CB (3.269446) is higher than the mean VAIC of IB (1.7922). The IB also postulates the higher variation in VAIC with SD (2.481521) than CB (SD: 1.896311). The mean HCE of CB (2.29394) is also higher than the mean HCE of IB (1.481571),but the finding shows lower variation in the HCE performance of IB (SD: 0.8996578)compared to CB (SD: 1.573455). This study can suggest that although IB have lower HCE performance, but IB are more consistent to generate HCE than CB.As for the SCE, the IB have very lower performance than CB having mean SCE of 0.0378395 and 0.6484413 respectively. As for the CEE, IB have a lower mean value of CEE (0.2727903) than the CEE mean value of CB (0.3270647), but the IB are more capable to generate a consistent value of the physical capital employed for the shareholders than the CB having SD values 0.1836193 and 0.3784025 respectively. The asset size of CB is higher than the IB due to the difference in the number of banks. For the risk, the IB have a lower average of NPLR (6.8104%) than the CB (14.2426%) , which shows that IB are in Pakistan are more capable of risk management.
[TABLE 4 ABOUT HERE]
4.3. Estimated regression results
Table 5 reports the results of multivariate regression, where we have 157 bank year observations for CB and 40 bank year observations for IB. Fisher type unit root test was performed to check the unit root among variables, the significant p-values of each variable indicate that data has no unit root. The variance inflation factor test was performed to check the multicollinearity among independent variables. The VIF for ESIZE = 2.24, VAIC = 1.57, HCE = 2.66, SCE = 1.09, CEE = 1.58BSIZE = 2.76, Risk = 1.12 reject the existence of multicollinearity among variables. Further, Breusch-Pagan / Cook-Weisberg test for heteroscedasticity was performed for each model, where the p-values of Het-Chi2 reject the problem of heterogeneity. Adjusted R2 shows the higher explaining power of each model ranging from 65.52% to 89.48%. At 1% significant p-values of F-test in each model show the goodness of overall model fit. Model 1 reveals the comparative importance of employee size (ESIZE) and VAIC while model 2 reveals the comparative importance of employee size (ESIZE) and joint impact of VAIC components (HCE, CEE, SCE) between CB and IB.
In model 1, the VAIC coefficient for CB is 0.0041 and for IB is 0.0020, which means a 1 percent increase in the VAIC brings 0.0042 percent increase in the profitability of CB and only 0.0020 percent increase in the profitability of IB. However, the VAIC coefficients are economically and statistically significant for CB and IB profitability, thus we accept our hypothesis. As per finding, the VAIC contribution to translate the profitability, is higher for CB than the IB. The positive relationship between VIAC and profitability is consistent with Meles et al. (2016) , Al-Musali and Ismail (2016) , and Mondal and Ghosh (2012) . As for the employee size, the coefficient of ESIZElarge (-0.0058& -0.0133) is negatively significant for both the CB& IB respectively. Here, this study suggests that those CB and IB with large employee size are less profitable and not efficient to generate value from employees than banks having small employee size. The study also suggest that the increase in the employee size has the higher negative impact on the profitability of IB than CB. The positive coefficient of BSIZE for CB is 0.0051 and for IB is 0.0140, which are highly statistically significant. It shows that the increase in the loans and advances have a significantly positive impact on the profitability of both CB and IB, but a higher positive impact on the profitability of IB than the CB. The CB are big in size and they do not rely only on loans and advances, rather they have a more diversified portfolio of interest-generating assets like investments in the financial market, as the average investment to assets ratio of CB (38.47 percent) is higher than IB(27.82 percent) [iv] . As for the credit risk, a negative coefficient value of Risk for CB is -0.0796 and for IB is -0.0209, which indicate 0.0796 percent decrease in the profitability of CB while only 0.0209 percent decrease in the profitability of IC with the 1 percent increase in nonperforming loan ratio. However, the lower estimated coefficient of Risk for IB is insignificant, which reveals a sound credit management capability of IB, as the average nonperforming loan ratio of IB (6.04 percent) is lower than the CB (11.31 percent) [2] .
In model 2, this study has compared the impact of VAIC components on the profitability of CB and IB. Among the VAIC components, we only find the significant positive impact of HCE on the profitability of both CB and IB proving our expected hypothesis regarding VAIC components. The positive coefficient of HCE is 0.0071for CB and is 0.0164for IB. Higher coefficient of HCE for IB indicates its high importance to translate their profitability compared to CB. Previous studies also find the positive impact of HCE on profitability (for instance, Meles et al. (2016) , Ozkan et al. (2016) , Mondal and Ghosh (2012) , and Ting and Lean (2009) ). As per finding, this study suggests that 1 percent increase in HCE increases 0.0164 percent profitability of IB while increases only 0.0071 percent profitability of CB when measured by ROA. The estimated ESIZElarge coefficients of CB and IB are negatively significant and decreased to -0.0039 and -0.0090respectively, compared to Model 1, which indicates that both CB & IB with large employees’ size have lower profitability. As for the control variables, the positive and significant coefficients of BSIZE for CB and IB have also decreased to 0.0034 and 0.0096respectively, compared to Model 1, which still shows higher importance of loans for IB to generate their profitability compared to CB. Similar to the model 1, the risk has the negative and significant impact on the profitability of CB while it is negative and insignificant for IB in model 2. However, the results of BSIZE and control variables in Model 2 remained consistent with the Model 1.
[TABLE 5 ABOUT HERE]
4.4. Robust check
For the robustness of the results, this study has re-estimated both Model 1 and Model 2 by two different ways. One, the study has used one time lagged of independent variables except for employee size because of a dummy variable. Second, for employee size, we have analysed the reversal effect of employee size from large employee size ESIZE large to small employee size ESIZEsmall and this time has assigned 1 if the bank has employee size less than employees mean value (5606) of sample banks and 0 otherwise. The robust results are presented in Table 5. The coefficient of VAIC is positive and statistically significant of CB while it is positive and insignificant for IB. The result of VAIC is robust for CB reports that 1 percent increase in VAIC increases 0.0041 percent profitability of CB, which is almost consistent with the prior estimation (see Table 5). As for the employee size, the coefficient values of ESIZEsmall are positive for both CB and IB, which proves the robustness and shows the higher profitability of banks having small employee size than the banks having large employee size. The magnitude of the coefficient values of control variables has changed, but they have maintained their significance level in Model 1 and remained consistent with Table 5.
[TABLE 6 ABOUT HERE]
For the robustness of VAIC components, we find positive significant impact of previous year HCE on the next year profitability of CB and IB. This positive impact is consistent with Table 5. The estimated coefficients of HCE and SCE indicate that 1 percent increase in the HCE of previous year increases the next year profitability of CB by 0.0049 percent. Consistent with the Model 1, the estimated coefficients of ESIZEsmall are positive and statistically insignificant in both Model 2. However, we find the robust and consistent results of ESIZE and control variables, similar to the Model 1 and Table 5.
4.5. Further robust check
For further robustness, we converted the data into panel and applied ordinary least square (OLS) both fix and random effect based on Hausman test. We also performed Wooldridge test for autocorrelation and do not find any problem of serial correlation of explanatory variable with residuals. However, the study finds the consistent and robust results [v] .
This paper quantifies the importance of intellectual capital and employee size for the profitability of conventional and Islamic banks in Pakistan. For this purpose, data is accessed from audited annual financial statements of 16 conventional and 4 Islamic banks over the period 2007-2016. ROA has used to measure the profitability, VAIC has used to measure the intellectual capital performance, and a dummy variable has used to examine the impact of employee size on the profitability. Further, the impact of bank-specific variables have controlled by the natural logarithm of loans and nonperforming loan ratio. A 1 percent increase in the VAIC increases 0.0043 percent profitability of CB and increases 0.0019 percent profitability of IB. The estimated coefficient values of VAIC indicate the CB in Pakistan are generating more value-added efficiency than IB. The IB banks are smaller in size than the CB. Therefore, the customer base of the Islamic banks in Pakistan is limited due to the limited understanding of Islamic principles. The estimated coefficient values of HCE indicate its highest positive impact to explain the profitability of IB than CB. This study concludes that IB, in Pakistan generates higher value from their investment in employees. Pakistan is a country that was established on Islamic ideology, it is, therefore, not challenging for the employees of Islamic banks to be more efficient than employees of conventional banks due to their diversified portfolio of banking products, which are based on Islamic principles and consistent with Sharia compliant.
This study suggests that an increase in the employee size decreases the bank's profitability of both CB and IB. The large employee size tends to reduce the average wage rate, which is the reason for employee dissatisfaction and lower productivity. Because in Pakistan, almost all private banks outsource their employees and deploy those employees in the core areas of business e.g. Deposits generation and financing. Those outsourced employees only fill the gaps and increase employee size, but generate less value than the permanent staff because of dissatisfaction due to lower remuneration. At the end of Dec 2016, the size of outsourced employees of all conventional and Islamic banks is 17,634 and 3,828 which is 15.88 percent and 19.85 percent of the total employees respectively. This is a higher ratio and requires the attention of the management [vi] .Total loans are an important bank-specific factor to translate the profitability of both CB and IB. Further, the estimated coefficient values of BSIZE determine their higher importance to explain the profitability of IB than the CB. The nonperforming loan ratio has the highest negative influence on the profitability of CB. Further, we find a higher risk ratio of CB than the IB in Pakistan.
These findings are useful for the academia for further research and for the banks’ management to make some policy decisions. Since, the VAIC has more contribution to translate the profitability of CB, so the Islamic banks in Pakistan should consider intellectual capital as an important area of the investment in order to enhance value-added efficiency and to sustain their competitive advantage. Knowledge, experience, and skill of the employee are important drivers of the value maximization, therefore, the investment in employees has potential to generate higher value for both IB and CB. The findings of this study suggest that an increase in the size of employees does not always maximize the value. We further suggest that the value of a firm can be maximized even with less number of employees if more satisfied and loyal. This study is limited to the banking industry of emerging market like Pakistan. The importance of VAIC and employee size can be compared with other emerging markets based on Islamic ideologies. Further, this study has used VAIC to compare the intellectual capital importance and used a dummy variable to examine/compare the impact and importance of employee size. Therefore, future studies can deploy other methods of intellectual capital to compare its importance and can use total number of employees to examine/compare the impact of employee size on the bank's profitability in Pakistan as well as other emerging markets.
Acknowledgment : “This work was supported by the National Natural Science Foundation of China no. 71701082 and 71271103. This work would not have been possible without their support. We thank all those who contributed in diverse ways in making the work complete.”
Al-Musali MA, Ismail KNIK (2016) Cross-country comparison of intellectual capital performance and its impact on financial performance of commercial banks in GCC countrie International Journal of Islamic and Middle Eastern Finance and Management 9:512-531, https://doi.org/510.1108/IMEFM-1103-2015-0029
Alhassan AL, Asare N (2016) Intellectual capital and bank productivity in emerging markets: evidence from Ghana Management Decision 54:589-609, https:// doi.org/510.1108/MD-1101-2015-0025
Berger AN, Molyneux P, Wilson JOS (2010) “Banking: an overview”, in Berger, A., Molyneux, P. and Wilson, J. (Eds), The Oxford Handbook of Banking Oxford University Press, Oxford:1-36
Bharathi DKG (2010) The Intellectual Capital Performance of Banking Sector in Pakistan Pak J Commer Soc Sci 4:84-99
Branco MC, Delgado C, Sousa C, Sa M (2011) Intellectual capital disclosure media in Portugal Corporate Communications: An International Journal 16:38-52
Goh PC (2005) Intellectual capital performance of commercial banks in Malaysia Journal of Intellectual Capital 6:385-396, https://doi.org/310.1108/14691930510611120
Joshi M, Cahill D, Sidhu J (2010) Intellectual capital performance in the banking sector: An assessment of Australian owned banks Journal of Human Resource Costing & Accounting 14:151-170, https://doi.org/110.1108/14013381011062649
Kamath GB (2007) The intellectual capital performance of the Indian banking sector Journal of Intellectual Capital 8:96-123, https://doi.org/110.1108/14691930710715088
Khan MMS, Yasse F, Hussain DT (2015) Intellectual Capital and Financial Performance: An Evaluation of Islamic Banks in Pakistan Islamic Banking and Finance Review 2:59-75
Latif M, Malik MS, Aslam S (2012) Intellectual Capital Efficiency and Corporate Performance In Developing Countries: A Comparison Between Islamic And Conventional Banks Of Pakistan Interdisciplinary Journal of Contemporary Research in Business 4:405-420
Mavridis DG (2004) Intellectual capital performance of the Japanese banking sector Journal of Intellectual Capital 5:92-115
Meles A, Porzio C, Sampagnaro G, Verdolive V (2016) The imapct of intellectual capital efficiency on commercial banks performance: Evidence from the US Journal of Multinational Financial Management 36
Mondal A, Ghosh SK (2012) Intellectual capital and financial performance of Indian banks Journal of Intellectual Capital 13:515-530. , https:// doi.org/510.1108/14691931211276115
Nawaz T, Haniffa R (2017) Determinants of financial performance of Islamic banks: an intellectual capital perspective Journal of Islamic Accounting and Business Research 8:130-142, https://doi.org/110.1108/JIABR-1106-2016-0071
Ozkan N, Cakan S, Kayacan M (2016) Intellectual Capital and Financial Performance: A Study of the Turkish Banking Sector Borsa istanbul Review doi: 10.1016/ j.bir.2016.03.001.
Pulic A (1998) Measuring the performance of intellectual potential in knowledge economy available at: http://wwwmeasuring-ipat/Opapers/Pulic/Vaictxtvaictxthtml
Pulic A (2000) VAIC - An Accounting Tool for IC Management International Journal of Technology Management 20
Pulic A (2001) Value Creation Efficiency Analysis of Croatian Banks 1996-2000 available at wwwvaic-onnet
Pulic A (2004) Intellectual capital – does it create or destroy value? Measuring Business Excellence 8:62-68, https://doi.org/10.1108/13683040410524757
Puntillo P (2009) Intellectual Capital and business performance. Evidence from Italian banking industry ЖУРНАЛ "КОРПОРАТИВНЫЕ ФИНАНСЫ 4:97-115
Rehman Wu, Rehman DHu, Usman M, Asghar N (2012) A Link of Intellectual Capital Performance with Corporate Performance: Comparative Study from Banking Sector in Pakistan International Journal of Business and Social Science 3:313-321
Stewart TA (1997) Intellectual Capital: The new wealth of organization Doubleday New York, NY, USA
Stewart TA (2007) The Wealth of Knowledge: Intellectual Capital and the Twenty-First Century Organization
Ting IWK, Lean HH (2009) Intellectual capital performance of financial institutions in Malaysia Journal of Intellectual Capital 10:588-599, https:// doi.org/510.1108/14691930910996661
Yalama A, Coskun M (2007) Intellectual capital performance of quoted banks on the Istanbul stock exchange market Journal of Intellectual Capital 8:256-271, https:// doi.org/210.1108/14691930710742835
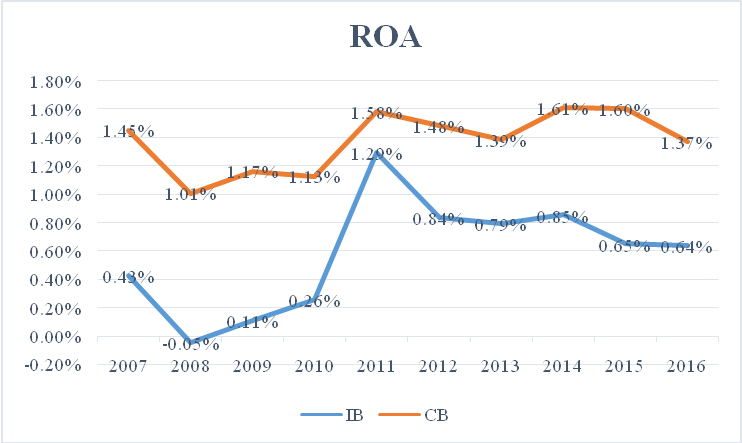
Figure1 1 : Profitability (ROA: return on assets) Comparison between Islamic and Conventional banks in Pakistan over the period 2007-2016.
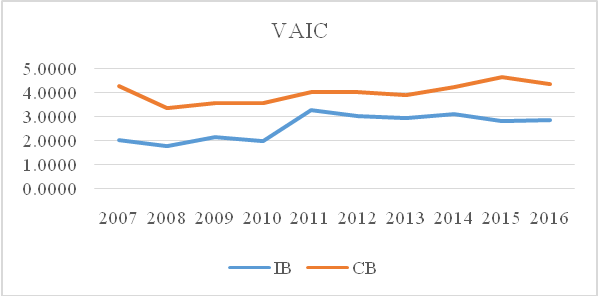
Figure 2: Value added intellectual coefficient (VAIC) comparison between Islamic and Conventional banks in Pakistan over the period 200-2017.
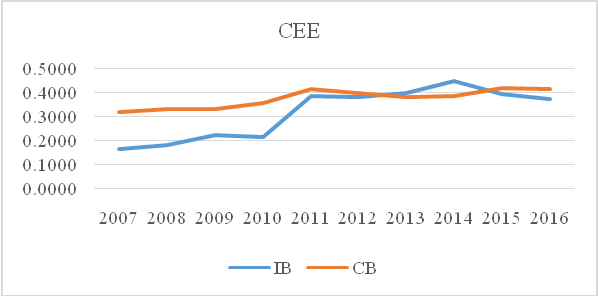
Figure 2a: Capital employed efficiency (CEE) comparison between Islamic and Conventional banks in Pakistan over the period 200-2017.
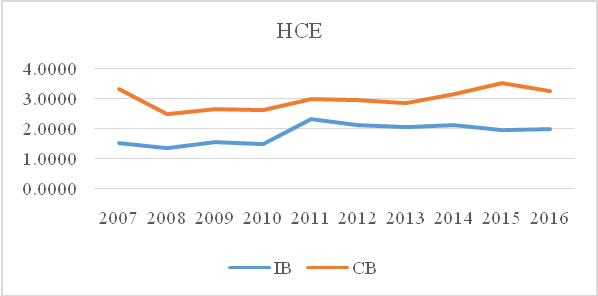
Figure 2b: Human capital efficiency (HCE) comparison between Islamic and Conventional banks in Pakistan over the period 200-2017.
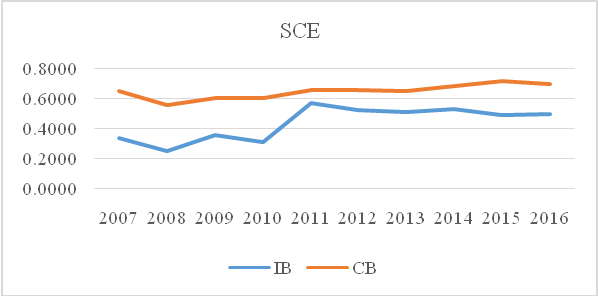
Figure 2c: Structural capital efficiency (SCE) comparison between Islamic and Conventional banks in Pakistan over the period 200-2017.
Table 1 : Performance comparison of Islamic and conventional banks over decade (2007-2016).
|
2007 |
2016 |
% Share 2007 |
% Share 2016 |
% Change |
||
|
Conventional Banks |
||||||
|
Value Added |
111,147,863 |
367,697,491 |
41.11 |
41.99 |
0.89 |
|
|
Assets |
3,507,529,516 |
11,063,794,077 |
73.49 |
72.09 |
-1.40 |
|
|
Loans |
1,864,057,253 |
3,717,364,577 |
75.30 |
68.17 |
-7.13 |
|
|
Deposits |
2,652,322,881 |
8,208,458,574 |
74.53 |
70.49 |
-4.05 |
|
|
Interest Income |
138,638,504 |
351,260,492 |
74.93 |
73.94 |
-0.99 |
|
|
Other Income |
56,349,741 |
137,201,658 |
66.94 |
70.09 |
3.15 |
|
|
Profit Before Tax |
71,892,181 |
236,757,993 |
66.75 |
77.58 |
10.83 |
|
|
Employees |
97,165 |
111,054 |
75.67 |
65.06 |
-10.61 |
|
|
ROA |
1.45 |
1.37 |
- |
- |
-0.08 |
|
|
Islamic Bank |
||||||
|
Value Added |
2,890,423 |
28,547,620 |
1.07 |
3.26 |
2.19 |
|
|
Assets |
111,875,754 |
1,146,113,801 |
2.34 |
7.47 |
5.12 |
|
|
Loans |
52,508,710 |
56,6215,967 |
2.12 |
10.38 |
8.26 |
|
|
Deposits |
85,184,005 |
967,810,543 |
2.39 |
8.31 |
5.92 |
|
|
Interest Income |
3,326,577 |
31,419,202 |
1.80 |
6.61 |
4.82 |
|
|
Other Income |
1,888,347 |
9,134,725 |
2.24 |
4.67 |
2.42 |
|
|
Profit Before Tax |
517,223 |
11,170,849 |
0.48 |
3.66 |
3.18 |
|
|
Employees |
4,064 |
19,280 |
3.17 |
11.30 |
8.13 |
|
|
ROA |
0.43 |
0.64 |
- |
- |
0.21 |
|
|
The values are based on the audited annual financial statements. All values are in rupees thousand except employees (in numbers) and ROA (in percentage).Conventional banks refer to the only private conventional banks and Islamic banks refer to the full-fledged Islamic banks. |
||||||
Table 2 : Trend in VAIC and its components
|
2007 |
2008 |
2009 |
2010 |
2011 |
2012 |
2013 |
2014 |
2015 |
2016 |
|
|
VAIC |
||||||||||
|
CB |
4.2854 |
3.3704 |
3.5899 |
3.5661 |
4.0445 |
4.0152 |
3.8977 |
4.2363 |
4.6532 |
4.3736 |
|
IB |
2.0038 |
1.7601 |
2.1275 |
1.9757 |
3.269 |
3.0059 |
2.9367 |
3.0811 |
2.8166 |
2.8553 |
|
CEE |
||||||||||
|
CB |
0.3173 |
0.3283 |
0.3303 |
0.3542 |
0.4129 |
0.399 |
0.381 |
0.386 |
0.4186 |
0.4164 |
|
IB |
0.1631 |
0.1806 |
0.2225 |
0.2144 |
0.3858 |
0.3789 |
0.3972 |
0.4462 |
0.3903 |
0.3723 |
|
HCE |
||||||||||
|
CB |
3.3172 |
2.4871 |
2.6593 |
2.6113 |
2.9751 |
2.9615 |
2.8697 |
3.1668 |
3.5193 |
3.2632 |
|
IB |
1.5051 |
1.3309 |
1.5502 |
1.4507 |
2.3151 |
2.1026 |
2.0317 |
2.109 |
1.9414 |
1.9864 |
|
SCE |
||||||||||
|
CB |
0.6509 |
0.555 |
0.6003 |
0.6007 |
0.6565 |
0.6546 |
0.647 |
0.6836 |
0.7153 |
0.6940 |
|
IB |
0.3356 |
0.2486 |
0.3549 |
0.3107 |
0.5681 |
0.5244 |
0.5078 |
0.5258 |
0.4849 |
0.4966 |
|
All values complied by the authors from audited financial statement. VAIC refers to valued-added intellectual capital coefficient, CEE is the capital employed efficiency, HCE is the human capital efficiency, SCE is the structural capital efficiency, CB refers to conventional banks and IB refers to Islamic banks. |
||||||||||
Table 3 : t-test comparison between Islamic and Conventional banks
|
ROA |
VAIC |
HCE |
SCE |
CEE |
|
|
CB |
0.0066594 |
3.269446 |
2.29394 |
0.6484413 |
0.3270647 |
|
IB |
-0.0005361 |
1.7922 |
1.481571 |
0.0378395 |
0.2727903 |
|
Diff. |
0.0071955 |
1.477246 |
0.8123697 |
0.6106019 |
0.0542744 |
|
t-value |
2.3483** |
4.1189*** |
3.1344*** |
2.9052*** |
0.8800 |
|
Obs. |
200 |
198 |
198 |
198 |
198 |
Table 4 : Statistics summary comparison
|
Obs. |
Mean |
SD |
Min |
Max |
|
|
CB |
|||||
|
ROA |
160 |
0.0066594 |
0.0180461 |
-0.0919992 |
0.0435536 |
|
VAIC |
158 |
3.269446 |
1.896311 |
-4.346488 |
7.993929 |
|
HCE |
158 |
2.29394 |
1.573455 |
-4.389133 |
5.803838 |
|
SCE |
158 |
0.6484413 |
0.8832901 |
-4.446823 |
5.286663 |
|
CEE |
158 |
0.3270647 |
0.3784025 |
-1.487679 |
3.525128 |
|
BSIZE |
160 |
18.50736 |
1.048418 |
15.36161 |
20.38377 |
|
ESIZE |
160 |
6344.194 |
4498.277 |
319 |
15417 |
|
Risk |
157 |
0.1424258 |
0.1047318 |
0.0027344 |
0.5620007 |
|
IB |
|||||
|
ROA |
40 |
-0.0005361 |
0.0140554 |
-0.0351991 |
0.019091 |
|
VAIC |
40 |
1.7922 |
2.481521 |
-10.11614 |
4.186252 |
|
HCE |
40 |
1.481571 |
0.8996578 |
-1.501443 |
2.731849 |
|
SCE |
40 |
0.0378395 |
1.986337 |
-10.21769 |
4.512626 |
|
CEE |
40 |
0.2727903 |
0.1836193 |
-0.1393728 |
0.6194074 |
|
BSIZE |
40 |
17.37877 |
0.9717173 |
14.77927 |
19.55701 |
|
ESIZE |
40 |
2656.35 |
2163.974 |
331 |
9168 |
|
Risk |
40 |
0.0681043 |
0.0571908 |
0 |
0.2282608 |
Table 5 : Estimated results of regression comparison
|
CB |
IB |
TB |
|||||||
|
ROA |
Model 1 |
Model 2 |
Model 1 |
Model 2 |
Model 1 |
Model 2 |
|||
|
VAIC |
0.0041*** (7.97) |
0.0020*** (2.88) |
0.0033*** (8.07) |
||||||
|
HCE |
0.0071*** (10.60) |
0.0164*** (5.26) |
0.0074*** (12.31) |
||||||
|
SCE |
-0.0008 (-1.01) |
0.0005 (1.03) |
-0.0001 (-0.24) |
||||||
|
CEE |
0.0022 (1.02) |
-0.0381 (-1.63) |
0.0024 (1.20) |
||||||
|
ESIZElarge |
-0.0058** (-2.51 ) |
-0.0039** (-1.99) |
-0.0133** (-2.32) |
-0.0090** (-2.75) |
-0.0074*** (-3.45) |
-0.0051*** (-2.90) |
|||
|
BSIZE |
0.0051*** (4.11) |
0.0034*** (3.12) |
0.0140*** (4.78) |
0.0096*** (3.48) |
0.0074*** (6.85) |
0.0043*** (4.68) |
|||
|
RISK |
-0.0796*** (-9.43) |
-0.0426*** (-4.90) |
-0.0209) (-0.67) |
0.0083 (0.42) |
-0.0737*** (-10.18) |
-0.0368*** (-5.28) |
|||
|
Const. |
-0.0916*** (-4.33) |
-0.0676*** (-3.70) |
-0.2437*** (-5.16) |
-0.1832*** (-4.21) |
-0.1317*** (-7.30) |
-0.0880*** (-5.76) |
|||
|
Year Effect |
Yes |
Yes |
Yes |
Yes |
Yes |
Yes |
|||
|
Obs. |
157 |
157 |
40 |
40 |
197 |
197 |
|||
|
AdjR2 |
0.7396 |
0.8118 |
0.6552 |
0.8948 |
0.7178 |
0.8148 |
|||
|
F-test |
35.07 |
45.86 |
6.70 |
23.11 |
39.35 |
58.49 |
|||
|
Prob>F |
0.0000 |
0.0000 |
0.0000 |
0.0000 |
0.0000 |
0.0000 |
|||
|
Het-Chi2 |
114.32 |
94.93 |
13.21 |
15.55 |
144.42 |
96.21 |
|||
|
Prob> Chi2 |
0.0000 |
0.0000 |
0.0003 |
0.0001 |
0.0000 |
0.0000 |
|||
|
Notes: Results of multiple regression are reported. CB presents the results of conventional banks, IB presents the results of Islamic banks. The dependent variable is ROA, a proxy of profitability. VAIC value added intellectual coefficient is a measure of intellectual capital. HCE is human capital efficiency, SCE is structural capital efficiency, CEE is capital employed efficiency, ESIZElarge is a dummy variable to examine the effect of large employee size, assigned the value 1 if the bank has large employees and 0 otherwise, and BSIZE represents bank size, measured as the natural logarithm of total advances, Risk is calculated as the ration between nonperforming loans to total loan. ***, **,* specifies the coefficient significance at 1%, 5% and 10% respectively. We report t-values in parenthesis. Total observation denoted by obs. AdjR2 is the notation of adjusted R2. Het-chi 2 denotes results of heteroskedasticity. |
|||||||||
Table 6 : Robust results of one time lagged independent variables and small employee size
|
CB |
IB |
TB |
|||||||
|
ROA |
Model 1 |
Model 2 |
Model 1 |
Model 2 |
Model 1 |
Model 2 |
|||
|
VAICt-1 |
0.0041*** (7.16) |
0.0001 (0.25) |
0.0026*** (5.82) |
||||||
|
HCEt-1 |
0.0049*** (5.25) |
0.0028 (0.45) |
0.0047*** (5.55) |
||||||
|
SCEt-1 |
0.0035*** (3.48) |
-0.0002 (-0.32) |
0.0012** (2.02) |
||||||
|
CEEt-1 |
-0.0003 (-0.06) |
0.0370 (0.73) |
-0.0008 (-0.19) |
||||||
|
ESIZEsmall |
0.0021 (0.82) |
0.0013 (0.50) |
0.0109** (2.28) |
0.0122** (2.25) |
0.0039 (1.65) |
0.0023 (0.96) |
|||
|
BSIZEt-1 |
0.0038*** (2.89) |
.0035** (2.56) |
0.0166*** (6.46) |
0.0126** (2.50) |
0.0059*** (5.16) |
0.0044*** (3.67) |
|||
|
Riskt-1 |
-0.0371*** (-4.02) |
-0.0332*** (-2.86) |
-0.0264 (-0.90) |
-0.0018 (-0.05) |
-0.0428*** (-5.41) |
-0.0269*** (-2.81) |
|||
|
Const. |
-0.0778*** (-3.23) |
-0.0730*** (-2.94) |
-0.2879 (-6.48) |
-0.2270*** (-2.85) |
-0.1108*** (-5.35) |
-0.0879*** (-4.11) |
|||
|
Year Effect |
Yes |
Yes |
Yes |
Yes |
Yes |
Yes |
|||
|
Obs. |
141 |
141 |
36 |
36 |
177 |
177 |
|||
|
AdjR2 |
0.6302 |
0.6284 |
0.6718 |
0.6566 |
0.5948 |
0.6154 |
|||
|
F-test |
20.88 |
17.91 |
6.97 |
5.78 |
22.53 |
21.12 |
|||
|
Prob>F |
0.0000 |
0.0000 |
0.0000 |
0.0000 |
0.0000 |
0.0000 |
|||
|
Het-Chi2 |
60.81 |
64.67 |
10.74 |
12.43 |
80.69 |
75.27 |
|||
|
Prob> Chi2 |
0.0000 |
0.0000 |
0.0010 |
0.0004 |
0.0000 |
0.0000 |
|||
|
Notes: Results of multiple regression is reported. CB presents the results of conventional banks, IB presents the results of Islamic banks. Dependent variable is ROA, a proxy of profitability. VAIC value added intellectual coefficient is a measure of intellectual capital. HCE is human capital efficiency, SCE is structural capital efficiency, CEE is capital employed efficiency, ESIZElarge is a dummy variable to examine the effect of large employee size, assigned value 1 if the bank has large employees and 0 otherwise, and BSIZE represents bank size, measured as natural logarithm of total advances, Risk is calculated as the ration between nonperforming loans to total loan. ***, **,* specifies the coefficient significance at 1%, 5% and 10% respectively. We report t-values in parenthesis. Total observation denoted by obs. AdjR2 is the notation of adjusted R2. Het-chi 2 denotes results of heteroskedasticity |
|||||||||
Appendix
Table A: List of banks included in this study
|
Private Conventional Banks |
Est. Date |
Size |
Islamic Banks |
|
Est. Date |
Size |
|||||||||
|
Allied Bank Ltd. |
01-Jul-1974 |
4 |
Al-Baraka Bank Pakistan Ltd. |
06-Apr-2006 |
24 |
||||||||||
|
Askari Bank Ltd. |
23-Feb-1992 |
9 |
Bank Islamic Pakistan Ltd. |
13-Mar-2006 |
20 |
||||||||||
|
Bank Al-Habib Ltd. |
21-Dec-1991 |
7 |
Dubai Islamic Pakistan Bank |
28-Mar-2006 |
21 |
||||||||||
|
Bank Al-Falah Ltd. |
01-Oct-1992 |
6 |
MCB Islamic Bank Ltd. |
15-Oct-2015 |
26 |
||||||||||
|
Faysal Bank Ltd. |
04-Dec-1994 |
13 |
Meezan Bank Ltd. |
28-Mar-2002 |
8 |
||||||||||
|
Habib Bank Ltd. |
25-Aug-1941 |
1 |
|||||||||||||
|
Habib Metropolitan Bank Ltd. |
26-Oct-2006 |
11 |
|||||||||||||
|
JS Bank Ltd. |
25-May-2006 |
15 |
|||||||||||||
|
MCB Bank Ltd. |
17-Aug-1948 |
5 |
|||||||||||||
|
NIB Bank Ltd. |
02-Oct-2003 |
16 |
|||||||||||||
|
SAMBA Bank Ltd. |
20-Oct-2008 |
25 |
|||||||||||||
|
Silk Bank Ltd. |
30-Apr-1995 |
23 |
|||||||||||||
|
Soneri Bank Ltd. |
17-Feb-1992 |
14 |
|||||||||||||
|
Standard Chartered Bank of Pakistan Ltd. |
30-Dec-2006 |
12 |
|||||||||||||
|
Summit Bank Ltd. |
01-Oct-2007 |
18 |
|||||||||||||
|
United Bank Ltd. |
09-Nov-1959 |
3 |
|||||||||||||
*The assets share of each banks determines its size. MCB Islamic banks is excluded from the regression model.
Table B: VAIC performance trend of each bank
|
2007 |
2008 |
2009 |
2010 |
2011 |
2012 |
2013 |
2014 |
2015 |
2016 |
2007-2016 |
|||||
|
Private Conventional Banks |
|||||||||||||||
|
ABL |
3.8184 |
3.3883 |
4.1980 |
4.2020 |
4.3646 |
4.2150 |
3.9513 |
4.6461 |
4.9175 |
4.4263 |
4.2128 |
||||
|
ASBL |
3.0834 |
1.8827 |
2.3403 |
2.1700 |
2.6441 |
2.3118 |
1.5386 |
3.2384 |
3.5895 |
3.2772 |
2.6076 |
||||
|
BAHL |
4.7152 |
4.2780 |
4.4080 |
4.5243 |
4.6021 |
4.6423 |
3.9244 |
4.0715 |
4.0880 |
3.9334 |
4.3187 |
||||
|
BAFL |
3.6493 |
2.5250 |
2.1947 |
2.3265 |
3.2279 |
3.1563 |
2.8450 |
2.9064 |
3.4566 |
3.4016 |
2.9689 |
||||
|
FBL |
3.9849 |
3.3412 |
2.7239 |
2.1689 |
2.2635 |
2.3138 |
2.3590 |
2.6281 |
3.6898 |
3.4138 |
2.8887 |
||||
|
HBL |
3.4326 |
3.5460 |
3.7625 |
4.1500 |
4.3015 |
4.2424 |
4.1549 |
4.6003 |
4.9535 |
4.5002 |
4.1644 |
||||
|
HMBL |
6.3908 |
5.5473 |
4.5908 |
4.0523 |
3.9837 |
3.8136 |
3.5882 |
4.1018 |
5.1221 |
4.3132 |
4.5504 |
||||
|
JSBL |
2.0373 |
1.9833 |
1.5800 |
-0.4160 |
2.5365 |
2.8833 |
2.1951 |
2.9589 |
3.5617 |
3.2400 |
2.2560 |
||||
|
MCBL |
6.3653 |
5.6776 |
5.9716 |
6.0286 |
6.2157 |
5.8786 |
6.1308 |
6.6147 |
7.0200 |
6.5074 |
6.2410 |
||||
|
NIBL |
0.1515 |
-0.5546 |
2.0225 |
-1.1753 |
4.0362 |
1.7439 |
2.6085 |
1.5669 |
3.5597 |
2.1579 |
1.6117 |
||||
|
SAMBL |
-0.1716 |
4.5889 |
2.8198 |
1.1763 |
1.9782 |
1.8959 |
1.5993 |
2.2371 |
2.6961 |
2.8804 |
2.1700 |
||||
|
SILBL |
-4.3465 |
-0.2910 |
-1.8163 |
-0.5527 |
3.1084 |
1.3436 |
3.0450 |
1.8076 |
-0.6745 |
2.3945 |
0.4018 |
||||
|
SONBL |
`- |
3.9082 |
2.5077 |
2.2294 |
3.0964 |
3.2525 |
3.0542 |
3.2465 |
3.6708 |
3.3338 |
3.1444 |
||||
|
SCBPL |
- |
2.1448 |
2.1735 |
3.2611 |
3.8757 |
3.8903 |
5.3726 |
4.9669 |
4.8277 |
7.9939 |
4.2785 |
||||
|
SUMBL |
3.7651 |
-4.2526 |
0.6816 |
-1.5066 |
1.2769 |
4.9360 |
3.8729 |
1.7864 |
2.2980 |
3.0704 |
1.5928 |
||||
|
UBL |
4.2584 |
4.3624 |
4.0783 |
4.7224 |
5.1892 |
5.1111 |
4.9882 |
5.2775 |
5.8712 |
6.0595 |
4.9918 |
||||
|
Total |
4.2854 |
3.3704 |
3.5899 |
3.5661 |
4.0445 |
4.0152 |
3.8977 |
4.2363 |
4.6532 |
4.3736 |
- |
||||
|
Islamic Bank |
|||||||||||||||
|
ABBPL |
0.4914 |
-3.9502 |
4.1863 |
0.0252 |
2.6348 |
-10.1161 |
1.5160 |
1.9519 |
2.1479 |
1.3607 |
0.0248 |
||||
|
BIPL |
0.7186 |
0.7963 |
-0.0248 |
2.2687 |
3.0043 |
2.7868 |
2.1305 |
2.2286 |
1.4483 |
2.2776 |
1.7635 |
||||
|
DIBPL |
-0.4858 |
1.2385 |
2.6173 |
1.8632 |
2.1069 |
2.6076 |
1.9535 |
2.5675 |
2.2610 |
2.5891 |
1.9319 |
||||
|
MBCIL |
- |
- |
- |
- |
- |
- |
- |
- |
2.3498 |
1.5794 |
0.3929 |
||||
|
MBL |
3.7003 |
2.9605 |
3.3046 |
3.2138 |
3.9188 |
3.9163 |
3.7326 |
3.7069 |
3.6350 |
3.6022 |
3.5691 |
||||
|
Total |
2.0038 |
1.7601 |
2.1275 |
1.9757 |
3.2690 |
3.0059 |
2.9367 |
3.0811 |
2.8166 |
2.8553 |
- |
||||
*Complied by the authors from audited financial statements.
Table C:Employees Comparison
|
2007 |
2008 |
2009 |
2010 |
2011 |
2012 |
2013 |
2014 |
2015 |
2016 |
|||
|
Total Employees |
||||||||||||
|
CB |
97,165 |
100,299 |
94,639 |
98,371 |
101,370 |
101,184 |
102,182 |
103,797 |
105,010 |
111,054 |
||
|
IB |
4,064 |
5,883 |
6,991 |
8,023 |
9,204 |
10,633 |
11,402 |
14,093 |
17,273 |
19,280 |
||
|
TB |
101,229 |
106,182 |
101,630 |
106,394 |
110,574 |
111,817 |
113,584 |
117,890 |
122,283 |
130,334 |
||
|
Outsourced Employees |
||||||||||||
|
CB |
18,873 |
23,920 |
20,734 |
22,850 |
23,150 |
24,146 |
20,893 |
19,953 |
18,996 |
17,634 |
||
|
IB |
790 |
815 |
1,184 |
1,216 |
1,685 |
2,009 |
2,171 |
2,792 |
3,402 |
3,828 |
||
|
TB |
19,663 |
24,735 |
21,918 |
24,066 |
24,835 |
26,155 |
23,064 |
22,745 |
22,398 |
21,462 |
||
|
Outsource Ratio |
||||||||||||
|
CB |
19.42% |
23.85% |
21.91% |
23.23% |
22.84% |
23.86% |
20.45% |
19.22% |
18.09% |
15.88% |
||
|
IB |
19.44% |
13.85% |
16.94% |
15.16% |
18.31% |
18.89% |
19.04% |
19.81% |
19.70% |
19.85% |
||
|
TB |
19.42% |
23.29 % |
21.57 % |
22.62 % |
22.46 % |
23.39 % |
20.31 % |
19.29 % |
18.32 % |
16.47 % |
||
*Compiled by the authors from notes to the audited financial statements. Outsource ratio is calculated as total number of outsourced employee divided by total number of employees.
[i] Information accessed from State Bank of Pakistan ( The central bank), available at: http://www.sbp.org.pk/publications/Pub-Ann.htm
[ii] MCB Islamic bank was established on dated 14 September 2015, therefore it has been excluded from the regression model. But the results of Islamic banking industry-IB translate the effect of MCB Islamic banks for the year 2015 and 2016 in all figures and tables except Table 4, Table 5 and Table 6.
[iii] 5606 is the employee mean value of 20 banks.
[iv] ,7 The 10 years average of investment to asset ratio and nonperforming loan ratio is calculated from the available audited financial reports over the period 2007-2016.
[v] The results are not reported due to the space and considering the words margin. However, the results are available if requested.
[vi] Estimated from the notes to the audited financial statements. We also provide a detail comparison of outsourced ratio between conventional and Islamic banks (For comparison see Appendix Table C).