Pacific B usiness R eview I nternational

A Refereed Monthly International Journal of Management Indexed With THOMSON REUTERS(ESCI)
|
Rozy Dhanta Research Scholar Shoolini University of Biotechnology and Management Sciences Solan, Himachal Pradesh, India E-mail:- roseydhanta@shooliniuniversity.com |
YS Negi Professor Shoolini University of Biotechnology and Management Sciences Solan, Himachal Pradesh, India E-mail:- ysnegi@shooliniuniversity.com |
This paper explores the levels of crop diversification and growth of major agricultural crops in the north Indian state of Himachal Pradesh. The district wise analysis considers major crops viz. maize, paddy, wheat, barley, pulses, apple, ‘other fruits’, potato and ‘other vegetable’ and oilseeds for the calculation of Herfindahl-Hirschman’s Index (HHI) using past 44 years of data. The results show that Shimla district can be categorized in moderately diversified district of the state and it is followed by Kullu and Sirmour districts. Similarly, least diversified districtis Hamirpur followed by Una and Bilaspur districts. Vegetables, spices, apple, and ‘other fruits’ turned out to be emerging crops in the state. The emphasis in the state is on diversification with high value crops and as a result acreage under cereals like wheat, barley and ‘other cereals’ is not seen to be growing at the same rate as the high value crops. The study suggests the need to look at the increasing crop diversification in a way that would equally benefit the marginal and small farmers as well. Here, marketing of the produce, particularly the highly perishable fruits and vegetables needs to be considered in a more practical way.
Key Words: Crop diversification, Compound growth rate, Herfindahl-Hirschman’s Index (HHI), Emerging crops
Indian agriculture has experienced a significant change since 1990s, with farmers incorporating more of horticultural crops and other commercial crops in their cropping system (Nadkarni, 1996; Joshi et.al, 2004). Although the ‘green revolution’ in the 1960s brought a significant change in crop productivities in the country, yet Indian agriculture still remains burdened withmany problems. These include mainly the dominance of marginal and small farmers, rural poverty, seasonal and disguised unemployment, dependency on monsoons and low level of mechanization. All these impact development of agriculture, particularly diversification with high value crops. To achieve balanced growth of agriculture, location specific farming strategies shall have to be pursued and agriculture potentials of each region, for which it has a comparative advantage, shall have to be harnessed to meet the emerging challenges. Diversification of agriculture in favor of more competitive and high value commodities is reckoned as an important strategy to augment farm income, stabilize income flows, generate employment, increase efficiency of resource utilization, help to secure food and nutritional security, alleviate poverty and conserve precious soil and water resources (Pingali and Rosegrant, 1995; Chand, 1995).The crop diversification has made a profound impact on the quality of life of cultivating households. The often seen marginalized hill areas have also benefited from crop diversification, and development story of some hilly areas like Himachal Pradesh amply reflect this fact. At the macro or the state level, this impact in Himachal Pradesh is apparent in improvement in a number of socio-economic indicators that compare favorably both with other mountainous areas as well as with developed states of the country. The micro level experiences further show that crop diversification towards high value crops is economically beneficial and also reduces stress on natural resource base (Chand,1996;Sharma,1996;Sharma and Chauhan, 2008) which is so crucial for sustainability of hill agriculture.
Diversification provides an indirect insurance against various vagaries affecting monoculture and broadens the income base of the rural households. Improvements in incomes are of crucial importance to people in mountainous areas of the country that are highly dependent on agriculture and further have a low proportion of land; for example only 11 percent of the total area in Himachal Pradesh is under agriculture. The micro niche specific exploitation of potential for agriculture can thus be best harnessed through diversification of crops.
Himachal Pradesh has emerged as a leading producer of fruits and ‘off-season’ vegetables in the country. It is now taken as a model of agricultural development for other mountainous states of the country. Agriculture diversification towards fruitsand vegetable crops in the state started early in late 1960s and has gained momentum over time. It is against this background that the present paper aims at exploring and analyzing the growth and diversification of agriculture sector in the state, both at state and district levels.
The scientific inquiries accomplished through systematic thinking, factual observations and past experiences, provide a sound knowledge base for future research in a chosen field. Before initiating any study, a critical glance on the related works already conducted in the field is important for conceptual clarity and raising important issues. For this reason, this section reviews selected research work conducted on the issues of interest in the present study.
Diversification is a sort of indirect insurance against climatic and biological vagaries affecting monoculture and is a process of broadening the income sources of rural households (Barghouti et al ., 1990). The problem of income improvement of rural households is more serious in mountainous states which are relatively more dependent on agriculture and where only a small proportion of the total geographical area is available for agri-horticulture activities. In Himachal Pradesh, for example, only 11 per cent of the total area is available for agriculture and further the number of farm holdings having less than 2 hectares of land is more than 85 percent. The average size of holding in the state works out to be 1.10 hectares. The crop diversification is recommended as an effective strategy in raising incomes, generating employment opportunities and alleviating poverty (Vyas 1996; Joshi et al, 2007) and for hills a niche specific focus on diversification would be crucial.
In Himachal Pradesh crop diversification has been found to help in socio-economic development of people both at macro and micro level. Increased level of production and also the variety of produce coming as a result of crop diversification through high value crops results in improvements in income and employment, poverty reduction and at the micro level in better utilization of local natural resource base (Chand, 1996; Sharma, 1966, 2005; Sharma & Chauhan, 2008) and the state has attracted the attention of development economists and policy analysts for being a model for other hilly/mountainous states (Dereze and Sen, 2002).
Gupta and Tiwari (1985) studied the factors affecting crop diversification and found that diversification potential was high on Indian farms because it stabilizes the farm on higher level of efficiency under the conditions of risk and uncertainty. It was proved empirically that initial thrust on diversification promoting policies finally leads to betterment in economic conditions of farmers.
Moorti and Negi (1983) in their study on farming systems in Himachal Pradesh found the state agriculture at the subsistence level. Cereals dominated the cropping pattern and except for cash crops like potato and vegetables, marketable surplus was almost negligible. Shortage of farm implements was found to lead to underutilization of labour. The study suggested that for the improvement of farming systems, technical knowhow should be extended to the farmers particularly on the aspects like land improvements, soil conservation and management of the cropping pattern.
Chand (1995) conducted a study on potential and prospectus of agriculture diversification in Himachal Pradesh. The author found that crop diversification had declined over time in the low hill zone, while the dry temperate zone was the most diversified zone in the state. Diversification of agriculture through vegetables was affected by infrastructure availability and socioeconomic conditions of households. The author suggested identification of potential areas for diversification of agriculture in the state and these should be developed as specialized pocket to produce sufficiently large marketable surplus so that marketing operations by public institution or private agencies become viable. In another study, the author again pointed out that strategy for the agriculture diversification should be location specific and suggested that policy of developing whole state through fruits crops should be given a second thought as many areas in the state do not have or have lost the comparative advantage in the fruit production (Chand,1996).
De and Chattopadhyay (2010) examined the nature and extent of crop diversification in West Bengal, for the period of 1970 to 2005. They concluded that small and marginal farmers play a positive role in crop diversification in West Bengal. The study further emphasized that agricultural diversification was supported by various infrastructural networks during the period under consideration.
Rehima et al. (2013) investigated the determinants of crop diversification using data on the three stage randomly selected 393 farm households in SNNPR of Ethiopia. They suggested that the government should promote female participations, invest on formal and informal education of farmers, provide incentive for extension worker and improve the extension system. Furthermore, the government and stakeholders should strengthen agricultural inputs delivery system and agricultural researches for generating agroecology based technologies and disseminate the same. Non-crop activities (trade experience) and social organizations underline the need for designing integrated agriculture system (crop-non crop) and improving social organizations as powerful tools to increase diversification capacity of the farmers. Transaction costs need strengthening rural urban infrastructure to link crop diversification with markets.
Sharma and Mohan (2013) studied prospectus and challenges of diversification in the state of Punjab. The study revealed that there was a great prospect to diversify the entire economic base of Punjab. Non-farm activities can provide ultimate solution to the raising socio-economic states of the state and the authors suggested the need to promote appropriate infrastructure, better institutional management, government accountability, better education, health facility, skill and vocational training to bring the economy of Punjab out of severe agrarian crises and place the state on the path of growth and prosperity.
3.1 Objective : Against this background the present paper addresses the following issues.
· Analyze the spatial and temporal changes in area under different crops in Himachal Pradesh
· To assess the trends in crop diversification in the state.
3.2 Sampling design
This paper is based on the secondary data on crop acreage and related data collected from the public agencies, mainly from the Directorate of Land Records, and the Directorate of Horticulture of the government of Himachal Pradesh. The study pertains to the time period 1972-73 to 2015-16. Himachal emerged as the 18thstate of the Indian Union in 1971 and thus the consolidated required data are available from 1972-73 onwards. Administratively, the state is divided into twelve districts viz., Bilaspur, Chamba, Hamirpur, Kangra, Kinnaur, Kullu, Lahaul &Spiti, Mandi, Shimla, Solan, Sirmour and Una. For the sake of getting a temporal picture of agricultural growth and crop diversification, the whole study period has been divided into five periods viz., period-I (1972-72 to 1981-82), period-II (1982-83 to 91-92), period-III (1992-93 to 2001-02), period-IV (2002-03 to 2010-11) and period-V (2011-12 to 2015-16).
3.3 Research Tools
To access the magnitude of crop diversification, Herfindahl-Hirschman’s Index (HHI)of diversification has been used. The index is widely used in literature including for the study of agricultural diversification. The index is computed on the basis of proportion of gross cropped area under different crops cultivated in a particular geographical area.
Herfindahl-Hirschman’s Index (Dh )
Dh =
Where, N is the total number of crops being grown and Pi is the proportion of area under ith crop. Herfindahl-Hirschman Index, defined as a sum of squares of all N proportions, is a measure of concentration (Gupta and Tewari, 1985). The value decreases with increase in diversification. When there is complete specialization the takes a value one and approaches zero when there is perfect diversification.
Compound annual growth rate (CAGR):
Compound growth rates have been worked out by fitting the exponential function to the figures of acreage and production of major crops for the period of 1972-73 to 2015-16. This analysis has been done district wise and for the state as a whole. The ordinary least square method (OLS) has been used to fit the exponential function for computing CAGRs. The general form of the function used is Y = and the same has been converted into a linear function with the help of logarithmic transformation as under:
Log Y = Log a + t Log b
Where, Y is dependent variable (acreage, production, productivity etc), ‘t’ is the independent variable (time in years). Compound growth rate is calculated by using the following formula.
CGR = (b-1) × 100
4.1 Nature and trend of cropping pattern
Compound growth rates of gross cropped area of major crops i.e . maize, paddy, wheat, barley, pulses, food grain, apple, ‘other fruits’, potato, other vegetables, and oil seeds have been estimated for the time period 1972-73 to 2015-16. Table 1 shows the period wise compound growth rates in area under different crops. These growth rates have also been presented for the overall period as well. The idea behind perusing the period wise growth in crop acreage was to perceive the time and magnitude of acreage shift in different crops. The results presented in the two tables are discussed together to get a comprehensive trend about the changes in crop acreage over time and space.
It is evident from Table 1 that the area under most crops has gone down in the state during the time periods under consideration. It is seen that area under paddy, barley, total pulses, total food grains, and oilseeds declined during different time periods under consideration. Overall, the area under maize is seen to have increased, though at a slow rate of 0.227 percent per annum. However, the current trend, as perceived from the result for the latest period is that of decline in area under the crop. The positive growth in crop acreage were noted in case of apple and ‘other fruits’ and in the crop group of ‘other vegetables’. Highest positive growth was noted in case of ‘other fruits’ where an annual growth of 6.38 percent was recorded for the period under consideration. One of the reasons for this is the policy emphasis of the state government to promote fruit farming in the traditionally non-fruit growing sub-tropical areas of the state.
The district wise results of the similar analysis for the overall study period suggest that at the state level, maize acreage recorded a highest positive growth (2.65%) in Lahaul &Spiti(L&S) and the least (0.28%) in Chamba. Area under maize is seen to have declined in Kinnaur, Shimla, Solan and Sirmour districts. The highest decline in maize acreage has been in Kinnaur, followed by the decline in Shimla district. Paddy acreage, however, is seen to have declined in all the districts of the state, except in case of Sirmour district where the paddy acreage increased at a compound growth rate of 0.51 percent per annum. Again, area under wheat is seen to be declining or growing at a low rate in most districts; these results indicated that cereal and other food grain crops are losing favour with Himachal farmers. Wheat is the main Rabi season crop in the state and the decline in area under the crop in the four districts indicates that other remunerative possibilities for the season are there in these districts. But acreage increase under the crop in other districts also suggests that in spite of the fact that the state is moving towards cultivation of cash crops some traditional crops are still grown, probably as a risk averting strategy, and also may be farmers’ resources do not allow them to shift to cultivation of high value crops on a large scale. Oilseed crops have not shown any major change as most of the districts are seen to have recorded negative growth rates in area under oilseeds, and even in the districts which show positive growth rate the rate of growth it is not of very high magnitude.
Growth in horticultural crops has been relatively high in all the suitable districts of the state for growing fruits and vegetables. Area under apple increased at an impressive rate of about 23.8 percent per annum in case of Kangra district. In this regard, Kangra is followed by Lahaul & Spiti, which recorded a growth of 16.23 percent per annum, and Chamba with a CAGR of 10.76 percent. Overall, in case of horticultural crops, fruits especially apple, have shown maximum of positive growth for area under the crop. Potato is one of the important vegetable crops of the state and the rate of growth of average under the crop is positive in the state except in Kinnaur, Solan and Shimla districts. One of reasons for decline of area under potato in these districts is the emergence of other vegetables in these districts. Lahaul & Spiti district recorded the highest (14.46%) growth in area under the category ‘other vegetables’.
This analysis clearly shows that cultivation of food crops like cereal crops and oilseeds are not gaining momentum. However, fruits and vegetables are becoming important components of the cropping patterns in the state. Improved basic and marketing infrastructure and economic profitability of the crops are the major factors affecting this change.
Table 1: Period wise CAGR of area under major crops in Himachal Pradesh
|
Crops |
Periods |
|||||
|
P-I |
P-II |
P-III |
P-IV |
P-V |
Overall |
|
|
Maize |
0.936 |
0.898 |
-0.475 |
0.071 |
-0.310 |
0.227 |
|
Rice |
-0.645 |
-1.076 |
-0.485 |
-0.943 |
-1.597 |
-0.670 |
|
Wheat |
1.518 |
-0.049 |
-0.245 |
-0.237 |
-2.081 |
0.136 |
|
Barley |
-1.970 |
-3.011 |
-0.739 |
-1.249 |
-4.233 |
-1.642 |
|
Total pulses |
-2.327 |
-0.624 |
-3.226 |
-0.383 |
-2.019 |
-2.290 |
|
TFG |
0.304 |
-0.096 |
-0.530 |
-0.379 |
-1.422 |
-0.246 |
|
Apple |
6.182 |
5.918 |
3.312 |
4.276 |
2.714 |
4.723 |
|
Other fruits |
2.512 |
0.670 |
7.196 |
-0.968 |
2.523 |
6.379 |
|
Potato |
0.695 |
1.602 |
0.898 |
0.784 |
3.820 |
-0.098 |
|
Other vegetables |
4.312 |
3.917 |
2.895 |
8.036 |
4.521 |
3.666 |
|
Total oilseed |
-1.820 |
-0.287 |
-2.569 |
-1.304 |
-6.665 |
-1.177 |
Table 2(A): Districts wise CAGR of area under major cereal crops in Himachal Pradesh
|
Districts |
Cereal Crops |
Pulses |
Total foodgrains |
|||
|
Maize |
Paddy |
Wheat |
Barley |
|||
|
Bilaspur |
0.49 |
-2.980 |
0.555 |
-1.401 |
-10.277 |
-0.027 |
|
Chamba |
0.28 |
-0.131 |
0.532 |
-1.344 |
0.102 |
0.098 |
|
Hamirpur |
0.59 |
-2.801 |
0.425 |
-3.083 |
-14.410 |
-0.140 |
|
Kangra |
0.39 |
-0.029 |
0.476 |
-1.538 |
-3.381 |
0.102 |
|
Kinnaur |
-2.20 |
-6.185 |
-5.755 |
-2.816 |
5.242 |
-2.369 |
|
Kullu |
0.66 |
-2.299 |
0.484 |
-1.592 |
0.247 |
-0.109 |
|
L&S |
2.65 |
- |
-6.033 |
-2.475 |
2.177 |
-1.073 |
|
Mandi |
0.71 |
-0.865 |
0.660 |
-1.238 |
-0.478 |
0.089 |
|
Shimla |
-2.08 |
-4.054 |
-3.381 |
-2.624 |
0.734 |
-2.653 |
|
Sirmour |
-0.46 |
0.511 |
-0.538 |
-0.927 |
-1.256 |
-0.439 |
|
Solan |
-0.08 |
-1.164 |
0.453 |
-0.020 |
-4.500 |
-0.374 |
|
Una |
0.50 |
-0.391 |
0.778 |
-8.491 |
-9.502 |
0.134 |
|
Total H.P. |
0.227 |
-0.670 |
0.136 |
-1.642 |
-2.290 |
-0.246 |
Table 2(B): Districts wise CAGR of area under major cereal crops in Himachal Pradesh
|
Districts/crops |
Fruits |
Vegetables |
Oilseeds |
||
|
Apple |
Other fruits |
Potato |
Other vegetables |
||
|
Bilaspur |
3.402 |
4.015 |
0.904 |
4.849 |
-2.560 |
|
Chamba |
10.759 |
4.355 |
1.457 |
5.053 |
0.427 |
|
Hamirpur |
- |
11.489 |
0.622 |
2.819 |
-4.438 |
|
Kangra |
23.746 |
7.468 |
1.831 |
3.515 |
-2.462 |
|
Kinnaur |
9.179 |
2.625 |
-2.565 |
6.760 |
-9.719 |
|
Kullu |
5.405 |
7.872 |
0.800 |
5.525 |
0.682 |
|
L&S |
16.230 |
10.426 |
-0.095 |
14.465 |
2.515 |
|
Mandi |
2.987 |
5.532 |
0.817 |
5.807 |
-0.030 |
|
Shimla |
4.502 |
17.309 |
-1.699 |
4.171 |
0.741 |
|
Sirmour |
1.445 |
4.889 |
1.222 |
8.118 |
-0.013 |
|
Solan |
-1.642 |
3.844 |
-1.751 |
4.864 |
-2.423 |
|
Una |
- |
8.485 |
6.289 |
2.073 |
0.840 |
|
Total H.P. |
4.723 |
6.379 |
-0.098 |
3.666 |
-1.177 |
Source: Computed form data emanating from Annual Season and Crop Report, Directorate of Land Records, and the Directorate of Horticulture, Himachal Pradesh.
4.2 Crop diversification over space and time
Table 3presents the pattern of crop diversification over time in the state. In the beginning, during the decade ending 1981-82, the level of diversification was highest in Shimla district, with a HHI value of 0.177. The other most diversified districts were Kullu and Mandi. However, most districts were found to be moderately diversified as per the categorization of diversification (HHI <0.150 = highly diversified, 0.150-0.300= moderately diversified, 0.301-0.450= less diversified and >0.450= specialized ). On this basis Chamba, Kangra, Kullu, L&S, Mandi, Shimla, Sirmour, Solan and Una were found to be moderately diversified districts of the state, whereas, Bilaspur (0.314), Kinnaur (0.302) and Hamirpur (0.325) were found to be the less diversified districts of the state during this first period. In period-II i.e. Chamba, Kangra, Kullu, L&S, Mandi, Shimla, Sirmour and Solan were again moderately diversified districts, with HHI value of 0.173,Shimla was again noted to be relatively more diversified district than others. The HHI value for Kangra district worked out to be 0.280 and which was highest for the districts grouped in moderately diversified districts. This indicates that though the district was moderately diversified in this period yet the level of diversification was lowest in Kangra relative to other districts falling in this group. Further, in this period, Bilaspur (HHI = 0.331), Hamirpur (0.417), Kinnaur (0.331) and Una (0.372) were found to be less diversified districts of the state. Almost the similar trend was found in period III where Bilaspur (0.341), Hamirpur (0.445), Kinnaur (0.341)and Una (0.370) were again noted to be least diversified districts. The comparative results of period II and period III suggest that not much of changes were there in crop composition or new crop introductions during the period (1982-83 to 2001-02) in these districts.
In period IV and V, seen in terms of acreage changes under a given crop, again there was not much of perceptible changes in the ranking or positions of different districts with regards to agricultural diversification. Chamba, Kangra, Kullu, L&S, Mandi, Shimla, Sirmour and Solan emerged as moderately diversified districts of the state, while Bilaspur, Hamirpur, Kinnaur and Una were lesser diversified districts.
In the overall state level analysis it can be noted that Chamba, Kangra, Kullu, L&S, Mandi, Shimla, Sirmour and Solan were moderately diversified whereas, Bilaspur, Hamirpur, Kinnaur and Una were found less diversified districts of the state.
Table 3: District and period wise HHI values of crop diversification
|
District |
Period and HHI value |
|||||
|
P-I |
P-II |
P-III |
P-IV |
P-V |
Overall |
|
|
Bilaspur |
0.302 |
0.331 |
0.341 |
0.362 |
0.344 |
0.335 |
|
Chamba |
0.261 |
0.273 |
0.281 |
0.282 |
0.309 |
0.278 |
|
Hamirpur |
0.314 |
0.417 |
0.445 |
0.454 |
0.350 |
0.400 |
|
Kangra |
0.249 |
0.280 |
0.271 |
0.284 |
0.292 |
0.273 |
|
Kinnaur |
0.302 |
0.331 |
0.341 |
0.362 |
0.320 |
0.332 |
|
Kullu |
0.208 |
0.217 |
0.239 |
0.227 |
0.252 |
0.226 |
|
L&S |
0.270 |
0.242 |
0.252 |
0.297 |
0.275 |
0.267 |
|
Mandi |
0.239 |
0.270 |
0.281 |
0.278 |
0.281 |
0.268 |
|
Shimla |
0.177 |
0.173 |
0.168 |
0.204 |
0.214 |
0.184 |
|
Sirmour |
0.253 |
0.262 |
0.242 |
0.217 |
0.268 |
0.246 |
|
Solan |
0.248 |
0.276 |
0.284 |
0.287 |
0.309 |
0.277 |
|
Una |
0.302 |
0.372 |
0.370 |
0.381 |
0.353 |
0.355 |
Data Source: Directorate of Land Records, Govt. of H.P., Shimla.
Note: <0.150 = Highly Diversified, 0.150-0.300= Moderately Diversified, 0.301-0.450= Less
Diversified and >0.450= Specialized
Table 4 summarizes the results regarding the acreage based diversification status of different districts of the state. This summarization of the results makes it clear that throughout the period under consideration Shimla district has maintained its place as the most diversified district of the state. Shimla is followed by Kullu and Sirmour. Similarly, least diversified districts is Hamirpur followed by Una and Bilaspur. It is interesting to note that none of the districts of the state could be categorized as the highly diversified or fully specialized district. This indicates that farmers of the state are experimenting with the cropping patterns with different combinations and as yet have not developed the confidence to go for specialization or for drastically changing the established cropping patterns. Nevertheless, possibility of categorization of a number of districts into moderately diversified districts suggests that the process of diversification is on and additional changes are expected in times to come. Though not directly the part of this paper but the field experiences suggest that farmers are also diversifying in terms of varieties of a given crop and are experimenting with identifying production niches for various crops.
Table 4: Spatio-temporal status of crop diversification in Himachal Pradesh
|
Particulars |
Period and districts |
|||||
|
P-I |
P-II |
P-III |
P-IV |
P-V |
Overall |
|
|
Most Diversified |
Shimla, Kullu, Mandi |
Shimla, Kullu, L&S |
Shimla, Kullu, Sirmour |
Shimla, Kullu, Sirmour |
Shimla, Kullu Sirmour |
Shimla, Kullu Sirmour |
|
Least Diversified |
Hamirpur, Kinnaur, Bilaspur |
Hamirpur, Kinnaur, Una |
Hamirpur, Kinnaur, Una |
Hamirpur, Kinnaur, Una |
Hamirpur, Una, Bilaspur |
Hamirpur, Una, Bilaspur |
o Identification of major emerging crops
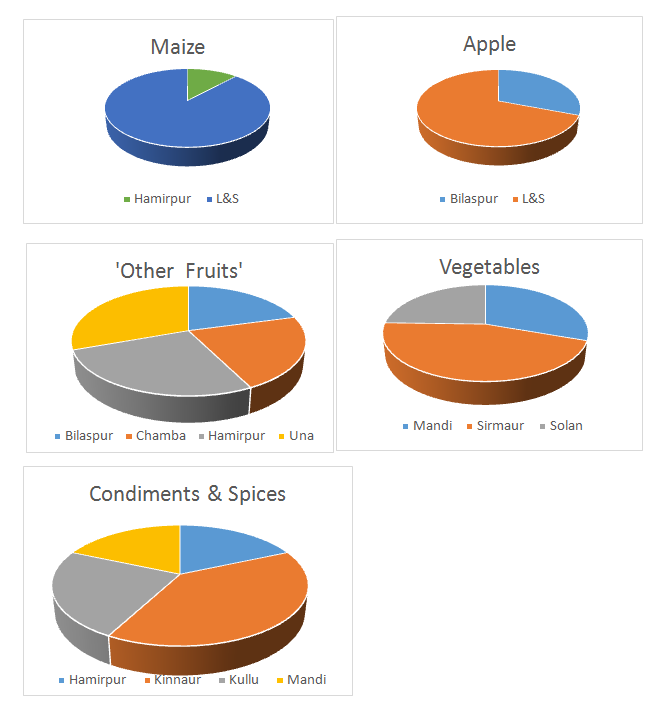
The importance or the emergence of a crop as a diversification option in a district has been visualized by looking at the overall compound growth rates of the selected crops/crop groups. Top three crops in a district, on this basis, have been identified as emerging crop (Fig.1). This analysis suggests that in Hamirpur and L&S farmers are continuing with maize crop and, in fact, there is an increase in acreage under the crop in these two districts. Similarly, pulses come out as an emerging crop in Kinnaur, while interestingly apple turns out to be the emerging crop in Bilaspur and L&S, the districts which were never known for the apple production. So far as L&S district is concerned it is a temperate area and suitable for apple cultivation but Bilaspur is sub tropical area and apple is a crop of temperate region. Apple cultivation in Bilaspur is picking up mainly because of low-chilling requiring apple varieties being cultivated by the progressive farmers of the district.
Many other fruits like litchi, kiwifruit, mango, pear, etc., grouped as ‘other fruits’ are also noted to be the emerging crops in districts Bilaspur, Chamba, Hamirpur and Una, the districts which are now diversifying towards the horticulture crops. Vegetables, however, are popular in almost all the districts of the state. With growing demand for vegetables, as a result of improvements in affordability and also the health consciousness among the consumers, the demand for vegetable has improved over time. These crops are relatively highly remunerative crops and have emerged as major income generators for most districts, particularly Solan, Mandi and Sirmour. Condiments and spices are seen to be emerging crops in Hamirpur, Kinnaur, Kullu and Mandi districts. Though, in the wake of diversification towards high-value crops, coarse cereals like wheat, barley, other cereals & oilseeds are, in general, losing their place in the cropping schemes.
Fig. 1 : Major emerging crops/crop groups in Himachal Pradesh
The study suggests that the process of crop diversification is going on in all the districts of the state, although the extent and type of crop diversification vary in different districts vary. Crop diversification is found to be continuing over the time and most of the districts are associated with this process. Agro ecologically suitable areas like in Shimla, Kinnaur, Kullu, Solan and Sirmour districts are ahead of other districts with regard to crop diversification. Vegetable and fruit crops are emerging as the most prominent crops in the diversification process. In this respect, leading districts like Shimla, Kullu, Mandi, and Sirmour are showing the way how hill agriculture can be made more remunerative. However, looking at the position of most of the districts in terms of crop diversification, it can be concluded that to achieve balanced growth of agriculture in the state location specific farming strategies shall have to be pursued; to harness full agricultural potential of the state, which has an agro ecological and location advantage in the region.
1. Barghouti, S., Carol, T.& Paul, S. (1990). Rural Diversification: Lesson from East Asia. World Bank. The World Bank, Washington , D.C. USA. 117.
2. Chand, R. (1995). Agricultural Diversification and Small Farm Development in Western Himalayan Region. In National Workshop on Small Farm Diversification: Problems and Prospects", NCAP, New Delhi. 214.
3. Chand, R. (1996). Diversification through high value crops in western Himalayan region: evidence from Himachal Pradesh. Indian Journal of Agricultural Economics, 51(4), 652.
4. De, U. K., & Chattopadhyay, M. (2010). Crop diversification by poor peasants and role of infrastructure: Evidence from West Bengal. Journal of Development and Agricultural Economics, 2(10), 340-350.
5. Dreze, J., & Sen, A. (2002). India: Development and participation. Oxford University Press, USA.
6. Gupta, R. P., & Tewari, S. K. (1985). Factors affecting crop diversification: An empirical analysis. Indian Journal of Agricultural Economics, 40(3), 304-309.
7. Gupta, R. P., & Tewari, S. K. (1985). Factors affecting crop diversification: An empirical analysis. Indian Journal of Agricultural Economics, 40(3), 304-309.
8. Joshi, P. K., Gulati, A., & Cummings, R. W. (Eds.). (2007). Agricultural diversification and smallholders in South Asia. Academic Foundation.
9. Moorti, T.V. and Negi, Y.S. (1983). Farming systems in Himachal Pradesh: an economic study. Department of Agriculture Economics, HPKVV, Palampur. Agricultural Economics. 11, 101.
10. Nadkarni, M. V., & Vedini, K. H. (1996). Accelerating Commercialization of Agriculture: Dynamic Agriculture and Stagnating Peasants. Economic and Political Weekly, A63-A73.
11. Pingali, P. L., & Rosegrant, M. W. (1995). Agricultural commercialization and diversification: processes and policies. Food policy, 20(3), 171-185.
12. Rehima, M., Belay, K., Dawit, A., & Rashid, S. (2013). Factors affecting farmers’ crops diversification: evidence from SNNPR, Ethiopia. International Journal of Agricultural Sciences, 3(6), 558-565.
13. Sharma, H. R. (1996). Mountain agricultural development processes and sustainability: Micro-level evidence from Himachal Pradesh, Indian Himalayas. Discussion Paper Series No. MFS 96/2, ICIMOD, Kathmandu, Nepal.
14. Sharma, H. R., & Chauhan, S. K. (2008). Diversification in agriculture in Himachal Pradesh: A success story. Indian Farming, 21(4).
15. Vyas, V. S. (1996). Diversification in agriculture: concept, rationale and approaches. Indian Journal of Agricultural Economics, 51(4), 636.