Pacific B usiness R eview I nternational

A Refereed Monthly International Journal of Management Indexed With THOMSON REUTERS(ESCI)
|
Muhammad Kashif Khurshid Lecturer National University of Modern Languages (NUML) Islamabad Ph.D. Scholar Business Administration Lyallpur Business School (LBS) Government College University Faisalabad E-mail:- kashif041@gmail.com |
Hazoor Muhammad Sabir Professor Dr. Hazoor Muhammad Sabir Dean Faculty of Economics and Management Sciences Government College University Faisalabad E-mail:- hazoor.sabir@yahoo.com |
Safdar Hussain Tahir Associate Professor Dr. Safdar Hussain Tahir Chairperson Lyallpur Business School (LBS) Government College University, Faisalabad, Pakistan E-mail:- drsafdar@gcuf.edu.pk |
Muhammad Abrar Associate Professor Dr. Muhammad Abrar Director Lyallpur Business School (LBS) Government College University Faisalabad E-mail:- abrarphd@gcuf.edu.pk |
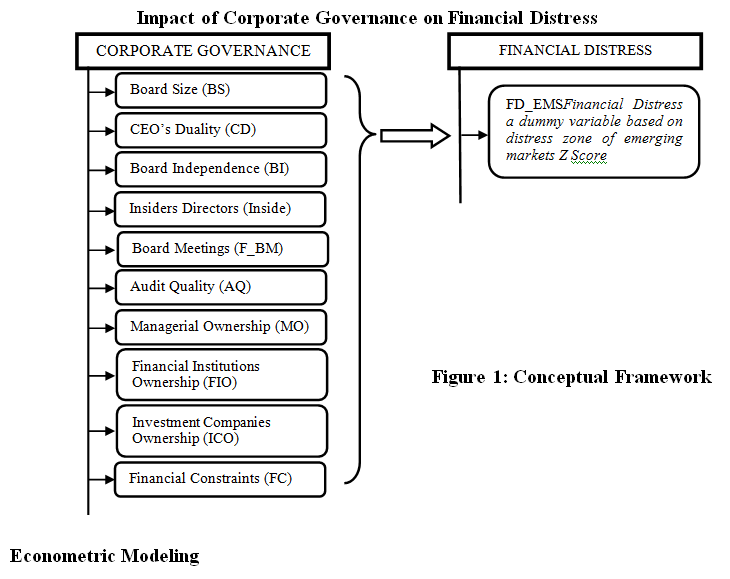
Prediction of financial distress plays very vibrant role for survival and long-term growth of firms in the competitive global environment. Recovery from financial distress can protect the firm bankruptcy. In recent year Pakistan has also witnessed numerous cases of bankruptcy caused by financial distress. This can also be evidenced from numerous cases of acquisitions, mergers, financial restructuring and delisting for firms from Pakistan Stock Exchange. This study is an effort to examines the role of “corporate governance” in the detection of financial distress. Board composition, ownership structure, and audit quality are the key measures of corporate governance. In this study board size, CEO’s duality, board independence, insider’s directorship, no. of board meetings, audit quality, managerial ownership, financial institutions ownership, ownership by investment companies are used as proxies of corporate governance. Secondary data were collected from the balance sheet analysis (BSA) published by the statistical department of State Bank of Pakistan from2009 to 2016 for the said purpose. The financial distress is measured using well-known measure i.e. Emerging Markets Score (EMS) which is the updated version of Altman’s Z Score for the measurement of financial distress. A sample of 164 firms is collected for 8 years (2009-2016) with a total of 1312 firm observations. The results concluded as board size, insider director’s ownership, audit quality, managerial ownership, financial institutions ownership, investment companies’ ownership and profitability of firms play significant negative impact on likelihood of financial distress, while CEO’s duality, board independence, frequency of board meetings, financial constraints, and financial leverage proved positive and significant impact on the probability of financial distress. It is also found that by controlling the financial constraints of firms the impact of corporate governance variables is enhanced, this finding opens new insights into the nexus of corporate governance, financial constraints, and financial distress.
Keywords: Financial Distress, Corporate Governance, Board Size, Board Independence, Managerial Ownership, Institutional Ownership, Board Size, CEO Duality.
Financial Distress
Prediction of a financial distress plays a very import role in long-run survival and growth of the firms in a dynamic global business environment. Financial distress is a global issue which was at its peak during the period of financial crises in 2008-2009. Pakistan also faced the prevalence of financial distress during this crises period, but it was at its top in 1972 and 2012 as 58 and 68 firms were delisted from the Pakistan Stock Exchange (PSX) respectively during this period. There are many causes of financial distress including macroeconomic and firm-related financial and governance factors. Much of empirical evidence has relied on the prediction of financial distress by incorporating different factors. This evidence has proved that firm characteristics cannot be ignored to forecast financial distress (Bhatti & Husain, 1996). Memba and Job, (2013) disclosed that lack of credit facilities, shortage of skilled workers, poor capital decisions, improper internal control, and poor management system leads a firm to be caught in financial distress.
Since 1960’s different models have been developed by (Altman, 1968, 1993, 2002; Demsetz & Lehn, 1985; Merton, 1974; Ohlson, 1980)to predict and measure the financial distress and bankruptcy. Many scholars defined the financial distress in different ways. According to Asquith, Gertner, and Scharfstein, (1994) “A firm is in financial distress if it’s interest coverage (ICR) is less than 0.8 or less than 1 in the last two successive years.”DeAngelo and DeAngelo, (1990) defined that if a firm suffers a loss in three successive years that is known as a financially distressed firm. Beaver, (1966) also categorized firms as financially distressed or healthy based on interest coverage ratio. While many researchers stated that a single variable to measure the financial distress and financial health of the company is not a suitable approach.
Different measurement models developed and used in literature like: Altman, (1968) presented a multivariate discriminant analysis(MDA) model based on five ratios i.e. “working capital to total assets”, “retained earnings to total assets”,” earnings before interest & tax to total assets”, “market value of equity to total debts” and “net sales to total assets”. He defined three zones of financial distress as if the value of Z is greater than 2.99 that firm is assumed in a safe zone, if the value of Z fall between 1.81 and 2.99 firm falls in the grey zone and if the value of Z is less than 1.81 firm falls in distress zone. Later, this five-factor model is renowned in literature as Altman’s Z score. He was the pioneer who offered a methodology based on MDA for prediction of business failure and financial distress (Balcaen & Ooghe, 2006; Patidar & Movalia, 2016).
Altman, (1993) revised his Z-Score and replaced 4th factor from (MV of equity to total debts) to (BV of equity to total debts). This change resulted in some modifications in discrimination zones as if Z` is greater than 2.90 firm falls in the safe zone, if the value of Z` is in between 1.23 and 2.90 firm falls in the grey zone and if Z' is less than 1.23 firm is assumed in distress zone. In Literature called this model as Altman’s Z`-Score.
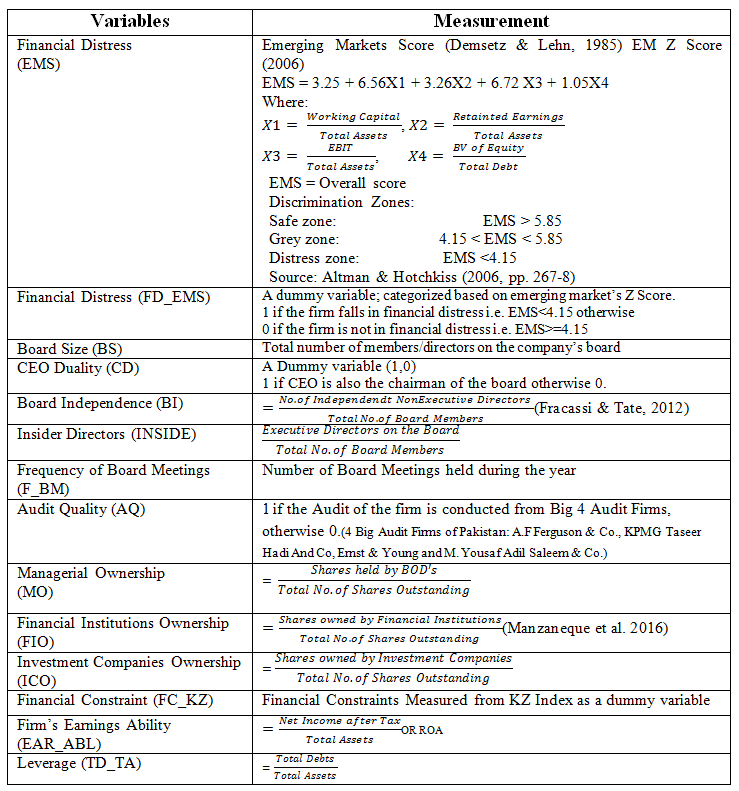
Altman and Hotchkiss (2010) did further change in the Z-Score which is renowned as the Emerging Market Score (EMS) model (Demsetz & Lehn, 1985). Specifically, this model is developed for the measurement of the financial distress of firms in the emerging market. The formula of Emerging Market Score (EMS) is presented in Table 2.
Corporate Governance
Ahmad and Adhariani, (2017) discussed “Corporate governance is as a set of relationships between corporate management, boards, shareholders, and other stakeholders.” Corporate governance offers incentives to the top management to achieve the firm’s objective without damaging the interests of the shareholders. In the literature, corporate governance is measured through the audit quality, ownership, and board structure. In this study corporate governance is captured by board size, board independence, CEO’s duality, insider directorship, audit quality, managerial ownership, financial institutions ownership, investment companies` ownership while profitability, financial leverage ae used as control variables.
In the literature, two different perspectives are presented on board size and its effect on financial distress. Yermack (1996) discussed that larger size boards have their own problems related to conflict of interests and discretion to decision making, lack of coordination and delays in decision making. Larger boards have to undergo from many compromises.
The duality of two positions on the board i.e. a single person enjoys the role of chairman and chief executive officer (CEO). It is assumed that board independence can enhance the decision-making process and can reduce the conflict of interests. Agency theory also advocates that there must be control of board over the management team (Fama & Jensen, 1995).
Financial Constraints
According to Abuhommous (2013) “a firm can be defined as financially constrained when investment spending is affected by the availability of internal funds or the change in internal cash flow”. Alternatively, "a firm can be defined as financially constrained when it faces a financing hierarchy or follows a financing pattern consistent with the pecking order hypothesis, where firms utilize internal funds first and prefer debt to equity financing.”
Lamont, Polk, and Saá-Requejo (2001) defined “the financially constrained mean, the firm is not able to fund the projects which it wants to take. This might be due to credit limits or incapacity to borrow, inability to issue equity, dependence on bank loans, illiquidity of assets, or similar situations. But it doesn’t mean economic distress, financial distress or bankruptcy risk, although these things may be correlated with financial constraint.”
Agency Theory and Corporate Governance
Corporate governance overcomes the agency problems by reducing the agency conflicts between the top management and the shareholders. Even then corporate governance reduces the conflict of interest between the minority and majority of the shareholder. One tool to achieve this objective is to ensure that the audit committee is properly protecting the interest of shareholders. Another tool to reduce the agency problems and conflict is to offer shareholdings to the management (Ahmad & Adhariani, 2017).
Financial institutions ownership can be explained as the stock distribution to outsiders. It can also reduce agency costs (Moh’d, Perry, & Rimbey, 1998). Ownership offers a source of power and even distribution of this power can reduce the agency conflicts and in turn, it reduces the agency cost and improves the efficiency of corporate governance.
A comparative study on the prediction of financial distress was conducted by Taj, Azam, and Khalid (2017) on defaulted and healthy listed textile firms for the period of 2005-2010. This was aimed to scrutinize the prediction accuracy of two models i.e. “Multivariate Discriminate Analysis (MDA)” and “Logit Regression Analysis (LRA)”. They proved the for both models; “Sales to Total Assets, Sales to Tangible Fixed Assets, Return on Equity (ROE), Liquid Assets to Current Liabilities (LR), Earnings before Interest and Taxes to Paid up Capital” plays a vibrant role in the detection of financial distress. From the data analysis they also proved that both the models i.e. MDA and LRA are enough good in variables identification for prediction of Financial Distress; however, their analysis showed that LRA is better model as compared to MDA for prediction of Financial Distress.
Udin, Khan, and Javid (2017)analyzed the effect of ownership structure (institutional, insiders, government and foreign ownership)on the probability of financial distress in selected 146 publicly KSE listed firms for the period of 2003 to 2012. They used institutional, insiders, government and foreign ownership as proxies of ownership structure along with some firm-specific variables like return on assets, return on equity, Tobin’s Q, market to book ratio, firm’s size, sales growth, leverage and profit margin to predict the likelihood of financial distress. They proxied the financial distress with Altman’s Z Score, which is a combination of 5 firm-specific variables. The selected firms are categorized as “financially healthy and financially distressed” based on the distressed zones of the z-score. They applied GMM and Panel Logistic Regression to check the said impact. Their findings were; insignificant association of institutional ownership with financial distress, a significant positive association of insider’s ownership with financial distress, an insignificant association of government ownership with financial distress.
Salloum and Azoury (2012) were of the opinion, that the most prominent reasons of financial distress are agency problems and poor corporate governance in the companies across the globe. Wang and Deng (2006) empirically tested the impact of CG variables on the financial distress of Chinese listed firms for the period of 2002 to 2003. To declare the firm as financial distressed they used the strict criteria consisting of five points i.e. 1) if negative net profits are there in two consecutive years; 2) if the net worth of a share is less than its face value in the last year; 3) if the last years audit opinion is adverse or disclaimer on annual financial report; 4) if, in the last year, the value of equity ownership falls from its registered capital; and 5) if abnormality in financial situation judged by SHSE, SZSE or CSRC. They took the matched sample of financial distress and healthy firms from the period of 2002 and 2003. They obtained data of sample firms from the database of “China Center for Economic Research”. To capture the corporate governance, they used ownership structure(concentrated ownership, largest ownership, Top 5 shareholders ownership, degree of ownership balance, state and managerial ownership); Board Composition and Structure (board size, CEO’s duality, Independent Directors), with other control variables i.e. Managerial Agency Cost (Administrative Expense Ratio), Financial Leverage, Current Ratio. Their results suggested that there is a negative and significant impact of large shareholder ownership and state ownership on the probability of distress and no effect of managerial ownership on distress status. While independent directors showed a negative and significant determinant of financial distress. However, the board size and CEO duality have no significant impact on the probability of financial distress. To measure the managerial agency cost they used the proxy of administrative expense ratio, which showed a significant positive impact on financial distress.
Manzaneque et al. (2016) studied the impact of corporate governance on financial distress likelihood of Spanish listed firms. They used matched pair sampling for every year from 2007 to 2012. To measure the financial distress, they used dummy variable based on two conditions i.e. (a) if its earnings before interest, tax, depreciation, and amortization (EBITDA) was less than from financial expenses in two consecutive years; (b) a decrease in its market value in two consecutive years. To measure the corporate governance, they used ownership and board level variables along with some financial variables i.e. profitability, financial expenses, and retained earnings. They applied conditional logistic regression to check the impact of corporate governance and financial variables on financial distress likelihood. They concluded that the ownership concentration and CEO duality have a positive impact on financial distress likelihood. While the institutional, non-institutional concentration of ownership, board ownership, independent directors, board size and firm size have a negative and statistically significant impact on financial distress likelihood.
Patidar and Movalia, (2016) used the Altman’s Z Score to examine the financial health of NTPC “National-Thermal-Power-Corporation)” and NHPC “National-Hydroelectric-Power Corporation”. They compared both the firms based on z-score and it five components. For this purpose, they used the secondary data of both the firms from 2010-11 to 2014-15. Based on year-wise z-score they proved that the financial health of NTPC is better than NHPC. From the analysis, it is also proved that NTPC declined its financial health year wise from 2011 to 2015 while the financial health of NHPC gradually decreased in 2012, 2013 and 2014 but it improved its financial health in 2015.
Abdullah, (2006) studied the role of ownership structure, board independence, and the duality of CEO on financial distress status of 86 firms by using matched sampling technique. For this purpose, they took the secondary data from 1999 to 2001 from Bursa Stock Exchange Malaysia. They applied t-test for comparison of both i.e. distressed vs non-distressed firms. They used logistic regression to test the hypotheses on 504 firm observations. They resulted that board independence has an insignificant role to prevent a firm from financial distress while duality puts the negative and significant effect on financial distress only in while in models 2,3 and 4 it becomes insignificant due addition of other governance variables. Managerial ownership, non-executive directors on the board and external director’s ownership concentration played a negative and significant role to prevent a firm from financial distress.
Fazzari, Hubbard, and Petersen, (1988) addressed for the first time the issue of financial constraints on corporate investments. To assess the controlling role of financial constraints on the relationship between CG and financial distress status.
Fazzari et al. (1988) proposed that financially constraint firms pay very less or even no dividend, so dividend payout (DPO) ratio can be a proxy of financial constraints. According to them financially constrained firms do not pay dividends or pay very fewer dividends to reduce the chances of debts borrowings in the future. Firms can also be categorized according to their cash flow position. Moyen (2004) used a similar method to detect the financial constraints by applying median cash flows. Firms size is also used by many studies as an inverse proxy of financial constraints like Almeida et al., (2004) and Faulkender and Wang (2006) following the view that small size firms face a higher level of information asymmetry, agency conflicts, and agency costs, and hence can be assumed more financially constrained.
Fazzari et al. (1988) considered higher age shows lower financial constraints while lower age shows the higher level of financial constraints.
Kaplan and Zingales, (1997) proposed a model based on multiple variables to measure the financial constraints of the firms. They used a combination of leverage, profitability, growth opportunities, and cash to capture the rate of financial constraints.
This study applied the KZ Index to capture the status of financial constraints like the studies make by (Almeida et al., 2004; Luo, 2011). Firms below the median value are ranked as financially constrained.
KZ = -1.00190 CF + 3.13919 TLTD - 39.3678 TDIV -1.31475 CASH + 0.282638 Q
Where; CF is cash flow to book assets, TLTD is “total long-term debt to book assets”, TDIV is total dividends to book assets, CASH is stock of cash to book assets, and Q is market/book ratio.
Research Hypotheses
Based on the theoretical grounds and review of the literature the following hypotheses are formulated:
H1 : Larger Board size (BS) decreases the probability of financial distress.
H2 : Duality of CEO and Chairman’s position increases the probability of financial distress.”
H3 : Board Independence (BI) decreases the probability of financial distress.”
H4 : Executive directors on the board (Inside) decreases the probability of financial distress.
H5 : Frequency of board meeting (F_BM) reduces the probability of financial distress.”
H6 : Audit Quality (AQ) decreases the likelihood of financial distress.”
H7 : Managerial Ownership (MO) plays significant role in controlling the financial distress.”
H8 : Financial Institutions Ownership (FIO) plays significant role in controlling the financial distress.”
H9 : Ownership by investment companies (FIO) plays significant role in controlling the financial distress.”
H10 : Financial Constraints (FC) increases the probability of financial distress.”
Sources of Data, Population and Sampling
The data used in this study was secondary in nature. Data related to financial ratios is retrieved from the balance-sheet analysis (BSA) published by the statistical department of State Bank of Pakistan. Latest available BSA dataset was covering the period from 2011 to 2016. To retrieve data before this period BSA of 2014 consisting of data from 2009 to 2014 was also used. Both the data sets are merged to compile the data from 2009 to 2016. Purposefully data before 2008 is excluded from the analysis because this period is renowned as the global financial period which can lead to mis-measurement of financial distress. Data related to corporate governance and non-numeric in nature is retrieved from the individual firm’s audited financial statements from 2009 to 2016. There were 378 firms listed at Pakistan Stock Exchange (PSX) during 2016 under non-financial sector. So, all the 378 firms are considered as population for this study. Purposive sampling technique is applied to choose an appropriate sample. A final sample of 164 firms is selected on the availability of the data of all the eight years including the financial ratios and corporate governance variables. Table 1 depicts the sample from each economic group with its percentage. The similar sampling method is used in past studies (Ahmad & Adhariani, 2017; Udin et al., 2017).
Table: 1 Population and Sample Frame
|
“ Economic Groups ” |
2016 |
% age of sample |
Sample |
|
|
1 |
“Textile” |
144 |
48.61% |
70 |
|
2 |
“Sugar” |
31 |
54.84% |
17 |
|
3 |
“Food” |
15 |
33.33% |
5 |
|
4 |
“Chemicals and Pharmaceuticals” |
43 |
32.56% |
14 |
|
5 |
“Manufacturing” |
32 |
37.50% |
12 |
|
6 |
“Mineral products” |
9 |
44.44% |
4 |
|
7 |
“Cement” |
18 |
55.56% |
10 |
|
8 |
“Motor vehicles, trailers and auto parts” |
18 |
38.89% |
7 |
|
9 |
“Fuel & Energy” |
22 |
31.82% |
7 |
|
10 |
“Information, Communication & transport Services” |
11 |
27.27% |
3 |
|
11 |
“Coke and refined petroleum products” |
10 |
40.00% |
4 |
|
12 |
“Paper, paperboard and products” |
8 |
50.00% |
4 |
|
13 |
“Electrical machinery and apparatus” |
7 |
57.14% |
4 |
|
14 |
“Other services activities” |
10 |
30.00% |
3 |
|
Total: |
378 |
43.39% |
164 |
|
Table 2: Proxies for study variables
Based on keen literature review and theoretical background the following econometric models have been developed and tested.
Econometric Model -1
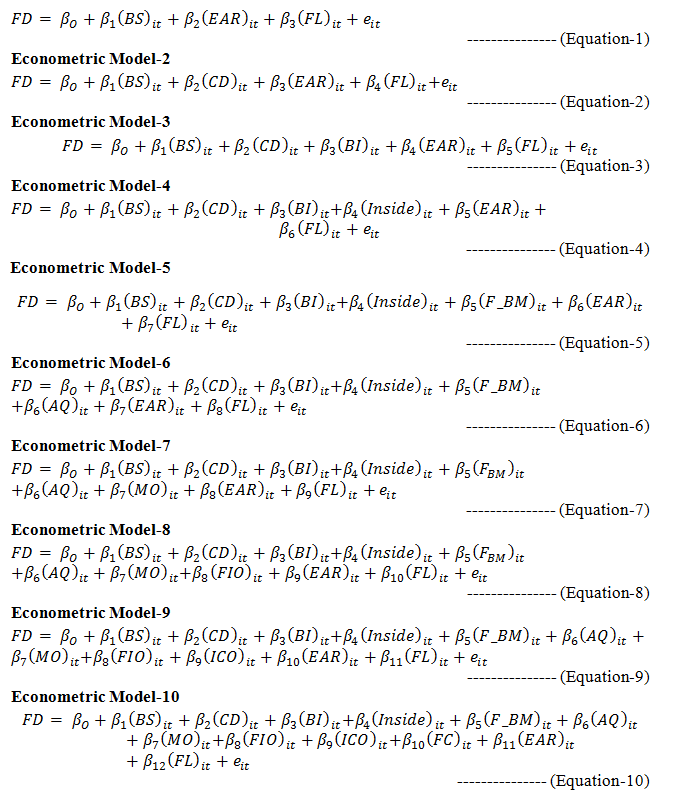
Where
FD = Financial Distress (1,0)
BS = Board Size
CD = CEO’s Duality
BI = Board Independence
Inside = Insider directors on the board
F_BM = Frequency of Board Meeting
AQ = Audit Quality (1,0)
MO = Managerial Ownership
FIO = Financial Institutions Ownership
ICO = Investment Companies Ownership
FC = Financial Constraints (1,0)
EAR = Earnings Ability
FL = Financial Leverage
e = Error term
i = individual firms as cross section
t = time in years from 2009 to 2016
Data Analysis and Results Discussion
Different statistical packages and tools were used for data analysis including the descriptive statistics, correlation, and logistic regression analysis. Logistic regression was employed because of the dichotomous nature of dependent variable i.e. Financial Distress . If the firm is in financial distress it is denoted by “1” and if the firm falls in the category of finally healthy it is denoted as “0”.
Table 3“Descriptive Statistics”
|
Min |
Max |
Range |
Mean |
Std. Dev. |
No. of Obs. |
|
|
FD_EMS |
0.0000 |
1.0000 |
1.0000 |
0.3763 |
0.4846 |
1312 |
|
BS |
6.0000 |
15.0000 |
9.0000 |
7.8540 |
1.2623 |
1312 |
|
CD |
0.0000 |
1.0000 |
1.0000 |
0.2927 |
0.4552 |
1312 |
|
BI |
0.0000 |
0.8571 |
0.8571 |
0.1063 |
0.1228 |
1312 |
|
INSIDE |
0.0000 |
1.0000 |
1.0000 |
0.3125 |
0.1677 |
1312 |
|
F_BM |
2.0000 |
35.0000 |
33.0000 |
5.4567 |
2.7757 |
1312 |
|
AQ |
0.0000 |
1.0000 |
1.0000 |
0.4356 |
0.5206 |
1312 |
|
MAN_OWN |
0.0000 |
98.4300 |
98.4300 |
32.9712 |
28.3825 |
1312 |
|
JSC_OWN |
0.0000 |
84.0100 |
84.0100 |
4.8529 |
10.9768 |
1312 |
|
INVT_COM |
0.0000 |
37.6300 |
37.6300 |
3.8643 |
5.8125 |
1312 |
|
EAR_ABL |
-0.6152 |
0.4424 |
1.0576 |
0.0314 |
0.1026 |
1312 |
|
TD_TA |
0.0168 |
2.0873 |
2.0704 |
0.6247 |
0.2417 |
1312 |
|
FC_KZ |
0.0000 |
1.0000 |
1.0000 |
0.4832 |
0.4999 |
1312 |
|
EMS |
-10.9789 |
68.0726 |
79.0515 |
4.7527 |
3.5822 |
1312 |
|
KZ_INDEX |
0.4197 |
2354.80 |
2354.38 |
95.30 |
160.25 |
1312 |
Summary of descriptive statistics is presented in Table 3. This table summarizes the data in an understandable form which is not possible in the raw data. Descriptive stats give only information about the data but it does not show the relationship and influence of one variable to another variable.
Table-3 shows that FD_EMS has 0.000 and 1 values for lowest and highest. Its mean value is 0.3763, with the standard deviation of 0.4846 and range of1. The board size has the lowest value of 6 and the highest value of 15 with a range of 9, standard deviation of 1.2623 and mean value of 7.8540. The CEO’s duality has the lowest value of 0 and the highest value of 1with a range of 1 and standard deviation of 0.4552. The board independence has the lowest value of 0.0000 and highest value of 0.8571 with a range of 0.8571 and standard deviation of 0.1228. The insider’s ownership has lowest value of 0.0000 and highest value of 1 with a range of 1, the standard deviation of 0.1477 and mean value of 0.3125. The no. of board meeting has lowest value of 2 and highest value of 35 with a range 32 and standard deviation of 2.7757. The minimum value of audit quality is zero, representing that audit of the firm is not conducted from any one of the 4 big audit firms and its maximum value represents that the audit is done from any one of the big 4 audit firms. Managerial ownership shows minimum managerial ownership of zero percent while the maximum percentage of managerial ownership is 98.43% with a range of 98.43 and standard deviation of 28.3825 having its mean value of 32.9712. Ownership by joint stock companies has minimum percentage of zero, with the maximum percentage of 84.01 having standard deviation of 10.9768. Minimum ownership owned by investment companies is zero with maximum value of 5.8125. Earning ability shows minimum value of -0.6152, maximum value of 0.4424 with a range of 1.0576. Average profitability value is 1.0576 with a standard deviation of 0.1026.
Financial leverage is denoted by TD_TA shows minimum value of 0.0168, maximum value of 2.0873 with range of 2.076 and debt ratio is 0.6247 with standard deviation of 0.2417. Financial constraints are measured through KZ_Index with its minimum value of 0.4197 and maximum value of 2354.80 with a range of 2354.38 with mean value 95.30 and standard deviation 160.25. Firms with their KZ Index higher than its mean value are considered asfinancially constraint and vice versa. So, FC_KZ is measured as dummy variable and has minimum value of zero and maximum value of 1 with mean value of 0.4832 and standard deviation of 0.4999. Emerging markets Z Score has minimum value of -10.9789, maximum value of 68.0726, range of 79.0515, mean value of 4.7527 and standard deviation of 3.5822.
Table 4 Correlation Matrix
|
1 |
2 |
3 |
4 |
5 |
6 |
7 |
8 |
9 |
10 |
11 |
12 |
13 |
14 |
15 |
||
|
EMS |
1 |
1 |
||||||||||||||
|
KZ_INDEX |
2 |
0.342 |
1 |
|||||||||||||
|
FD_EMS |
3 |
-0.579 |
-0.233 |
1 |
||||||||||||
|
FC_KZ |
4 |
-0.3 |
-0.412 |
0.339 |
1 |
|||||||||||
|
BS |
5 |
0.083 |
0.167 |
-0.103 |
-0.059 |
1 |
||||||||||
|
CD |
6 |
-0.069 |
-0.159 |
0.202 |
0.209 |
-0.174 |
1 |
|||||||||
|
BI |
7 |
-0.042 |
0.141 |
0.041 |
-0.156 |
0.125 |
-0.104 |
1 |
||||||||
|
INSIDE |
8 |
0.045 |
-0.093 |
-0.083 |
-0.006 |
-0.203 |
0.108 |
-0.323 |
1 |
|||||||
|
F_BM |
9 |
0.031 |
0.003 |
0.024 |
-0.036 |
0.115 |
-0.102 |
0.012 |
0.137 |
1 |
||||||
|
AQ |
10 |
0.32 |
0.221 |
-0.313 |
-0.245 |
0.103 |
-0.212 |
0.075 |
-0.007 |
0.048 |
1 |
|||||
|
MO |
11 |
-0.107 |
-0.190 |
0.039 |
0.208 |
-0.173 |
0.216 |
-0.128 |
0.320 |
-0.015 |
-0.140 |
1 |
||||
|
FIO |
12 |
0.086 |
0.160 |
-0.042 |
-0.171 |
0.183 |
-0.229 |
0.099 |
-0.304 |
0.009 |
0.171 |
-0.752 |
1 |
|||
|
ICO |
13 |
0.165 |
0.041 |
-0.152 |
-0.134 |
0.061 |
-0.093 |
0.052 |
-0.028 |
-0.052 |
0.050 |
-0.217 |
0.220 |
1 |
||
|
EAR_ABL |
14 |
0.603 |
0.456 |
-0.585 |
-0.343 |
0.114 |
-0.132 |
0.021 |
0.015 |
0.029 |
0.278 |
-0.120 |
0.098 |
0.158 |
1 |
|
|
TD_TA |
15 |
-0.741 |
-0.255 |
0.577 |
0.287 |
-0.028 |
0.125 |
-0.006 |
-0.030 |
-0.020 |
-0.310 |
0.107 |
-0.098 |
-0.119 |
-0.472 |
1 |
Table 4 describes the correlation of variables with each other including all the independent and dependent variables. The above table shows a positive correlation of Financial Distress (FD_EMS) with Financial Constraints (FC_KZ), CEO’s duality (CD), Board Independence (BI), Frequency of Board Meetings (F_BM), Managerial Ownership (MO) and Financial Leverage (TD_TA) with the values 0.339, 0.202, 0.041, 0.024, 0.039 and 0.577 respectively. While the correlation values of -0.103, -0.083, -0.313, -0.042, -0.152, -0.585 shows negative correlation of board size (BS), insider’s directorship (Inside), audit quality (AQ), financial institutions ownership (FIO), investment companies ownership (ICO) and earning ability (EAR_ABL) with the financial distress (FD_EMS) of the firms.
Logistic Regression Analysis
Table 5 “Results of Probit Regressions on the Probability of Financial Distress (Model 1- 5)
Method: ML - Binary Probit (Newton-Raphson / Marquardt steps) ”
|
Exp. Sign |
Model 1 |
Model 2 |
Model 3 |
Model 4 |
Model 5 |
||||||
|
Intercept |
-2.532*** |
(0.00) |
-2.718*** |
(0.00) |
-2.774*** |
(0.00) |
-2.466*** |
(0.00) |
-2.502*** |
(0.00) |
|
|
BS |
(-) |
-0.187*** |
(0.00) |
-0.165*** |
(0.00) |
-0.172*** |
(0.00) |
-0.186*** |
(0.00) |
-0.211*** |
(0.00) |
|
CD |
(+) |
0.311*** |
(0.01) |
0.332*** |
(0.00) |
0.344*** |
(0.00) |
0.379*** |
(0.00) |
||
|
BI |
(-) |
0.949*** |
(0.00) |
0.702 |
(0.13) |
0.635 |
(0.18) |
||||
|
INSIDE |
(-) |
-0.580* |
(0.08) |
-0.783** |
(0.02) |
||||||
|
F_BM |
(-) |
0.056*** |
(0.01) |
||||||||
|
EAR_ABL |
(-) |
-13.351*** |
(0.00) |
-13.328*** |
(0.00) |
-13.271*** |
(0.00) |
-13.236*** |
(0.00) |
-13.289*** |
(0.00) |
|
TD_TA |
(+) |
6.084*** |
(0.00) |
5.946*** |
(0.00) |
5.960*** |
(0.00) |
5.959*** |
(0.00) |
5.938*** |
(0.00) |
|
McFadden R2 |
0.570 |
0.574 |
0.577 |
0.578 |
0.583 |
||||||
|
Log likelihood |
-374.656 |
-370.854 |
-368.552 |
-367.041 |
-362.985 |
||||||
|
LR statistic |
991.658*** |
999.261*** |
1003.866*** |
1006.888*** |
1014.998*** |
||||||
|
Prob. (LR statistic) |
(0.00) |
(0.00) |
(0.00) |
(0.00) |
(0.00) |
||||||
|
Number of Observations |
1312 |
1312 |
1312 |
1312 |
1312 |
||||||
|
Obs. with Dep.=0 |
815 |
815 |
815 |
815 |
815 |
||||||
|
Obs. with Dep.=1 |
497 |
497 |
497 |
497 |
497 |
||||||
***, ** and * indicate significance at the 1, 5 and 10% levels, respectively.
Table 6“Results of Probit Regressions on the Probability of Financial Distress (Model 6-10)”
Method: ML - Binary Probit (Newton-Raphson / Marquardt steps)
|
Exp. Sign |
Model 6 |
Model 7 |
Model 8 |
Model 9 |
Model 10 |
||||||
|
Intercept |
-2.380*** |
(0.00) |
-2.252*** |
(0.00) |
-2.232*** |
(0.00) |
-2.347*** |
(0.00) |
-2.472*** |
(0.00) |
|
|
BS |
(-) |
-0.208*** |
(0.00) |
-0.217*** |
(0.00) |
-0.210*** |
(0.00) |
-0.197*** |
(0.00) |
-0.199*** |
(0.00) |
|
CD |
(+) |
0.336*** |
(0.00) |
0.384*** |
(0.00) |
0.398*** |
(0.00) |
0.404*** |
(0.00) |
0.378*** |
(0.00) |
|
BI |
(-) |
0.643 |
(0.18) |
0.686 |
(0.15) |
0.723 |
(0.13) |
1.029** |
(0.04) |
1.261*** |
(0.01) |
|
INSIDE |
(-) |
-0.790** |
(0.02) |
-0.555 |
(0.13) |
-0.476 |
(0.20) |
-0.352 |
(0.35) |
-0.250 |
(0.51) |
|
F_BM |
(-) |
0.059** |
(0.00) |
0.056*** |
(0.01) |
0.053*** |
(0.01) |
0.048** |
(0.03) |
0.048** |
(0.03) |
|
AQ |
(-) |
-0.277*** |
(0.01) |
-0.297*** |
(0.01) |
-0.298*** |
(0.01) |
-0.330*** |
(0.00) |
-0.300*** |
(0.01) |
|
MO |
(-) |
-0.004** |
(0.04) |
-0.006*** |
(0.01) |
-0.008*** |
(0.00) |
-0.009*** |
(0.00) |
||
|
FIO |
(-) |
-0.008* |
(0.07) |
-0.011** |
(0.02) |
-0.012*** |
(0.01) |
||||
|
ICO |
(-) |
-0.047*** |
(0.00) |
-0.049*** |
(0.00) |
||||||
|
FC_KZ |
(+) |
0.259** |
(0.03) |
||||||||
|
EAR_ABL |
(-) |
-13.109*** |
(0.00) |
-13.100*** |
(0.00) |
-13.038*** |
(0.00) |
-13.041*** |
(0.00) |
-12.635*** |
(0.00) |
|
TD_TA |
(+) |
5.874*** |
(0.00) |
5.894*** |
(0.00) |
5.902*** |
(0.00) |
6.267*** |
(0.00) |
6.217*** |
(0.00) |
|
McFadden R2 |
0.587 |
0.589 |
0.591 |
0.602 |
0.605 |
||||||
|
Log likelihood |
-359.609 |
-357.374 |
-355.622 |
-346.550 |
-344.060 |
||||||
|
LR statistic |
1021.752*** |
1026.221*** |
1029.725*** |
1047.870*** |
1052.850*** |
||||||
|
Prob. (LR statistic) |
(0.00) |
(0.00) |
(0.00) |
(0.00) |
(0.00) |
||||||
|
Number of Obs. |
1312 |
1312 |
1312 |
1312 |
1312 |
||||||
|
Obs. with Dep.=0 |
815 |
815 |
815 |
815 |
815 |
||||||
|
Obs. with Dep.=1 |
497 |
497 |
497 |
497 |
497 |
||||||
***, ** and * indicate significance at the 1, 5 and 10% levels, respectively.
Table 7“Results of Logit Regressions on The Probability of Financial Distress (Model 9-10)
Method: ML - Binary Logit (Newton-Raphson / Marquardt steps) ”
|
Variable |
Model 11 |
Model 12 |
||||||||
|
Exp. Sign |
Coeff. |
SE |
z-Stats |
Prob. |
Coeff. |
SE |
z-Stats |
Prob. |
||
|
Intercept |
(-) |
-4.524 |
0.888 |
-5.096 |
0.000 |
-4.728 |
0.904 |
-5.230 |
0.000 |
|
|
BS |
(+) |
-0.346 |
0.090 |
-3.840 |
0.000 |
-0.352 |
0.091 |
-3.858 |
0.000 |
|
|
CD |
(-) |
0.693 |
0.219 |
3.161 |
0.002 |
0.633 |
0.222 |
2.855 |
0.004 |
|
|
BI |
(-) |
1.683 |
0.917 |
1.835 |
0.066 |
2.135 |
0.948 |
2.252 |
0.024 |
|
|
INSIDE |
(-) |
-0.738 |
0.679 |
-1.088 |
0.277 |
-0.551 |
0.685 |
-0.806 |
0.421 |
|
|
F_BM |
(-) |
0.089 |
0.039 |
2.257 |
0.024 |
0.092 |
0.040 |
2.315 |
0.021 |
|
|
AQ |
(-) |
-0.614 |
0.204 |
-3.019 |
0.003 |
-0.581 |
0.204 |
-2.843 |
0.005 |
|
|
MO |
(-) |
-0.015 |
0.004 |
-3.685 |
0.000 |
-0.017 |
0.004 |
-3.938 |
0.000 |
|
|
FIO |
(-) |
-0.021 |
0.009 |
-2.408 |
0.016 |
-0.023 |
0.009 |
-2.627 |
0.009 |
|
|
ICO |
(+) |
-0.085 |
0.020 |
-4.209 |
0.000 |
-0.088 |
0.020 |
-4.378 |
0.000 |
|
|
FC_KZ |
(-) |
0.473 |
0.213 |
2.216 |
0.027 |
|||||
|
EAR_ABL |
(+) |
-26.507 |
2.141 |
-12.381 |
0.000 |
-25.741 |
2.141 |
-12.022 |
0.000 |
|
|
TD_TA |
11.862 |
0.958 |
12.385 |
0.000 |
11.743 |
0.962 |
12.210 |
0.000 |
||
|
McFadden R2 |
0.6134 |
0.61626 |
||||||||
|
Log likelihood |
-336.4951 |
-334.03950 |
||||||||
|
LR statistic |
1067.9790 |
1072.89000 |
||||||||
|
Prob. (LR statistic) |
0.0000 |
0.0000 |
||||||||
|
Number of Obs. |
1312 |
1312 |
||||||||
|
Obs with Dep=0 |
815 |
815 |
||||||||
|
Obs with Dep=1 |
497 |
497 |
||||||||
***, ** and * indicate significance at the 1, 5 and 10% levels, respectively.
Table 5and 6 present the results of logistic regressions of econometric models 1-5 and 6-10 respectively. The LR Statistic values in all the models are 991.658, 999.261, 1003.866, 1006.888, 1014.998, 1021.752, 1026.221, 1029.725, 1047.870 and 1052.850respectively with significant p-values at 1 percent, depicts the overall fitness and significance of all the models. The value of McFadden R2in all the models is 0.570, 0.574, 0.577, 0.578, 0.583, 0.587, 0.589, 0.591, 0.602 and 0.605 shows the overall change in the dependent variable due to all independent variables. The negative values of Log Likelihood are -374.656, -370.854, -368.552, -367.041, -362.985, -359.609, 357.374, -355.622, -346.550 and -344.060 depicting the overall fitness of all the econometric models. The bottom portion of the tables 5 and 6 shows that there are 1312 firm observations consisting of 164 firms for the period of 2009 to 2016. Out of these 1312 firm observations 497 having a value of 1 showing 37.88% firm observation fall in financial distress from 2009 to 2016. While 815 firm observations out of 1312 show 62.12% firm observations were healthy based on emerging markets z score.
The coefficient values of board sizeare-0.187, -0.165, -0.172, -0.186, -0.211, -0.208, -2.217, -0.210, -0.197 and -0.199 respectively in all the ten models with probability value of 0.00 demonstrates that increase in board size gives negative change in probability of financial distress. These results prove that the increase in board size decreases the likelihood of financial distress. The results support to accept the “H1: Larger Board size (BS) decreases the probability of financial distress. Further the results of the study are aligned with past studies(Ahmad & Adhariani, 2017; Jamal & Shah, 2017; Manzaneque et al., 2016) and divergent to the studies(Parker, Peters, & Turetsky, 2002; Salloum & Azoury, 2012; Wang & Deng, 2006).
The coefficient values of CEO’s duality are 0.311 (0.01) in Model 2, 0.322 (0.00) in Model 3, 0.334 (0.00) in Model 4, 0.379 (0.00) in Model 5, 0.336 (0.00) in Model 6, 0.384 (0.00) in Model 7, 0.398 (0.00) in Model 8, 0.404 (0.00) in Model 9 and 0.378 (0.00) in Model 10 depicting the positive influence of co-sharing the positions of chairman and CEO increase the likelihood of financial distress. The results support to accept the H2: Duality of CEO and Chairman’s position increases the probability of financial distress. Furthermore, the results of the study are aligned with past studies(Manzaneque et al., 2016) and opposed to the studies (Ciampi, 2015; Jamal & Shah, 2017; Kristanti, Rahayu, & Huda, 2016; Nahar Abdullah, 2006; Salloum & Azoury, 2012).
The coefficient values of Board Independence (BI) are 0.949 (0.00) in Model 3, 0.702 (0.13) in Model 4, 0.635 (0.18) in Model 5, 0.643 (0.18) in Model 6, 0.686 (0.15) in Model 7, 1.029 (0.04) in Model 9 and 1.261 (0.01) in Model 10depicts positive influence of board independence on the likelihood of financial distress. The results support to reject the “H3: Board Independence decreases the probability of financial distress. Further the results of the study are aligned with past studies (Elloumi & Gueyie, 2001; Ernawati, Elysia Handojo, & R. Murhadi, 2018; Manzaneque et al., 2016) and opposite to the studies(Abdullah, 2006; Ahmad & Adhariani, 2017; Jamal & Shah, 2017; Kristanti et al., 2016; Li, Wang, & Deng, 2008; Miglani, Ahmed, & Henry, 2015; Wang & Deng, 2006).
The coefficient values of insider’s directorship are -0.580, -0.783, -0.79, -0.555, -0.476, -0.352 and -0.250 with p values 0.08, 0.02, 0.02, 0.13, 0.20, 0.35 and 0.51 respectively in models 4 to 10 demonstrates that increase in insider’s directorship gives negative change in probability of financial distress. The results support to partially accept theH4: Executive directors on the board decreases the probability of financial distress. Further, the results of the study are aligned with past studies (Ciampi, 2015; Nahar Abdullah, 2006; Parker et al., 2002) and opposed to the studies (Salloum & Azoury, 2012; Udin et al., 2017).
The coefficient values of frequency of board meetings are 0.056, 0.059, 0.56, 0.053, 0.048and 0.048 with p values 0.01, 0.00, 0.01, 0.01, 0.01, 0.03 and 0.03 respectively in models 5 to 10depicts that increase in frequency of board meetings gives positive change in probability of financial distress. The results support to rejectthe“H5: Frequency of board meeting (F_BM) reduces the probability of financial distress. The coefficient values of audit quality are -0.277, -0.297, -0.298, -0.330 and -0.300 with p-values of 0.01, 0.01, 0.01, 0.00 and 0.01 respectively in model 6 to 10 demonstrates that increase in audit quality can decrease the probability of financial distress. The results support to accept the “H6: Audit Quality (AQ) decreases the likelihood of financial distress. Further the results of the study are aligned with (Miglani et al., 2015).
Managerial ownership’s impact on the coefficient values of board size is-0.004, -0.006, -0.008 and -0.009 with their p-values of 0.04, 0.01, 0.00 and 0.00 respectively in model 7 to 10 demonstrates that increase in managerial ownership gives negative impact on the probability of financial distress. The results support to accept the “H7: Managerial Ownership (MO) plays a significant role in controlling the financial distress. Further the results of the study are aligned with past studies (Donker, Santen, & Zahir, 2009; Lee & Yeh, 2004; Li et al., 2008; Miglani et al., 2015) and opposed to the studies (Li et al., 2008; Wang & Deng, 2006).
The coefficient values of financial institutions ownership are -0.008, -0.011, and -0.012with their p-value of 0.07, 0.02 and 0.01 respectively in model no. 7, 8 and 10 prove that increase in managerial ownership gives negative change in the probability of financial distress. The results support to accept the H8: Financial Institutions Ownership (FIO) plays a significant role in controlling the financial distress. Further, the results of the study are aligned with past studies(Lee & Yeh, 2004; Manzaneque et al., 2016; Udin et al., 2017) and opposed to the studies (Ahmad & Adhariani, 2017; Shahwan, 2015).
Investment company’s ownership is depicting negative and significant impact on the likelihood of financial distress. The coefficient values of ICO are -0.047 and -0.049 with a respective p-value of 0.00 in model 9 and 10 shows the significance level of 1%. The results support to accept the H 9: Ownership by investment companies (FIO) plays a significant role in controlling the financial distress. The coefficient values of financial constraint is 0.259 with a value of p 0.00 shows a positive and significant impact of financial constraint on the likelihood of financial distress at 1% level of significance. The results support to accept the H 10: Financial Constraints (FC) increases the probability of financial distress.
Furthermore, by controlling the effect of financial constraints model 10 is run by using the same independent variables used in model 9. Now the coefficients values of board size, board independence, managerial ownership, financial institutions ownership, and investment companies` ownership are increased from -0.197 to -0.199, 1.029 to 1.261, -0.008 to -0.009, -0.11 to -0.12 and -0.047 to -0.049 respectively. This increase in coefficient values proved that by controlling the financial constraints, the effect of corporate governance improves in overcoming a firm from financial distress. New coefficient value of boards size suggests that larger board size can enhance its efficiency to overcome a firm from financial distress if it’s financial constraints are reduced. Similarly, the other corporate governance measures (board independence, managerial ownership, shareholdings by financial institutions and investment companies` ownership) increased their influential power in reduction of financial distress likelihood. So, these results open new insights for the researchers to incorporate status of firm’s financial constraints if, the firm’s management is trying to reduce the probability of financial distress. Even then positive coefficient value of financial constraints on likelihood of financial distress suggests financial constraints increases the likelihood of financial distress.
Earnings ability puts the negative impact in controlling the financial distress in all the ten models with 1% level of significance. Profitability is used as a control variable because past studies also used it as control variable the negative impact of this variable is aligned with the results of past studies like (Ahmad & Adhariani, 2017; Ernawati et al., 2018; Jamal & Shah, 2017; Manzaneque et al., 2016; Parker et al., 2002) and opposed (Udin et al., 2017) Financial leverage is also used as control variable and its positive impact on the likelihood of financial distress is aligned with (Donker et al., 2009; Elloumi & Gueyie, 2001; Kristanti & Herwany, 2017; Lee & Yeh, 2004; Li et al., 2008; Miglani et al., 2015; Wang & Deng, 2006) and opposed to (Kristanti et al., 2016; Udin et al., 2017).
Conclusion
Initially, this study was aimed to check the role of “corporate governance” on the likelihood of financial distress. To rate a firm as “financial distressed” the Emerging Markets Z-Score model is used. The firms have EMS value less than 4.15 are categorized as financially distress firms. To measure the corporate governance, ownership structure (managerial ownership, financial institutions ownership, investment company’s ownership), board composition & structure (board size, CEO’s duality, board independence, insider’s directorship, no. of board meeting) and audit quality are used as proxies are used. While profitability, financial leverage, and financial constraints are used as control variables. From correlation matrix it is proved that there exists negative correlation of boar size, insider’s ownership, audit quality financial institutions ownership, investment company’s ownership and earnings ability with financial distress, while negative correlation with financial constraints, CEO’s duality, board independence, frequency of board meetings, managerial ownership, and financial leverage.
To check the impact of corporate governance on the likelihood of financial distress, ten logistic regression models were applied to 1312 firm observations. These results of these models depicted that size of board, insider’s ownership, audit quality, managerial ownership, financial institutions ownership, investment companies` ownership and firm’s profitability plays significant role in controlling the firm being caught in financial distress, while CEO’s duality, board independence, frequency of board meetings, financial leverage, and financial constraint have positive and significant impact on the likelihood of financial distress. The stepwise conclusion is as:
§ Larger board size reduces the chances of financial distress.
§ Duality leads towards the financial crises and increases the chances of financial distress.
§ Board independence leads to increase the probability of firms being in financial distress.
§ Insider’s directorship plays a significant negative impact on probability of financial distress without controlling the influence of board structure, while it becomes insignificant by considering the role of board structure and composition.
§ By controlling the effect of financial constraints, the role of corporate governance variables increases to overcome a firm from financial crises/distress.
Recommendations
§ Board members must beat a significant size to protect a firm being in financial distress.
§ The duality of the two positions i.e. chairman and CEO should not be encouraged, as results show the positive impact of duality on the likelihood of financial distress.
§ More members as a nominee and independent directors should also be discourged if a firm is in financial distress.
§ Financial Institutional ownership i.e. percentage of shares held by the financial institutions leads the firms to safeguard from the prospect of financial distress.
§ There must be the significant ratio of insider directors on the board to enhance the financial health of the firms.
Limitations and Future Research
This study has achieved the desired objectives, but like other studies, this study also confronted lots of limitations which open the new entries for the researchers to get insights for future study.
§ This study covers only the post-crises period i.e. 2009-2016. Future studies may incorporate the data of before and after crises period.
§ This study found the role of corporate governance in detection of financial distress likelihood, in future studies a comparison of finically healthy and distressed can be drawn by incorporating the role and status of financial constraints.
§ Other measures of financial distress may also be used to enhance the robustness of the models.
§ This study used only logistic regression but in future, Panel Logistic models may also be used for more accuracy.
§ Data of both i.e. financial and non-financial sectors can be used to make it more comprehensive.
§ In this study we used financial constraints as predictor of financial distress, but we suggest using this variable (financial constraint) as an intervening variable in future studies. So that the real effect of this variable on detection of financial distress can found.
§ The incorporation of financial constraint in this study also promotes the new ways to study and test new relationships among the nexus of corporate governance, financial constraints and financial distress likelihood.
Abdullah, S. N. (2006). Board structure and ownership in Malaysia : the case of distressed listed companies, 6 (5), 582–594. https://doi.org/10.1108/14720700610706072
Abuhommous, A. A. A. (2013). Financial Constraints, Capital Structure and Dividend Policy: Evidence from Jordan .
Ahmad, H. M., & Adhariani, D. (2017). Corporate Governance Determinants for The Mitigation of The Likelihood of Financial Distress.
Almeida, H., Campello, M., & Weisbach, M. S. (2004). The Cash Flow Sensitivity of Cash. The Journal of Finance , 59 (4), 1777–1804. https://doi.org/10.1111/j.1540-6261.2004.00679.x
Altman, E. I. (1968). Financial ratios, discriminant analysis and the prediction of corporate bankruptcy. The Journal of Finance , 23 (1), 193–194. https://doi.org/10.1111/j.1540-6261.1968.tb00843.x/pdf
Altman, E. I. (1993). Evaluating the Chapter 11 Bankruptcy-Reorganization Process.
Altman, E. I. (2002). Corporate Distress Prediction Models in a Turbulent Economic and Basel II Environment, (September), London Risk Books.
Altman, E. I., & Hotchkiss, E. (2010). Corporate financial distress and bankruptcy predict and avoid bankruptcy, analyze and invest in distressed debt . John Wiley & Sons.
Asquith, P., Gertner, R., & Scharfstein, D. (1994). Anatomy of Financial Distress : An Examination of Junk-Bond Issuers. The Quarterly Journal of Economics , 109 (3), 625–658.
Balcaen, S., & Ooghe, H. (2006). 35 years of studies on business failure: An overview of the classic statistical methodologies and their related problems. British Accounting Review . https://doi.org/10.1016/j.bar.2005.09.001
Beaver, W. H. (1966). Failure Financial Ratios as Predictors of Failure. Journal of Accounting Research , 4 , 71–111.
Bhatti, R. H., & Husain, F. (1996). A Correct Test of Purchasing Power Parity: The Case of Pak-Rupee Exchange Rates [with Comments]. The Pakistan Development Review , 671–682.
Ciampi, F. (2015). Corporate governance characteristics and default prediction modeling for small enterprises. An empirical analysis of Italian firms. Journal of Business Research , 68 (5), 1012–1025. https://doi.org/10.1016/j.jbusres.2014.10.003
DeAngelo, H., & DeAngelo, L. (1990). American Finance Association Dividend Policy and Financial Distress : An Empirical Investigation of Troubled NYSE Firms. The Journal of Finance , 45 (5), 1415–1431. https://doi.org/10.1111/j.1540-6261.1990.tb03721.x
Demsetz, H., & Lehn, K. (1985). The Structure of Corporate Ownership : Causes and Consequences. Journal of Political Economy , 93 (6), 1155–1177.
Donker, H., Santen, B., & Zahir, S. (2009). Ownership structure and the likelihood of financial distress in the Netherlands. Applied Financial Economics , 19 (21), 1687–1696. https://doi.org/10.1080/09603100802599647
Elloumi, F., & Gueyie, J. (2001). Financial Distress and Corporate Governance : an Empirical Analysis, 15–23.
Ernawati, E., Elysia Handojo, S., & R. Murhadi, W. (2018). Financial performance, corporate governance, and financial distress. Proceedings of the 15th International Symposium on Management (INSYMA 2018) , 186 (Insyma), 35–39. https://doi.org/10.2991/insyma-18.2018.9
Fama, E. F., & Jensen, M. C. (1995). SEPARATION OF OWNERSHIP AND CONTROL *, XXVI (June), 301–325.
Faulkender, M., & Wang, R. (2006). Corporate financial policy and the value of cash. Journal of Finance , 61 (4), 1957–1990. https://doi.org/10.1111/j.1540-6261.2006.00894.x
Fazzari, S. M., Hubbard, R. G., & Petersen, B. C. (1988). Financing Corporate Constraints Investment. Brookings Papers on Economic Activity , 1 (1), 141–206.
Jamal, A. H., & Shah, S. Z. A. (2017). The Impact of Corporate Governance on the Financial Distress : Evidence from Pakistani Listed Companies. Jinnah Business Review , 5 (2), 49–53.
Kaplan, S. N., & Zingales, L. (1997). Do Investment-Cash Flow Sensitivities Provide Useful Measures of Financing Constraints? The Quarterly Journal of Economics , 112 (1), 169–215. https://doi.org/10.1162/003355397555163
Kristanti, F. T., & Herwany, A. (2017). Corporate Governance, Financial Ratios, Political Risk and Financial Distress: A Survival Analysis. Accounting & Finance Review (AFR) , 2 (2), 26–34. Retrieved from http://search.ebscohost.com/login.aspx?direct=true&db=plh&AN=124576454&site=ehost-live
Kristanti, F. T., Rahayu, S., & Huda, A. N. (2016). The Determinant of Financial Distress on Indonesian Family Firm. Procedia - Social and Behavioral Sciences , 219 , 440–447. https://doi.org/10.1016/j.sbspro.2016.05.018
Lamont, O., Polk, C., & Saá-Requejo, J. (2001). Financial constraints and stock returns. Review of Financial Studies , 14 (2), 529–554. https://doi.org/10.1093/rfs/14.2.529
Lee, T.-S., & Yeh, Y.-H. (2004). Corporate Governance and Financial Distress: evidence from Taiwan. Corporate Governance , 12 (3), 378–388. https://doi.org/10.1111/j.1467-8683.2004.00379.x
Li, H., Wang, Z., & Deng, X. (2008). Ownership , independent directors , agency costs and financial distress : evidence from Chinese listed companies, 8 (5), 622–636. https://doi.org/10.1108/14720700810913287
Luo, M. M. (2011). A bright side of financial constraints in cash management. Journal of Corporate Finance , 17 (5), 1430–1444. https://doi.org/10.1016/j.jcorpfin.2011.07.001
Manzaneque, M., Priego, A. M., & Merino, E. (2016). Corporate governance effect on financial distress likelihood: Evidence from Spain. Spanish Accounting Review , 19 (1), 111–121. https://doi.org/10.1016/j.rcsar.2015.04.001
Memba, F., & Job, A. N. (2013). Causes of Financial Distress : A Survey of Firms Funded by Industrial and Commercial Development Corporation in Kenya. Interdisciplinary Journal of Contemporary Research in Business , 4 , 1171–1185.
Merton, R. C. (1974). On the pricing of corporate debt The risk structure of interest rates. Journal of Finance , 242 (8), 449–470.
Miglani, S., Ahmed, K., & Henry, D. (2015). Voluntary corporate governance structure and financial distress: Evidence from Australia. Journal of Contemporary Accounting and Economics , 11 (1), 18–30. https://doi.org/10.1016/j.jcae.2014.12.005
Moh’d, M. A., Perry, L. G., & Rimbey, J. N. (1998). The impact of ownership structure on corporate debt policy: A time‐series cross‐sectional analysis. Financial Review , 33 (3), 85–98.
Moyen, N. (2004). Investment-cash flow sensitivities: Constrained versus unconstrained firms. Journal of Finance , 59 (5), 2061–2092. https://doi.org/10.1111/j.1540-6261.2004.00692.x
Nahar Abdullah, S. (2006). Board structure and ownership in Malaysia: The case of distressed listed companies. Corporate Governance: The International Journal of Business in Society , 6 (5), 582–594.
Ohlson, J. A. (1980). Financial Ratios and the Probabilistic Prediction of Bankruptcy. Journal of Accounting Research , 18 (1), 109. https://doi.org/10.2307/2490395
Parker, S., Peters, G. F., & Turetsky, H. F. (2002). Corporate governance and corporate failure: a survival analysis. Corporate Governance: The International Journal of Business in Society , 2 (2), 4–12.
Patidar, V., & Movalia, N. P. (2016). An Empirical Study on Financial Health of NTPC and NHPC. PACIFIC BUSINESS REVIEW INTERNATIONAL , 8 (9), 16–22.
Salloum, C., & Azoury, N. (2012). Corporate governance and firms in financial distress : evidence from a Middle Eastern country. Journal Business Governance and Ethics , 7 (1), 1–17.
Shahwan, T. M. (2015). The effects of corporate governance on financial performance and financial distress: evidence from Egypt. Corporate Governance , 15 (5), 641–662.
Taj, A., Azam, S., & Khalid, G. K. (2017). Prediction of Financial Distress: A Comparative Study.
Udin, S., Khan, M. A., & Javid, A. Y. (2017). The effects of ownership structure on likelihood of financial distress: an empirical evidence. Corporate Governance: The International Journal of Business in Society , 17 (4), 589–612.
Wang, Z.-J., & Deng, X.-L. (2006). Corporate Governance and Financial Distress: Evidence from Chinese Listed Companies. Chinese Economy , 39 (5), 5–27. https://doi.org/10.2753/CES1097-1475390501
Yermack, D. (1996). Higher market valuation forfirms with a small board of directors. Journal of Financial Economics1 , 40 (1494), 185–211.