Pacific B usiness R eview I nternational

A Refereed Monthly International Journal of Management Indexed With THOMSON REUTERS(ESCI)
|
Prof. Deepa Vyas Professor GLS University Law Garden Ahmedabad, India Contact No.:- 8320112185 E-mail:-deepa@nribm.org |
Urvi Ganatra Student GLS University Law Garden Ahmedabad, India Contact No:- 8141773773 E-mail:- urvi.nrmba16@gmail.com |
There are multiple investment avenues in which an investor can invest into. Out of them, the one which amalgamates both risk and return is Mutual Fund. An investment vehicle where the fund manager invests on behalf of investor and the return generated out of it is passed backed to the investor is Mutual Fund. It is one of the most prominent investment avenue preferred by most of the investors. In India, Mutual fund was first introduced by Unit Trust of India in 1963. This paper attempts to analyze the investor preference of mutual fund among young and middle adults and also to study discriminating factor which distinguishes young and middle adult while making investment decision. For empirical investigation the data was collected from 100 respondents through self-administrated questionnaire. In order to cluster the respondents on basis of post investment satisfaction level discriminant function analysis was employed and other test like factorial analysis were performed to check out which factor influence the investor most while making investment decision in Mutual fund. The result of DFA (Discriminant Function Analysis) concludes that hedge against inflation is the most important post investment satisfaction objective which discriminate young and middle adults. The factorial analysis indicates that financial position and fund capability is the two most important factors which an investor considers while making investment decision in Mutual Fund.
Keywords: Mutual Fund, Investment, Investor’s Preference, Discriminant Function Analysis
The history of Mutual fund begins with the set up of Unit Trust of India (UTI) in the year 1963. The initial growth stage of the industry was slow but it pace up in the year 1987 when other players approach into in the industry. The industry can be bifurcated into five phases: -
· First Phase involves the Origination and Development of UTI from 1964-87.
· Second Phase involves Entry of Public Sector Funds from 1987-1993.
· Third Phase involves Entry of Private Sector Funds from 1993-1996.
· Fourth Phase involves SEBI regulations epoch from 1996-2003.
· Fifth Phase involves Consolidation-Merger of various entities from UTI since 2004.
The growth of Asset under Management has also shown an increasing trend. As on September 2017, total AUM was 2,093,145 Cr. Thus, by summing up what mutual fund is it can be defined as: -
Mutual Fund is called unit trust or open ended trust – a company that invests the fund of its subscribers in diversified securities and in turn issues units representing shares in those holdings. (Chandra Prasanna).
Therefore, a research is needed to study the preference of mutual funds among customers so to know the current situation of the customer and it tells what exactly customer needs. In current situation where there is growing competition to cater the needs of customer is key to successful business organization.
Mutual fund industry is blooming industry. Every type of individual from retail to HNI is investing in mutual fund. Mutual fund provides the safety of risk which is high in stocks and also provides good returns then Fixed Deposits and Bank Accounts. Therefore, it is essential to study what exactly customer thinks, evaluates and expects from the mutual fund schemes. Also, different age brackets involve different fulfilment of financial needs. Hence, this study is undertaken to study the awareness, perception and preference of young and middle adults of ICICI Securities. And, so the following research questions support the researcher to hub on
1. Are the customers aware about mutual fund?
2. What is the perception of mutual fund among customers?
3. What is the Preference of mutual fund among customers?
4. What are the investment objectives customers have while investing in mutual fund?
5. Are customers satisfied with the post investment objectives?
Hence, the primary objective of the study is to know the preference of mutual fund among Young and Middle Adults.
Many researchers have published papers on the preference of mutual fund towards mutual fund. Few glimpses of the same are extracted below:-
(Arturo Rodríguez, 2017) The study was conduct in Spanish. The purpose of the study was to check whether the funds which belong to the same class can be comparable or not and how they are different from the other categories funds. A Discriminant Analysis tool is used to analyse the data and it was concluded that 33% funds are misclassified.
(Rajeswari, 2016) This study tries to indentify the impact of demographics factors on the selection of funds. It also focuses on to check the demographic profile of the investors, strategic attitude on selection of fund, type of fund preferred types of funds and return generated, and the type of funds and withdrawal option on the mutual fund scheme. The result shows that the investors invest in equity, debt, gilt, money market funds etc. and there is no different growth and dividend options consider by investors while selecting fund. The fund selection is based on the factors like past performance, reputation of fund manager and scheme's expenses.
(Sonali Agarwal, 2016) This study focuses on investor’s perception towards mutual fund scheme characteristics. The result concludes that age, occupation and qualification have an impact on investment decision.
(Khurshid, 2016) This paper studies the factors affecting the perception of investors towards mutual funds. The paper concludes that growth is most important investment objective and investor prefer to invest in mutual fund over stock as they are risk averse.
(Rahman, 2016) have undertaken a study drawing the focus on the preference of mutual fund in Dhaka City, Bangladesh. The study findings indicate that the demographic factors- gender, income and saving have a positive impact on the investor’s attitude towards mutual fund.
(Sajid Iqbal, 2015) The paper focuses on to study the perception of the investors towards mutual funds and how the socio-economic factors have an influence on the investor’s perception. The study results shows that the significant relationship of age, gender and income level and savings directly impact the investor’s perception towards Mutual fund.
(Narayanan, 2015) The paper study the awareness and preference of working women as investors for different investment vehicles available like bank deposits, small savings, life insurance schemes, bullions, corporate security- bonds, mutual funds, and equity and preference shares, pension plan, a home or some other mode of investment like investing in Real Estate (Property) or in saving schemes of post offices and to analyse the perception and factors affecting investment decision. It is concluded from the study that out of all investment vehicles working women considers Provident Fund and Post office MIS (Monthly Investment Scheme) a safest and most preferred investment vehicle.
(Arathy B, 2015) This study is undertaken to know the factors affecting investment decision in mutual fund and preference of it on retail investors. The findings from the study is that following factors affect the decision making i.e. tax benefits, high return, and price and capital appreciation.
(Mishra, 2015) This study examines the perception of small and large investors towards mutual funds. The paper result shows that the factor like investment, return and future are three important factors regarding the perception of mutual funds an investor holds. Small investors are approving for tax returns and investment while large investors are approving for future and returns.
(MUBARAK, 2014) This study tries to understand the investor’s perception and factors affecting their perception towards mutual funds. The result shows that investors consider mutual fund as a less risky investment avenue as compared to equity and Monthly Income Plan funds are mostly preferred by investors in lieu of equity. Though, many investors are not aware about the benefits of investing in mutual funds.
(Goel, 2014) The paper studies the factors affecting the perception of investors towards mutual fund. The result shows the growth is considered as most important investment objective while making decision in mutual fund. Past performance of the fund is considered as the most important factor. Majority of the investors uses absolute value while evaluating their fund returns performance. Private sector funds are selected over public sector funds.
(Karthikeyan, 2014) The paper studies the preference of investment to salaried class people in Tuticorn town. The result shows that it is necessary to examine the different investment alternatives and then to select the alternative which yields highest return with no capital loss and which also ensures liquidity.
(Rekha Rathore, 2014) The main aim of this study is to know the attitude of retail investor towards Mutual Fund in Haryana. The study concludes that majority of the investors have optimistic attitude towards mutual fund and they prefer to invest in mutual fund to get maximum return and minimum risk.
(Bhushan, 2014) This paper studies the relationship between financial literacy of salaried people and their awareness regarding financial products. The result shows that the financial literacy level of an individual affects the awareness and investment preferences of salaried individuals towards financial products. High financial literacy, high level of awareness of financial products except for post office savings.
(MINDARGI, 2013) The paper studies the investor’s attitude towards mutual fund. It also studies the benefits offered by mutual fund to investors. For this purpose, 200 sample sizes were taken in the Solapur city. The study observed that yet investors don’t have any particular attitude towards mutual fund.
(Kishore, 2013) The paper studies the investor’s awareness, preference and attitude towards mutual fund. The result shows that the majority of the investors opt to invest in Systematic Investment Plans. Investors prefer mutual funds due to professionally fund management and better returns and assessed funds through Net Asset Value and past performances.
(Chanchaia, 2012) The study was conducted in Thailand and the aim of the study was to how investors perceive two different types of mutual fund over there i.e. Bank related funds and Non-Bank Related Funds. The study tries to understand on which factors investors invest in Long Term Fund and Retirement Fund. The Perception of Convenience and confidence towards funds are the major factors while selecting bank and non-bank related funds.
(Arshad, 2012) This paper investigates the factors which the investors consider while investment decision in Mutual Fund and how they behave while making decision. The result concludes that investor’s age group and cities have different contact on fund selection scheme and income, education level and occupation has no impact. Few factors which affect the decision making are past performance of the fund, reputation of the company, withdrawal facility, company services and the performance of the investing company.
(RAO, 2011) The paper analyse the investors perception towards mutual fund schemes. The study purpose is to analyse the role of socio-economic factors on the investment decision of the investors. The study concluded that socio-economic factors do have an impact on the investment behaviour of the investors.
(Singh, A study on investors’ attitude towards mutual funds as an investment option, 2012)
This paper studies the investor’s attitude towards mutual fund. The result shows that the demographic factors such as gender, income and level of education have an impact on the investor’s attitude, while age and occupation doesn’t have an impact on the investor’s attitude.
(DR.SHANTANU MEHTA & CHARMI, 2012) This paper studies the investor’s preference of mutual fund and performance of mutual fund schemes. The research was undertaken in Ahmedabad and Baroda City and the study reveals that the factors that influence the purchase behaviour of the investors are the source of investment and mode of investment.
(SIMRAN SAINI, 2011) This paper studies the investor’s behaviour in reference of mutual fund investments. For studying the investor’s perception various factors like type of mutual fund scheme, main objective behind investing in mutual fund scheme, role of financial advisors and brokers, investors’ opinion relating to factors that attract them to invest in mutual funds, sources of information, deficiencies in the services provided by the mutual fund managers, challenges before the Indian mutual fund industry etc. have been used. The result shows that majority of the investors have optimistic approach towards mutual fund.
(Mariann R. Weierich, 2010) The paper aims is to study how our emotional attributes affects our financial planning. The objective of the paper is to study how different age groups have different financial needs and how the emotional capabilities in different age group affect financial planning.
(Miguel A. Ferreira, 2007) This paper undertakes research around 19 countries in the world with the sample size of 10,568 open-ended actively managed equity funds between 1999 and 2005. The study concludes that large funds perform better due to economies of scale. Young funds perform better in the funds investing aboard. As fees are higher in the funds which are managed by individual managers performs better. Funds of developed countries perform better.
Primary Data collection method was used to fulfil the objective of the study. Questionnaire method was used to conduct the primary data collection. Data was collected from 74 Young Adults and 24 Middle Adults of ICICI Securities of Ahmedabad.
Data Collection Instrument Validation
The face and content validity of the instrument is evaluated with the help of both internal and external guide. Both the guides were asked to offer the recommendations about the scale adopted and the scale reliability was checked with the help of Cronbach’s Alpha Reliability Test. The value comes to 0.824 which shows the good internal consistency of the scale item used for the study.
Sampling Design
The mutual fund customers of ICICI are very large and scattered all over the world. Therefore, it is not possible to conduct the research for all of the customers and hence, sampling technique is used to study the current problem. 100 sample sizes are taken to study the problem.
Table 1 - One-Variable Analysis
|
AGE |
RESPONDENTS |
|
Young Adult |
76 |
|
Middle Adult |
24 |
|
GENDER |
RESPONDENTS |
|
Male |
82 |
|
Female |
18 |
|
MARITAL STATUS |
RESPONDENTS |
|
Married |
62 |
|
Unmarried |
38 |
|
EDUCATION BACKGROUND |
RESPONDENTS |
|
Post-Graduate |
75 |
|
Graduate |
22 |
|
12th Pass Out |
1 |
|
Others |
2 |
|
OCCUPTION/PROFESSION |
RESPONDENTS |
|
Salaried |
75 |
|
Professional |
11 |
|
Business man |
11 |
|
Student |
2 |
|
Others |
1 |
|
FAMILY SIZE |
RESPONDENTS |
|
Less than 4 |
35 |
|
4 to 6 |
61 |
|
Above 6 |
4 |
|
NO. OF EARNING MEMBERS IN THE FAMILY |
RESPONDENTS |
|
1 |
30 |
|
2 |
51 |
|
3 & above |
19 |
|
YEARLY INCOME |
RESPONDENTS |
|
Below 1 lac |
3 |
|
1-5 Lac |
30 |
|
5-10 lac |
45 |
|
10-25 lac |
20 |
|
More than 25 lac |
2 |
|
WAY OF INVESTMENT |
RESPONDENTS |
|
Lump Sum |
17 |
|
SIP |
32 |
|
Both |
51 |
|
PURPOSE OF INVESTMENT |
RESPONDENTS |
|
Long Term Investor |
82 |
|
Day Trader |
2 |
|
Both |
16 |
|
MODE OF TRADING |
RESPONDENTS |
|
Online |
72 |
|
Offline |
3 |
|
Both |
25 |
|
YEAR OF INVESTMENT IN MF |
RESPONDENTS |
|
1-2 years |
42 |
|
3-4 years |
34 |
|
4-5 years |
8 |
|
More than 5 years |
16 |
|
RISK ASSOCIATED WITH MF |
RESPONDENTS |
|
Low |
19 |
|
Moderate |
71 |
|
High |
10 |
|
SOURCE OF KNOWLEDGE |
RESPONDENTS |
|
Internet |
27 |
|
Advisor |
27 |
|
Advertisement |
7 |
|
Newspaper/Journal |
14 |
|
Friends/Family & Relatives |
22 |
|
Television |
3 |
|
% OF INCOME SAVED |
RESPONDENTS |
|
1 to 3 |
26 |
|
4 to 6 |
12 |
|
7 to 9 |
17 |
|
10 & above |
45 |
|
AMOUNT INVESTED IN SIP |
RESPONDENTS |
|
Rs. 1,000-5,000 |
46 |
|
Rs. 6,000-10,000 |
24 |
|
Rs. 11,000-15,000 |
15 |
|
Rs. 16,000- 20,000 |
5 |
|
More than Rs. 20,000 |
10 |
|
AWARENESS REGARDING RETURN ON SIP |
RESPONDENTS |
|
Yes |
89 |
|
No |
11 |
Table 2 – Response of Investment Objective
|
INVESTMENT OBJECTIVE |
VERY HIGH |
HIGH |
NEUTRAL |
LOW |
VERY LOW |
|
DIVIDEND |
23 |
36 |
36 |
5 |
0 |
|
CAPITAL APPRECIATION |
53 |
36 |
11 |
0 |
0 |
|
QUICK GAIN |
37 |
42 |
21 |
0 |
0 |
|
SAFETY |
49 |
35 |
16 |
0 |
0 |
|
LIQUIDITY |
40 |
42 |
18 |
0 |
0 |
|
TAX BENEFITS |
40 |
34 |
26 |
0 |
0 |
|
DIVERSIFICATION OF ASSETS |
38 |
35 |
27 |
0 |
0 |
|
HEDGE AGAINST INFLATION |
32 |
35 |
30 |
3 |
0 |
Table 3 - Relationship between Gender and Mode of Trading Mutual Fund
|
CHI-SQUARE TESTS |
|||
|
Value |
Df |
Asymp. Sig. (2-sided) |
|
|
Pearson Chi-Square |
.828a |
2 |
.661 |
|
Likelihood Ratio |
1.360 |
2 |
.507 |
|
Linear-by-Linear Association |
.212 |
1 |
.645 |
|
N of Valid Cases |
100 |
||
|
a. 3 cells (50.0%) have expected count less than 5. The minimum expected count is .54. |
|||
The P value of the test comes to .661 which is higher than 0.05, so the null hypothesis is accepted that “Gender and Mode of Trading in Mutual Fund is not related”.
Table 4 - Relationship between Income and Percentage of savings from total income
|
CHI-SQUARE TESTS |
|||
|
Value |
df |
Asymp. Sig. (2-sided) |
|
|
Pearson Chi-Square |
21.529a |
12 |
.043 |
|
Likelihood Ratio |
24.028 |
12 |
.020 |
|
Linear-by-Linear Association |
9.231 |
1 |
.002 |
|
N of Valid Cases |
100 |
||
|
a. 11 cells (55.0%) have expected count less than 5. The minimum expected count is .24. |
|||
The P value of the test comes to .043 which is less than 0.05, so the null hypothesis is rejected that “Income and Percentage of savings from total income is not dependent of each other.”
Table 5 – Satisfaction Level of respondents with post investment objectives
|
ONE-SAMPLE TEST |
||||||
|
Test Value = 3 |
||||||
|
t |
df |
Sig. (2-tailed) |
Mean Difference |
95% Confidence Interval of the Difference |
||
|
Lower |
Upper |
|||||
|
Q20_1_Dividend_Level_of_satisfication_after_investment |
-13.269 |
99 |
.000 |
-.95000 |
-1.0921 |
-.8079 |
|
Q20_2_Capital_Appreciation_satisfication_after_investment |
-18.352 |
99 |
.000 |
-1.28000 |
-1.4184 |
-1.1416 |
|
Q20_3_Quick_Gain__satisfication_after_investment |
-13.331 |
99 |
.000 |
-1.09000 |
-1.2522 |
-.9278 |
|
Q20_4_Safety_satisfication_after_investment |
-15.541 |
99 |
.000 |
-1.17000 |
-1.3194 |
-1.0206 |
|
Q20_5_Liquidity_satisfication_after_investment |
-14.590 |
99 |
.000 |
-1.18000 |
-1.3405 |
-1.0195 |
|
Q20_6_Tax_benefit_satisfication_after_investment |
-15.271 |
99 |
.000 |
-1.17000 |
-1.3220 |
-1.0180 |
|
Q20_7_Diversification_of_assets_satisfication_after_investment |
-12.824 |
99 |
.000 |
-1.06000 |
-1.2240 |
-.8960 |
|
Q20_8_Hedge_against_Inflation_satisfication_after_investment |
-12.636 |
99 |
.000 |
-1.00000 |
-1.1570 |
-.8430 |
The significance value of the test comes to .000 which is less than 0.05, so the null hypothesis is rejected that “Respondents are not satisfied with post investment objectives.
Table 6 - Mean and Standards Deviation Values of Predictor Variables
|
AGE |
DISCRIMANTING FACTORS |
MEAN |
STD. DEVIATION |
|
Young Adult |
Q20_5_Liquidity_satisfication_after_investment |
1.6000 |
.73679 |
|
Q20_6_Tax_benefit_satisfication_after_investment |
1.8667 |
.99043 |
|
|
Q20_7_Diversification_of_assets_satisfication_after_investment |
1.6667 |
.97590 |
|
|
Q20_8_Hedge_against_Inflation_satisfication_after_investment |
1.8000 |
.86189 |
|
|
Middle Adult |
Q20_5_Liquidity_satisfication_after_investment |
1.8000 |
.67612 |
|
Q20_6_Tax_benefit_satisfication_after_investment |
1.6667 |
.61721 |
|
|
Q20_7_Diversification_of_assets_satisfication_after_investment |
2.1333 |
.63994 |
|
|
Q20_8_Hedge_against_Inflation_satisfication_after_investment |
2.3333 |
.48795 |
As the two groups (young adults/middle adults) are to be compared on the basis of four post investment satisfaction level of the investors, namely, liquidity, tax benefits, diversification and hedge against inflation it will be useful to compute their mean values to get an idea of the differences in their mean score. The mean score along with the standard deviations of the four post investment satisfaction level of the investors are presented in the above table.
It is observed from the table that the mean score for liquidity of young adult is 1.6000 and of middle adult is 1.8000. The difference in the score of young adult for diversification is 1.6667 and of middle adult are 2.1333. Similar results were obtained for hedge against inflation. However, for tax benefits the score for young adult (1.8667) is slightly higher than middle adults (1.6667).
Therefore, at the outset one may expect that all these predictor variables except tax benefits could be useful in discriminating between young adults and middle adults.
However, in terms of variability, the standard deviations of variables vary a lot except liquidity.
Table 7 - Unstandarized Discriminant Function
|
CANONICAL DISCRIMINANT FUNCTION COEFFICIENTS |
|
|
Function |
|
|
1 |
|
|
Q20_5_Liquidity_satisfication_after_investment |
.653 |
|
Q20_6_Tax_benefit_satisfication_after_investment |
-1.360 |
|
Q20_7_Diversification_of_assets_satisfication_after_investment |
.615 |
|
Q20_8_Hedge_against_Inflation_satisfication_after_investment |
1.146 |
|
(Constant) |
-2.243 |
|
Unstandarized coefficients |
|
The basic principle in the estimation of a discriminant function is that the variance between the groups relative to the variance within the group should be maximized. The ratio of between group variance to within group variance is given by eigenvalues. A higher eigenvalue is always desirable.
The results in the below table can be written in the form of discriminant function as:
Y= -2.243+0.653X1 – 1.360 X2 + 0.615X3 + 1.1456X4
Where, Y = Discriminant score
X1 = Liquidity
X2 = Tax benefits
X3 = Diversification
X4 = Hedge against inflation
Table 8 - Eigenvalues
|
Function |
Eigenvalue |
% of Variance |
Cumulative % |
Canonical Correlation |
|
1 |
.453a |
100.0 |
100.0 |
.558 |
|
a. First 1 canonical discriminant functions were used in the analysis. |
||||
The last column of the above table indicates canonical correlation, which is the simple correlation coefficient between the discriminant score and their corresponding group membership (young adult/middle adult). The value of this is 0.558, which the readers may verify. The square of the canonical correlation is (0.558)2 = 0.3114, which means 31.14% of the variance in the discriminating model between a prospective young adults and middle adults is due to the changes in the four predictor variables, namely, liquidity, tax benefits, diversification and hedge against inflation.
Table 9 - Significance of Discriminant Function Model
|
WILKS' LAMBDA |
||||
|
Test of Function(s) |
Wilks' Lambda |
Chi-square |
Df |
Sig. |
|
1 |
.688 |
9.716 |
4 |
.045 |
It is found that the value of Wilk’s Lambda is 0.688. It takes a value between 0 and 1 and lower the value of Wilk’s Lambda, the higher is the significance of the discriminant function.
Therefore, a 0 (zero) value would be the most preferred one. The statistical test of significance for Wilk’s Lambda is carried out with the chi-squared transformed statistic, which in this case is 9.716 with 4 degree of freedom (number of predictor variables) and a p value of 0.045.
Since, the p value is less than 0.05, the assumed level of significance, it is inferred that the discriminant function is significant and can be used for further interpretation of the results.
Table 10 - Classification of Cases Using The Discrimant Function
|
Functions at Group Centroids |
|
|
Q1_what_is_your_age |
Function |
|
1 |
|
|
Young Adult |
-.650 |
|
Middle Adult |
.650 |
|
Unstandardized canonical discriminant functions evaluated at group means |
|
One can also compute the mean discriminant scores of the young adults and middle adults separately. This is known as Group Centroids. This works out to be -0.650 for a young adults and +0.650 for a middle adult.
The value of the function at group centroids (means) given in the above table can be used for designing a decision rule to classify a investor into young adult and middle adult category. If the size of the sample for the two groups is the same while estimating the model, the cut-off score used for classification into young adult/middle adult category can be obtained by taking the average of the two-group centroid. In the present case, the average works out be (-0.650 +0.650)/2 = 0. It is shown below as:-
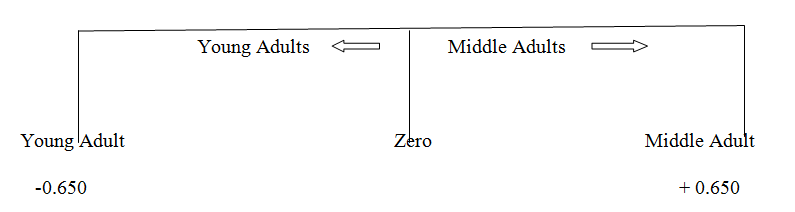
Now, any respondent whose discriminant score is greater than zero would be classified as a prospective investor, whereas the one with score less than zero would be classified as a not potential investor.
Therefore, it may be inferred that a high score on liquidity, diversification and hedge against inflation is likely to classify the respondent into prospective investors while tax benefits would classify the respondent into not potential investors.
Table 11 - Standardized Discriminant Function Coefficient
|
Function |
|
|
1 |
|
|
Q20_5_Liquidity_satisfication_after_investment |
.462 |
|
Q20_6_Tax_benefit_satisfication_after_investment |
-1.122 |
|
Q20_7_Diversification_of_assets_satisfication_after_investment |
.507 |
|
Q20_8_Hedge_against_Inflation_satisfication_after_investment |
.802 |
It can be interpreted that the discriminant coefficient exactly in the same way as a regression coefficient. This means that each coefficient reflects the relative contribution of each of the predictor variable on the discriminant function. A small value of the discriminant coefficient means that the impact of a unit change in a predictor variable is small in the discriminant function score.
The standardized discriminant function does not have a constant term in it, whereas the unstandarized discriminant function has a constant term. The coefficient of unstandarized discriminant function depends upon the units of measurement, whereas the coefficients of standardized discriminant function are independent of the units of measurements. The absolute values of the coefficients in standardized discriminant function indicate the relative contribution of the variables in discriminating between the two groups. Above table gives the standardized canonical discriminant function coefficients. It indicates that hedge against inflation is the most important satisfaction level objective which discriminates between the young adults and middle adults, followed by diversification, liquidity and tax benefits.
Table 12 - Out-Of-Sample Performance
|
1 |
Y = |
-2.243 + 0.653 * 3 -1.360 * 3 + 0.615 * 2 + 1.1456 * 1 |
= |
-1.9884 |
|
2 |
Y = |
-2.243 + 0.653 * 2 -1.360 * 2 + 0.615 * 1 + 1.1456 * 2 |
= |
-0.7508 |
|
3 |
Y = |
-2.243 + 0.653 * 1 -1.360 * 2 + 0.615 * 3 + 1.1456 * 3 |
= |
0.9718 |
|
4 |
Y = |
-2.243 + 0.653 * 1 -1.360 * 3 + 0.615 * 1 + 1.1456 * 1 |
= |
-3.9094 |
|
5 |
Y = |
-2.243 + 0.653 * 1 -1.360 * 1 + 0.615 * 1 + 1.1456 * 1 |
= |
-1.1894 |
|
6 |
Y = |
-2.243 + 0.653 * 1 -1.360 * 1 + 0.615 * 3 + 1.1456 * 3 |
= |
2.23318 |
|
7 |
Y = |
-2.243 + 0.653 * 1 -1.360 * 1 + 0.615 * 3 + 1.1456 * 2 |
= |
1.1862 |
|
8 |
Y = |
-2.243 + 0.653 * 1 -1.360 * 2 + 0.615 * 2 + 1.1456 * 1 |
= |
-1.9334 |
|
9 |
Y = |
-2.243 + 0.653 * 2 -1.360 * 1 + 0.615 * 3 + 1.1456 * 3 |
= |
2.9848 |
|
10 |
Y = |
-2.243 + 0.653 * 1 -1.360 * 1 + 0.615 * 2 + 1.1456 * 2 |
= |
0.5712 |
This method is used to test the validity of the discriminant model. The total number of observations used to build the model was 10. As a matter fact, the survey contained 100 observations, of which 10 were used to build the model. The remaining 5 observations were kept as ‘hold-out’ samples to test the out-of-sample performance of the model.
Using the estimated discriminant function:
Y= -2.243+0.653X1 – 1.360 X2 + 0.615X3 + 1.1456X4
It is noted that out of 5 young adults, 4 are classified correctly as their discriminant score is less than zero. Further, out of the 5 middle adults in the hold-out samples, 4 are classified correctly, as their discriminant score is greater than zero. Therefore, out of 10 cases, 8 are correctly classified resulting in and out-of the sample accuracy of 75 percent.
Through the analysis it was withdrawn from the study that Hedge against Inflation is the most important post investment objective which discriminate young and middle adults. Capital Appreciation and Safety is the most important investment objective while investors want when they invest through ICICI Mutual Fund.
The research clearly shows that almost of the respondents are satisfied with ICICI services still some of the recommendations which could be given to the company are that company should decrease their brokerage charges, account opening charges and annual charges. Also, company should create more seminars and expert session for their online portal.
In mutual fund industry, ICICI online portal i.e. I-Direct is the most customer friendly portal through which the needs and expectations of the customers are fulfilled in such a competitive era. ICICI direct aims to provide consistent services, better portfolio management services, transparency in the investment, providing more returns, providing daily updates regarding the stock information and provides various features in Mutual Fund section like Pause SIP, Step-up, and Till Cancellation etc.
Bibliography
Arathy B, A. A. (2015). A Study on Factors Affecting Investment on MutualFunds and Its Preference of Retail Investors. VishwaVidyapeetham: International Journal of Scientific and Research Publications.
Arshad, D. M. (2012). FACTORS VALUED BY INVESTORS WHILE INVESTING IN MUTUAL FUNDS-A BEHAVIORAL CONTEXT. Multan- Pakistan: Online.
Arturo Rodríguez, C. &. (2017). Spanish mutual fund misclassification: Empirical evidence. SPANISH: Online.
Bhushan, P. (2014). Relationship between Financial Literacy and Investment Behavior of Salaried Individuals. Solan, Himachal Pardesh: Journal of Business Management & Social Sciences Research (JBM&SSR).
Chanchaia, M. (2012). Portfolio Choice toward Bank Related and Non BankRelated Mutual Funds in Thailand: A Case of Bangkok. Pattaya, Thailand: Procedia - Social and Behavioral Sciences.
DR.SHANTANU MEHTA & CHARMI, S. (2012). Preference of Investors for Indian Mutual Funds and its Performance Evaluation. Ahmedabad & Baroda: Pacific Business Review International.
Goel, R. K. (2014). Factors Affecting Perception of Investors Towards Mutual Funds. Ludhiana: Online.
Karthikeyan, V. S. (2014). A Study on Preference of Investment-with special reference to salaried class people in Tuticorin Town. Tuticorin - TamilNadu: Online.
Khurshid, R. (2016). Investors perception and behaviour towards mutual funds as an investment option. Jammu and Kashmir: International Journal of Advanced Research and Development.
Kishore, Y. P. (2013). Investor’s preferences towards Mutual Fund and Future Investments: A Case study of India. India: International Journal of Scientific and Research Publications.
Mariann R. Weierich, E. A. (2010). Older and wiser? An affective science perspective on agerelated challenges in financial decision. New York: Oxford University Press.
Miguel A. Ferreira, A. F. (2007). The Determinants of Mutual Fund Performance: A Cross-Country Study. 19 Countries: ISCTE Business School.
MINDARGI, P. P. (2013). A STUDY OF INVESTORS ATTITUDE TOWARDS MUTUAL FUND WITH SPECIALREFERENCE TO INVERSOTRS IN SOLAPUR CITY. Solapur: Trans Stellar.
Mishra, R. (2015). Perceptions of Investors towards Mutual Funds: An Analytical Study in Odisha. Bhubaneswar: International Journal on Recent and Innovation Trends in Computing and Communication.
MUBARAK. (2014). PERCEPTION OF INVESTORS TOWARDS INVESTMENT IN MUTUALFUNDS WITH SPECIAL REFERENCE TO MIP (MONTHLY INCOMEPLAN) FUNDS. Bellary, Karnataka: Online.
Narayanan, S. R. (2015). Investment pattern of working women in the twin cities of Hyderabad and Secunderabad – A study. Hyderabad & Secunderabad: Online.
Rahman, N. N. (2016). An Analytical Study on Investors’ Preference towards Mutual Fund Investment: A Study in Dhaka City, Bangladesh. International Journal of Economics and Finance , 8 , 8.
Rajeswari, N. D. (2016). A Study on Strategic Attitude of Individual Investors in Mutual Fund Investment Decisions. Coimabtore: Online.
RAO, D. (2011). ANALYSIS OF INVESTORS’ PERCEPTIONS TOWARDS MUTUAL FUND SCHEMES (WITH REFERENCE TO AWARENESS AND ADOPTION OFPERSONAL AND FAMILY CONSIDERATIONS). Visakhapatnam: Online.
Rekha Rathore, S. &. (2014). Attitude of Investor towards Mutual Fund: A Case Study of Retail Investors in District Yamuna Nagar, Haryana (India). Yamuna Nagar: International Journal of Management and Social Sciences Research.
Sajid Iqbal, D. N. (2015). Impact of Socio-Economic Factors of Investor Perception: A Case of Mutual Funds Association of Pakistan. Pakistan: Online.
SIMRAN SAINI, S. S. (2011). INVESTORS’ AWARENESS AND PERCEPTION ABOUT MUTUAL FUNDS. Mohali: Online.
Singh, D. B. (2012). A study on investors’ attitude towards mutual funds as an investment option. Patna: Online.
Sonali Agarwal, D. C. (2016). Determinants of Mutual Funds Investor Preferences and Returns in India: An Empirical Assessment in Delhi- NCR Region. Delhi-NCR: Online.