Pacific B usiness R eview I nternational

A Refereed Monthly International Journal of Management Indexed With THOMSON REUTERS(ESCI)
|
Dr. Avni Patel Asst. Professor Faculty of Management, GLS University Law Garden, Ellis Bridge, Ahmedabad - 380006 Study of Financial Literacy among Residents of Gujarat |
Financial Literacy is all about how well the people understand basic concepts related to finance. Basic understanding of financial concepts is defined as financial literacy of the person. To achieve objective of financial inclusion, people must be financially literate first. So to observe the financial literacy of the respondents of Gujarat, particular study is undertaken. Study is descriptive in nature and 600 samples from four major cities of Gujarat has been selected for the same. Scope of the study is confined to salaried employees of Govt., Public and Private sectors. To assess the financial literacy respondents were asked eight questions which pertains to basic and advanced financial literacy. Study reveals that respondents of Gujarat possess fair financial literacy.
Key Words : Financial Literacy, Gujarat.
Definitions and Concept of Financial Literacy
Various researchers and organizations have provided different definitions of financial literacy. Some of the definitions are discussed here. Financial Literacy is a combination of awareness, knowledge, skill, attitude and behaviour necessary to make sound financial decisions and ultimately achieve individual financial well-being. (OECD INFE, 2011). According to PACFL, “Financial Literacy is the ability to use knowledge and skills to manage financial resources effectively for a lifetime of financial well-being”. Lusardi & Mitchell (2007) have defined it as the most basic economic concepts needed to make sensible savings and investment decisions.
Need of Financial Literacy
Need of financial literacy is increasing significantly with deregulation and globalization of financial markets. More choices are available for investment avenues with easy access to credit cards and personal loan. Beal and Delpachitra (2003) had stated that, “the need for financial literacy has grown rapidly over the last decade because financial markets have been deregulated and credit has become easier to obtain, as financial institutions compete strongly with each other for market share.” Financial literacy is important because well informed, well-educated consumers should make better decisions for their families; increase their economic security and well-being; contribute to vital thriving communities; and foster community economic development”.(Hogarth, 2002)
Approaches to Calculate Financial Literacy
Financial literacy is associated with financial well-being and financial satisfaction of an individual. Increase in Financial Literacy will help investors to make informed choices, which, in turn, helps nation to build strong financial system and will help to achieve goal of Financial Inclusion. Many government bodies like SEBI & RBI has realized the value of financial literacy and to increase that, they have started various financial education programmes. To design the program for investors, one really needs to know what is the current level of financial literacy that investors possess and then course can be designed to suit their literacy level.
There are different methods adopted by researchers and certain organizations to measure the current level of financial literacy of the investors. Definitions on Financial Literacy provided by different researchers serve as the basis for items to be included in research instrument to measure the financial literacy. Some researchers have developed the scale for Self-Assessment of Respondents and some have given performance test. Basic items covered in different researches are Time value of Money, Calculation of Interest Rate, Relation between Risk & Return, Inflation, Diversification etc. Scale used in the present study is adopted from Lusardi & Mitschell ( 2008) and modified according to Indian context.
According to Hung A. et. al. (2012), there is a positive impact of financial literacy on financial attitude, behaviour and financial well-being. Financially literate people do better at budgeting, saving money and spending, handling mortgages, participating in other financial markets, do better at retirement planning and successfully accumulate wealth.Higher financial literacy leads to greater financial well-being and less financial concerns. (Taft M, 2013) . Capuano, A., & Ramsay, I. (2011) had done project in Australia on Financial Literacy. According to them Financially Literate consumers can have more savings, they can actively manage debt, they can be realistic regarding their future goals, they can be more financially confident, can be more active in financial markets, they can choose more carefully financial products that are suitable to their needs, they can plan their finances, budget and know how to be financially efficient. They have also stated that in a way financially literate people benefit financial system and economy too. They can help in achieving the target for Financial Inclusion in the economy. Financially literate people can better understand the Financial policies framed by any government. Andreas Borden L. (2008) stated that there is a causal link from financial knowledge to healthy attitudes about money which in turn influences the behaviour. Gallery N, Newton C.& Palm C ( 2010) had presented the model on variables which influences Financial Well Being. It is evident from model that Financial Well- Being is dependent on Personal Financial Behaviour which in turn depends upon Financial Literacy.
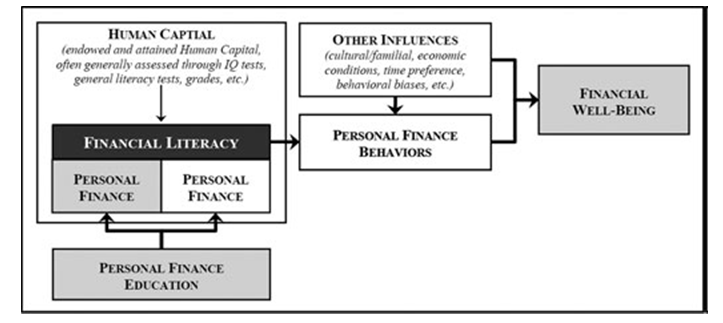 FIGURE 1. 1 - Possible Causes of Financial Behaviour
(Source: 18th Annual Colloquium of Superannuation Researchers, UNSW, Sydney, Australia, 12-13 July 2010).
Mohamad R. (2010 ) found that there are significant differences in financial literacy between Gender and Working Sector. Study was conducted in Malaysia. Researcher stated that there is a significant impact of Gender on frequency of managing Financial Planning, but working sector didn’t have any impact on frequency for managing personal financial planning. Altintas, K. M. (2011) in his study tried to find variables that significantly affect the financial literacy of the respondents. Study was carried in Turkey on University Students. Independent variable was financial literacy score and dependent variables tested were Age, Rank in class, Gender, Academic Discipline, Family Income, Education level of Father, Education level of Mother and Participants’ discussion with their parents about Financial Matters. Multiple Regression method was used to find out factors affecting Financial Literacy score. The most important variables that affect the financial literacy are Class Rank, Age, Education level of Father and Participants’ discussion with their parents regarding financial Matters and Family Income. Ali, A., Rahman, M. S., & Bakar, A. (2013) had done research to find factors contributing to level of financial literacy and its relation with financial satisfaction. Study was done in Malaysia. Researcher had hypothesized model on financial literacy. Model postulated that financial literacy of the person can determine financial satisfaction of the person. To measure the financial literacy, five different aspects were assessed. They were: Basic money management, financial planning, investment know how, attitude to money and financial activities. Model hypothesized by researcher is shown in Figure 1.2.
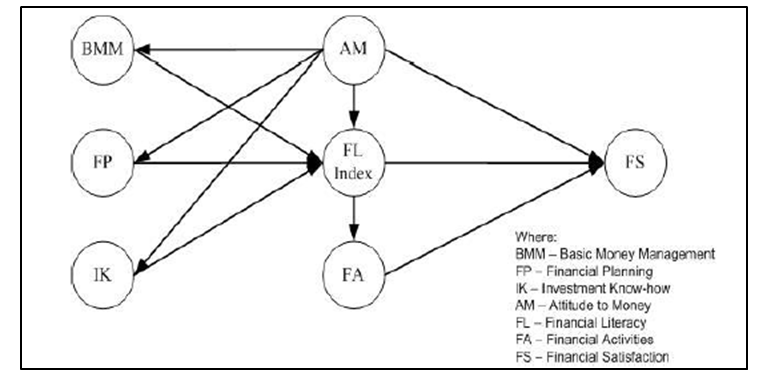 FIGURE 1.2 - Research Model on Financial Literacy
(Source: Financial Literacy and Satisfaction in Malaysia: A Pilot Study. International Journal of Trade, Economics and Finance, Vol. 4, No. 5, October 2013)
Jariwala H. (2013) had done her study to assess the financial literacy of the investors of Gujarat State. Sample of 385 investors were collected across Gujarat state with the help of convenience sampling technique. Data were analyzed with the help of descriptive analysis, chi square, logistic regression and factor analysis. Results showed that 56% of the respondents are financially literate and 44% are financially illiterate. Females possess lower financial literacy then males. Study also found that age and income also has significant impact on financial literacy. Altaf N. (2014) had done study to assess the financial literacy of the students studying in the Central University of Kashmir. Samples size was 100 students of different post graduate courses. Primary data was collected with the help of structured questionnaire designed with balanced five point Likert scale. Financial literacy was assessed in four parts, first part was measurement of perception towards definition and theories, second part was measuring the ability of respondents to manage personal finance, third part was related to measurement of constraints of financial literacy, and fourth part was on measurement of respondents view towards way to improve financial literacy. Mean analysis was used to analyze the data. From the results, it is evident that students don’t have the satisfactory level of financial literacy.
· For purpose of fulfilling the objectives defined earlier Descriptive Research Design was most suitable. Hence it has been adopted for conducting study.
|
150 Residents of Ahmedabad City |
50 Govt. Employees+ 50 Public Sector Employees + 50 Private Sector Employees |
|
150 Residents of Baroda City |
50 Govt. Employees+ 50 Public Sector Employees + 50 Private Sector Employees |
|
150 Residents of Rajkot City |
50 Govt. Employees+ 50 Public Sector Employees + 50 Private Sector Employees |
|
150 Residents of Surat City |
50 Govt. Employees+ 50 Public Sector Employees + 50 Private Sector Employees |
Source: Primary Data
For the study, secondary data were collected from various Books, journals, thesis, periodicals, magazines, newspapers and Websites.For the study primary data has been collected through structured questionnaire. Questionnaires were filled by respondents through one to one approach.
Financial literacy was classified as (1) basic financial literacy and (2) advance financial literacy (Lusardi Annamaria , 2012). To identify the basic level of financial literacy, respondents were asked questions related to compounding of Interest Rate, Inflation, and Diversifications. To identify advance level of financial literacy, respondents were asked questions related to Risk Return Relationship, concept of Time Value of Money, relationship between interest rate and bond price etc. At the end of the question, four options are provided out of which one was correct. The Question and the frequency of the an
Results of Frequency Analysis
Suppose you had Rs. 1000 in Saving Bank account and interest rate was 2% per year, after 5 years how much do you think you would have earned in saving account, if you had left your money to grow:
it is evident that 80 % of the respondents have given correct answer for the same. Only 20% of the respondents have given false answer.
|
Frequency |
Percent |
Cumulative Percent |
||
|
Valid |
False |
120 |
20.0 |
20.0 |
|
True |
480 |
80.0 |
100.0 |
|
|
Total |
600 |
100.0 |
||
Source: Primary Data
around 71% of the respondents had given correct answer for the same and 29 % had given incorrect answer.
|
Frequency |
Percent |
Cumulative Percent |
||
|
False |
174 |
29.0 |
29.0 |
|
|
True |
426 |
71.0 |
100.0 |
|
|
Total |
600 |
100.0 |
||
Source: Primary Data
Question was asked to check the knowledge regarding time value of money. From Table,it is evident that 64% of the respondents possess fair knowledge of time value of money. Only 36% of the respondents had given incorrect answer.
|
Frequency |
Percent |
Cumulative Percent |
||
|
False |
216 |
36.0 |
36.0 |
|
|
True |
384 |
64.0 |
100.0 |
|
|
Total |
600 |
100.0 |
||
Source: Primary Data
As a part to check the knowledge regarding concept of diversification, the particular question was asked. The answers have been classified as either True or False and are tabulated in Table. It is evident that 72% of the respondents gave correct answer that Mutual funds give safer return than a single company stock. 28 % of the respondents failed to give correct answer.
|
Frequency |
Percent |
Cumulative Percent |
||
|
Valid |
False |
168 |
28.0 |
28.0 |
|
True |
432 |
72.0 |
100.0 |
|
|
Total |
600 |
100.0 |
||
Source: Primary Data
The question is asked to check basic awareness regarding Financial Planning. It is generally observed that people conceptualize Financial Planning as investing only into insurance. Whereas, a Balanced Financial Plan is composed of Insurance, Investments, Debt, Retirement, Taxation and Estate Planning. From Table, it is evident that 80 % of the respondents have given correct answer for the same while 20 % of the respondents gave incorrect answers.
|
Frequency |
Percent |
Cumulative Percent |
||
|
Valid |
False |
120 |
20.0 |
20.0 |
|
True |
480 |
80.0 |
100.0 |
|
|
Total |
600 |
100.0 |
||
Source: Primary Data
From Table, it is evident that 80% of the respondents have given correct answer for the same. 20 % of the respondents failed to give correct answer.
|
Frequency |
Percent |
Cumulative Percent |
||
|
Valid |
False |
120 |
20.0 |
20.0 |
|
True |
480 |
80.0 |
100.0 |
|
|
Total |
600 |
100.0 |
||
Source: Primary Data
Particular question deals with economy’s concept of relationship between price of the bond and interest rate in the market. If interest rate in economy will go down, the price of bond will go high and vice-a versa. Table shows that majority i.e. 60 % of the respondents fails to give correct answer, only 40% of the respondents were aware about the relationship between interest rate in economy and price of bond.
|
Frequency |
Percent |
Cumulative Percent |
||
|
Valid |
False |
360 |
60.0 |
60.0 |
|
True |
240 |
40.0 |
100.0 |
|
|
Total |
600 |
100.0 |
||
Source: Primary Data
Particular question was asked to check awareness regarding different financial instruments available in the economy and their normal features. From Table, it is evident that 54 % of the respondents failed to give correct answer, which is equity which generates higher return in the long run. 46 % of the respondents gave correct answer. It is interesting to note that majority of the respondents have chosen bond as an instruments which provides higher return in the long run.
|
Frequency |
Percent |
Cumulative Percent |
||
|
Valid |
False |
324 |
54.0 |
54.0 |
|
True |
276 |
46.0 |
100.0 |
|
|
Total |
600 |
100.0 |
||
Source: Primary Data
Table 1.10shows the overall summary for financial literacy. Respondents possessed fairly good knowledge of basic financial literacy. Only two questions pertaining to advanced financial literacy were such where more incorrect answers were observed. To check the overall performance of the respondents pertaining to correct answers given by individual respondents, Modal value of the responses was calculated with the help of excel sheet. Mode of the responses came out to be 6. Which shows that out of 8 questions, majority of the respondents have given 6 correct answers. It can be summarized through the Table that overall people possessed fairly good knowledge of financial literacy regarding all the parameters.
|
Levels |
Sr. No |
Parameters on which literacy has been checked |
Frequency (%) |
Interpretation |
|
Basic Literacy |
1 |
Saving Bank Interest |
80 |
From the above data it is observed that respondents possessed fair literacy regarding all the parameters asked. Only 2 parameters: Working of Bond and Returns on Long Term Investments has shown little low literacy. |
|
2 |
Inflation |
71 |
||
|
3 |
Time Value of Money |
64 |
||
|
Advanced Literacy |
4 |
Concept of Diversifications |
72 |
|
|
5 |
Basics of Financial Planning |
80 |
||
|
6 |
Relation between Risk & Return |
80 |
||
|
7 |
Relationship of Bond Price & Interest Rates |
40 |
||
|
8 |
Returns generated by financial assets in long run |
46 |
Source: Primary Data
Jariwala H. (2013) had stated that median can be used to find out the status of financial literacy of the respondent. One can take overall score of correct answers given by respondents, and then median of the score is found. Respondents scoring above median score are known to be financially literate while those with score below that are financially illiterate. The same method is adopted in the present study to find out whether respondent is financially literate or not. In the present research, 8 questions pertaining to financial literacy were asked. With the help of Microsoft Excel score of each respondent in terms of correct answers provided by them was found. Median of these scores was found to be 6. So, respondents who gave 6 or more than 6 correct answers are financially literate and those with less than 6 are financially illiterate. Table 1.11shows the frequency of Financially Literate and Illiterate Respondents.
|
Frequency |
Percent |
Cumulative Percent |
||
|
Valid |
Financial Illiterate |
282 |
47.0 |
47.0 |
|
Financial Literate |
318 |
53.0 |
100.0 |
|
|
Total |
600 |
100.0 |
|
|
Source: Primary Data
Table 1.11depicts that 47 % of the respondent are financially illiterate and 53% of the respondents are financially literate.
Basic Financial Literacy
. 80 % of the respondents know the working of cumulative interest rate %age calculation. Only 20% of the respondents have failed to give correct answer for the same.
· 71% of the respondents have basic idea regarding impact of inflation on purchasing power. 29 % have given incorrect answer for the same.
· 64% of the respondents possess fair knowledge of time value of money . 36% of the respondents failed to give correct answer for the same.
· 72% of the respondents have fair idea related to concept of diversification . 28 % of the respondents don’t have idea about diversification. When asked, they replied that Single Company Stock provides generally more returns than Mutual Funds.
· 80 % of the respondents have idea regarding balanced financial plan. They believe that Financial Planning is not only buying insurance . 20 % of the respondents have misconception that Financial Planning is all about buying insurance.
Advanced Financial Literacy:
· 80% of the respondents understand that risk and return goes hand in hand. 20 % of the respondents failed to give correct answer for the same.
· Only 40 % of the respondents gave correct answer for the relationship between Bond Price and Interest Rate . 60% of the respondents are not aware about the relationship between interest rate in economy and price of bond.
· 46 % of the respondents have idea regarding financial literacy related to awareness of financial products and returns generated by them. 54 % of the respondents failed to give correct answer.
Overall Financial Literacy:
· It has been observed from the frequency analysis that, respondents possessed Fair knowledge of basic financial literacy. There were more incorrect answers than correct for only two questions pertaining to advanced financial literacy,
· Median of Respondents’ financial literacy score comes to 6 out of 8. With the help of median score, it has been found that 47 % of the respondents are financially illiterate and 53% of the respondents are financially literate.
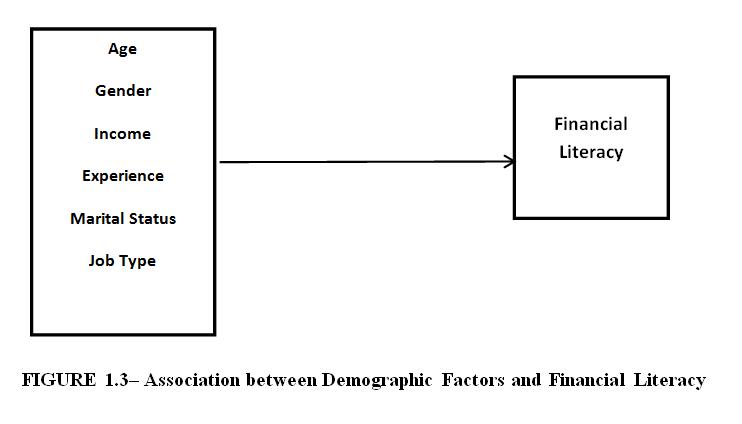
H01: There is no significant association between Age and financial literacy of the respondents.
From the result of Chi Square test, P Value is less than 0.05. So, we reject the null hypothesis. It can be concluded that t here is a significant association between Age and Financial Literacy of the respondents .
H02: There is no significant association between Gender and financial literacy of the respondents.
From the result of Chi Square test, P Value is less than 0.05. So, we reject the null hypothesis. It can be concluded that, there is a significant association between Gender and Financial Literacy of the respondents.
H03: There is no significant association between Education and financial literacy of the respondents.
From the result of Chi Square test, P Value is less than 0.05. Therefore, we reject the null hypothesis. It can be concluded that, there is a significant association between Education and Financial Literacy of the respondents.
H04: There is no significant association between Experience and financial literacy of the respondents.
From the result of Chi Square test, P Value is less than 0.05. We, therefore, reject the null hypothesis and may conclude that, there is a significant association between Experience and Financial Literacy of the respondents.
H05: There is no significant association between Job Type and financial literacy of the respondents.
From the result of Chi Square test, P Value is less than 0.05. Therefore, we reject the null hypothesis and may conclude that, there is a significant association between Job Type and Financial Literacy of the respondents.
H06: There is no significant association between Income and financial literacy of the respondents.
From the result of Chi Square test, P Value is less than 0.05. We, therefore, reject the null hypothesis and may conclude that, there is a significant association between Income and Financial Literacy of the respondents.
H07: There is no significant association between Marital Status and financial literacy of the respondents.
From the result of Chi Square test, P Value is less than 0.05. We, therefore, reject the null hypothesis and conclude that, there is a significant association between Marital Status and Financial Literacy of the respondents.
H08: There is no significant association between Location and financial literacy of the respondents.
From the result of Chi Square test, P Value is more than 0.05. We, therefore fail to reject the null hypothesis and may conclude that, there seems to beno association between Location and Financial Literacy of the respondents. So, whether the respondents belong to Ahmedabad, Baroda , Rajkot or Surat, they don’t differ in Financial Literacy.
It can, therefore, be concluded that Financial Literacy of the respondents gets affected by Age, Gender, Income, Experience, Marital Status, and Job Type of the respondents, it is not dependent on the Location of the respondents.
600 Salaried employees from four major cities of Gujarat had been selected for the purpose of the study. Study revealed that Respondents possess fair financial literacy. This shows that respondents are quite informed and aware about financial terms, concepts and its working. But the study was confined towards to the major cities of Gujarat, results of financial literacy test conducted in semi urban areas and villages may differ with this.