Pacific B usiness R eview I nternational

A Refereed Monthly International Journal of Management Indexed With THOMSON REUTERS(ESCI)
|
Dr. Mohd. Taqi Post Doctoral Fellow Department of Commerce Aligarh Muslim University, Aligarh, India Contact No.:- +91-9639397342 E-mail:-taqiamu@rediffmail.com |
Dr. Mohd. Shamim Ansari Associate Professor Department of Commerce Aligarh Muslim University, Aligarh, India E-mail:-drshamimansari@gmail.com |
Dr. Mohd Ajmal Post Doctoral Fellow (ICSSR) Department of Commerce Aligarh Muslim University, Aligarh, India |
The Indian government implemented a major change in the economic environment by demonetizing the high value currency notes of Rs 500 and Rs 1000 from the midnight 8th of November 2016. This involved withdrawing circulation of said currency and gradually replacing them with a new set of currency notes. The main purpose of demonetisation of the currency is to stop counterfeiting of the banknotes used for terrorist activities and crack down the black money circulation in the country. The present study is an attempt to evaluate the impact of demonetization on Indian capital market with special reference to selected indices of Bombay Stock Exchange (BSE). In order to evaluate the impact of demonetisation on capital market opening and closing value of selected indices of BSE six months period prior to 8th November and after 8th November has been considered. The sample consists of ten indices of BSE viz. SENSEX and other sectors such as capital goods, consumer goods, consumer discretionary goods, FMCG, infrastructure, industrial, utilities and Bankex. There is a strong evidence to suggest that demonetisation have significant impact on selected sectoral indices considered for the study. The study also reveals that indices of manufacturing, FMCG and consumer discretionary goods sensitive increased during the post demonetisation period while sensitivity of industrial goods and infrastructure decreased during the period.
Keywords: Demonetization, share price, BSE, manufacturing firms.
Demonetization is the act of stripping a currency unit of its status as legal tender. Review of literature on the subject reveals introduction of new currency, bring hoarded money into circulation, curbing corruption, curbing fake currency, curbing unfair trading practices etc. Demonetisation is not the first time experience for India. Demonetisation was initiated for the first time in pre-independence era in the 1946 when then British government decided to strip currency notes of Rs. 1000, Rs. 5000 and Rs.10,000 from its status of legal tender.
India went for Demonetisation for the second time in the year 1978 to crack down black money and counterfeited currency on the recommendation of Wanchoo Committee. However, the process failed to achieve its object because the recommendation of the committee was in public domain and it gave the tax evaders and money hoarders time to find solution even prior to demonetisation. On 16th January 1978, Morarji Desai’s government passed the High Demonetisation Bank Notes (Demonetisation) bills to withdraw Rs. 1000, Rs.5000 and Rs.10,000 which was later reintroduced in the year 1954 (Burse, 2018).
India experienced demonetisation for the third time on November 8, 2016 when Government of India suddenly announced that from mid night Rs.500 and Rs.1000 bank notes circulation would be considered as illegal. With this action the government decided to replace 86 per cent of the total currency in circulation with the net set of bank notes. This time the government ensured that such decision is not in public domain beforehand so that hoarders of black money don’t get time to find safe heaven to park tax evaded money. Such announcement created a panic in the economy because in India about 90 per cent of the transaction takes place in cash.
Though the process of demonetisation brought lot of hardship to the citizens in the short run; the government claimed that this would facilitate in curbing black economy and wipe out counterfeit currency largely used for funding terrorism. The process involved pumping out of money supply from the Indian economy thereby leading to severe demand shrinkage in almost every sector. The worst affected sectors were consumer goods, real estate, gold, white goods and automobiles. It has been reported that many people lost jobs as due to loss of market by many companies. The worst affected by this bold step of the government was unorganised sector and the people who rely on daily earning for survival (Angel and Shirley, 2017).
However, experts’ opinions are divided with respect to demonetisation. Government and some of the economist are of the opinion that it is short run phenomena. They are of the opinion that in the long run it will prove to be a blessings for the economy. The fact is that we have experienced short term hardship but what is the real impact of demonetisation on economy in the long run need to be probed separately.
BSE sectoral Indices represent different sectors of the Indian economy. These indices represent performance of the companies and their movements in particular sector. In this backdrop the present aims to evaluate impact of demonetization on various BSE sectoral indices. This study is divided into five parts viz. (I) introductory framework of the demonetisation; (II) statement of problem and review of literature; (III) research methodology; (IV) results & discussions and (V) concluding remarks on the subject.
The announcement of demonetization by government created immediate panic situation for the people. We experienced standing in long queues in banks for changing old notes with new notes, ATMs without cash, and stagnant trade & commerce. Stock market movement is regarded as a pulse of the economy. It is can be an index of the state of the economy. One of the criterions to measure the immediate economic impact of a policy shock is to observe trends in the stock market. Thus, in order to evaluate the immediate impact of demonetisation on Indian capital market the proposed study has considered observing different sectoral indices of Bombay Stock Exchange (BSE). BSE is India’s oldest and world 11th largest stock exchange.
As it has been discussed earlier that demonetisation is not new experience. Different countries have resorted to Demonetisation to cure economic evil. Among them some were successful in achieve their objectives such as Pakistan (2016), Zimbabwe (2015), European Union (2002), Australia (1996) and United Kingdom (1971). Among them European Union is perfect example which indicated the kind of preparation required in case of currency changeover. However, some countries created a mess of demonetisation viz. North Korea (2010), Soviet Union (1991), Myanmar (1987), Nigeria (1984) and Ghana (1982). However, one thing common among was all the countries that decided to go for demonetisation was that all the economies were facing major economic problems like hyper-inflation. It is for the first time that a nearly perfect healthy economy has attempted it to target black money. As it is the first, demonetisation of its kind there are varied opinions amongst economists on its impact in future and whether it will impact the stock market rigorously or not. Stock market plays a vital role in economic growth of a country. There are many systematic and non-systematic factors which have impact on the stock market. These factors may be positively or negatively correlated with the economy. Factors that have negative influence on capital market must be addressed on priority.
The stock prices of listed companies in BSE and NSE are affected by various macroeconomic factors. Tripathi et. al. (2014) examined the relationship among the macroeconomic factors and selected sectoral indices. The factors considered by them were exchange rate, FII, current account balance, foreign exchange reserves and crude oil price. Relationships of these factors were examined with the selected sectoral indices at National Stock Exchange (NSE) viz. CNX Auto, CNX Bank, CNX IT, CNX Energy and CNX FMCG. Monthly observations for the period April 2005 to March 2013 were taken and analyzed by using multiple regressions. Results revealed that FII affects all sectoral indices while other variables selectively affect different sectoral indices in India. S. Lakshmy (2014) measured the impact of FII on the sectoral market indices of BSE. The researcher applied coefficient of correlation and granger causality test and found that FII has a significant impact on some sectoral indices. Laxmi (2013) examined the volatility patterns in various sectoral indices of NSE by applying ARCH model. Results revealed the reality sector as a highly volatile sector among others in relation to benchmark S&P CNX Nifty index. In a study by Samveg Patel (2012), effect of macroeconomic factors on the performance of stock exchange i.e. SENSEX and S&P CNX nifty was analysed. The results revealed a significant relationship among the stock indices and macroeconomic factors. Saeed (2012) measured the impact of macroeconomic factors on the stock returns in Karachi and found significant impact. Though, it was also found that not every factor has significant impact on the returns of every sector. Short term interest rates were found to have impact on various sectors’ returns but exchange rate and oil prices were found to have impact on specific sectors’ returns. Other than this, it was also found that the macroeconomic factors contribute less in volatility of sectors’ returns. Mohamed et. al. (2011) also observed significant relationship of such factors on Malaysian economy. Some factors were positively related while others were negatively related to stock indices. A number of studies have talked about the macroeconomic effect on sectoral indices. Demonetization is an important event that has affected various sectors of the economy at large. This paper is an attempt to explore the knowledge with respect to effect of demonetization on various sectors of the economy.
Sunil et al (2017), in their study tried to understand how much the demonetization has affected the stock prices and to analyse the stock price movement pre and post demonetization. The study measured the impact of demonetization on stock prices of five selected sectors, automobiles, banking, consumer durables, telecommunication and real estate. Five companies in each sector were considered for the study and the closing prices of stocks were used to find the returns. Realised return, CAPM return and BHAR analysis has been carried out in the study. Bantwa (2017) covered significant impact of demonetization on Indian stock market on sectors such as automobile, banking, FMCG, IT, media, metal, pharmaceutical, real estate, infrastructure and service sector.
A large number of studies have been conducted on the subject at national as well as international level. Few researchers have tried to evaluate impact of demonetisations on capital market. However, it has been observed that no study has been conducted covering different sectoral indices. Different sectoral indices can be an important indicator of demonetisation on performance of different industry in the short run. Therefore the present study aims measure impact of demonetisation on Bombay Stock Exchange (BSE) SENSEX and other sectoral indices.
. To study the performance of selected indices during the pre and post demonetisation process in India.
· To analyze the impact of Demonetization on volatility of BSE indices.
. To measure the pre and post demonetisation return on selected BSE indices.
HYPOTHESES OF THE STUDY
H01: There is no significant difference in performance of selected indices during pre and post
Demonetization.
H02: There is no significant difference on volatility of indices during pre and post demonetisation.
H03: There is no significant impact of money supply on selected indices of BSE during the pre
and post demonetisation period.
This study is an empirical analysis of demonetisation and its impact on BSE and its selected indices. It covers BSE-SENSEX and 10 other sectoral indices which have been mentioned in the following paragraph.
Sample of the Study: Ten sectoral indices of Bombay Stock Exchange (BSE) i.e. SENSEX, capital goods, consumer discretionary goods, consumer durables, fast moving consumer goods, infrastructure, industrials, manufacturing, utilities and BANKEX. These indices exhibit the performance of relevant sectors considered as sample for the study.
Nature and Sources of Data: The secondary data is being used for the present research which has been extracted from the secondary sources. The website of Bombay Stock Exchange is the primary source of data and all sample indices data has been taken from there. Money supply data has taken from the website of Reserve Bank of India on fortnight basis.
Data used for the Study: Daily closing prices of above mentioned selected indices have been considered for the study and to calculate returns of sectoral indices of BSE. As the researcher has taken it as an event study thus daily closing values for twelve months have been taken for the study.
Tenure of the Study: Data period is divided into two segments i.e. pre demonetization period from 8th May to 7th November, 2016 and post demonetization period from 9th November, 2016 to 8th May, 2017.
Tools used for the Analysis: Descriptive statistics has been conducted in the study. Analytical tools comprise paired t-test and correlation. Beta coefficients have been calculated for measuring the volatility of the indices in pre and post demonetization periods and compared.
β = cov. XY / var. X
β = beta value, X= Nifty 50 Returns, Y= Sectoral Indices Returns, cov = Covariance, var = Variance. For calculating beta values, returns of SENSEX and sectoral indices were calculated by using following formula:
R = Pt − Pt−1 /Pt−1 × 100
Here: R = Security Return, P = Close Price of Security, t = Current Date, t-1 = Previous Date
H01: There is no significant difference in performance of selected indices during pre and post demonetization.
Table – 1 Descriptive Statistics of Selected Indices of BSE
|
|
|
Mean |
N |
Std. Deviation |
Std. Error Mean |
|
SENSEX |
Pre |
27554.16 |
122 |
863.521 |
78.179 |
|
Post |
27995.69 |
122 |
1388.700 |
125.727 |
|
|
Cap. Goods |
Pre |
14824.69 |
122 |
562.998 |
50.971 |
|
Post |
15204.41 |
122 |
1371.202 |
124.143 |
|
|
Cap. Dis. Goods |
Pre |
3043.93 |
122 |
192.573 |
17.435 |
|
Post |
3162.22 |
122 |
237.678 |
21.518 |
|
|
Consumer Durables |
Pre |
12227.94 |
122 |
461.539 |
41.786 |
|
Post |
13043.24 |
122 |
1722.164 |
155.917 |
|
|
FMCG |
Pre |
8488.63 |
122 |
279.274 |
25.284 |
|
Post |
8634.62 |
122 |
549.216 |
49.724 |
|
|
Infrastructure |
Pre |
175.13 |
122 |
13.639 |
1.235 |
|
Post |
201.07 |
122 |
12.644 |
1.145 |
|
|
Industrial Products |
Pre |
2984.50 |
122 |
150.554 |
13.631 |
|
Post |
3072.57 |
122 |
207.912 |
18.823 |
|
|
Manufacturing |
Pre |
370.51 |
122 |
16.573 |
1.500 |
|
Post |
372.68 |
122 |
20.002 |
1.811 |
|
|
Utilities |
Pre |
1691.74 |
122 |
69.605 |
6.302 |
|
Post |
1875.13 |
122 |
106.263 |
9.621 |
|
|
Bankex |
Pre |
21431.10 |
122 |
1169.463 |
105.878 |
|
Post |
22767.25 |
122 |
1583.544 |
143.367 |
Source: Daily closing price data from the website of Bombay Stock Exchange
The above Table 1 presents the descriptive statistics of different indices of BSE during the pre and post demonetisation process.
Table – 2 Paired Samples Test of Selected Indices of BSE
|
|
Paired Differences |
T |
df |
Sig. (2-tailed) |
||||
|
Mean |
Std. Deviation |
Std. Error Mean |
95% Confidence Interval of the Difference |
|||||
|
Lower |
Upper |
|||||||
|
SENSEX |
-441.525 |
975.149 |
88.286 |
-616.310 |
-266.740 |
-5.001 |
121 |
.000 |
|
Cap. Goods |
-379.721 |
1395.698 |
126.361 |
-629.885 |
-129.557 |
-3.005 |
121 |
.003 |
|
Cons. Discretionary Goods |
-118.295 |
96.957 |
8.778 |
-135.674 |
-100.917 |
-13.476 |
121 |
.000 |
|
Cons. Goods |
-815.295 |
1316.870 |
119.224 |
-1051.330 |
-579.260 |
-6.838 |
121 |
.000 |
|
FMCG |
-145.992 |
453.386 |
41.048 |
-227.256 |
-64.727 |
-3.557 |
121 |
.001 |
|
Infrastructure |
-25.934 |
4.594 |
.416 |
-26.758 |
-25.111 |
-62.357 |
121 |
.000 |
|
Industrial Goods |
-88.074 |
135.445 |
12.263 |
-112.351 |
-63.797 |
-7.182 |
121 |
.000 |
|
Manufacturing |
-2.172 |
12.378 |
1.121 |
-4.391 |
.047 |
-1.938 |
121 |
.055 |
|
Utilities |
-183.393 |
60.880 |
5.512 |
-194.306 |
-172.481 |
-33.273 |
121 |
.000 |
|
Bankex |
-1.336E3 |
1115.846 |
101.024 |
-1536.159 |
-1136.152 |
-13.226 |
121 |
.000 |
Source: Daily closing price data from the website of Bombay Stock Exchange
Table 2 shows the values of t-statistics of different sectors during the demonetisation process. In order to check the difference in pre and post demonetisation process paired sample t-test has been applied on daily stock return value on selected samples. There is a strong evidence to suggest that demonetisation have significant impact on the above mentioned sectors except manufacturing (p=0.055) as their p value is <0.05.
H02: There is no significant difference on volatility of indices during pre and post demonetisation.
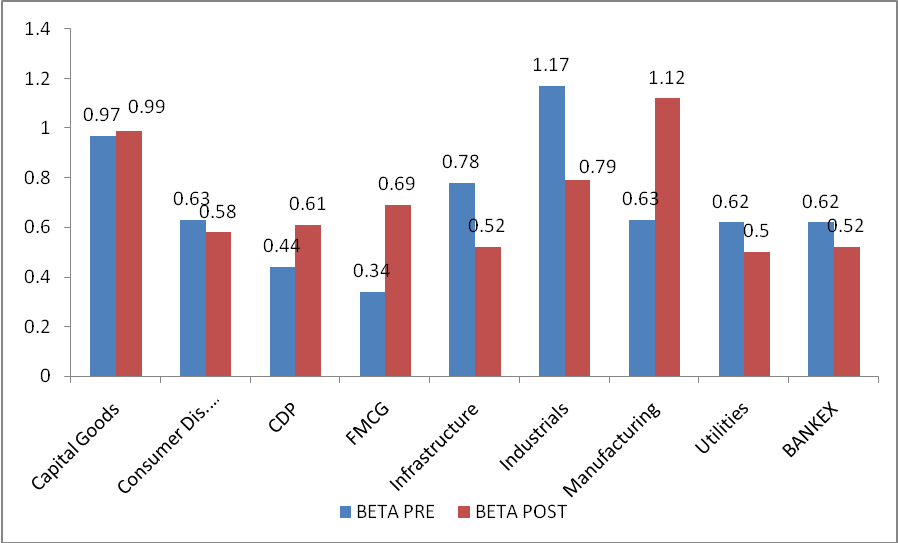
Table – 3 BETA Values of Pre and Post Demonetisation Process of Selected Indices
|
Indices |
BETA PRE |
BETA POST |
|
Capital Goods |
0.97 |
0.99 |
|
Consumer Dis. Goods |
0.63 |
0.58 |
|
CDP |
0.44 |
0.61 |
|
FMCG |
0.34 |
0.69 |
|
Infrastructure |
0.78 |
0.52 |
|
Industrials |
1.17 |
0.79 |
|
Manufacturing |
0.63 |
1.12 |
|
Utilities |
0.62 |
0.50 |
|
BANKEX |
0.62 |
0.52 |
Source: Daily closing price data from the website of Bombay Stock Exchange
Source: Daily Closing Price of Stock in Bombay Stock Exchange
Beta Factor (β) is used to check the sensitivity (Price Volatility) of stock/market thereby also an indicator of risk. β>1 represent higher degree of sensitivity in relation to market whereas β<1 represent that stock less sensitivity of market. It has been observed that stock of manufacturing sector (β value increase from 0.63 to 1.12) followed by FMCG (β value increase from 0.34 to 0.69) and Consumer Discretionary Goods (β value increase from 0.44 to 0.61) were sensitive in the post demonetisation period. However, it has also been observed that an industrial sectoral index was less sensitive in the post demonetisation period (β value decrease from 1.17 to 0.79) followed by infrastructure (β value decrease from 0.78 to 0.52) (Table 3).
Table – 4: Descriptive Statistics: β value during demonetisation
|
|
|
Mean |
N |
Std. Deviation |
Std. Error Mean |
|
Pair 1 |
PRE BETA |
.6889 |
9 |
.25522 |
.08507 |
|
POST BETA |
.7026 |
9 |
.22188 |
.07396 |
Source: Daily closing price data from the website of Bombay Stock Exchange
The above table shows the statistical description of beta value of selected indices during pre and post demonetisation process. The beta value during pre demonetisation period was 0.68 which remains same after the demonetisation process as it was slightly increased i.e. 0.70.
Table - 5 Paired Samples Test
|
Paired Differences |
T |
df |
Sig. (2-tailed) |
||||||
|
Mean |
Std. Deviation |
Std. Error Mean |
|
||||||
|
|
|
||||||||
|
Pair 1 |
PRE BETA – POST BETA |
-.01367 |
.27985 |
.09328 |
|
|
-.147 |
8 |
.887 |
Source: Daily closing price data from the website of Bombay Stock Exchange
Table 5 depicts the t-statistics of beta values of selected indices for the study where researcher intends to know the sensitivity of stock price during the pre and post demonetisation process. The mean value of beta during the study period was very low as it was only 0.14 which reveals very low sensitivity in the stock market volatility while standard deviation of beta value was 0.28 respectively. The p value of beta is 0.887 which points towards to the acceptance of null hypotheses.
H03: There is no significant impact of money supply on selected indices of BSE during the pre and post demonetisation period.
Table 6: Paired Samples Correlations between Demonetisation Variable and Indices
|
N |
Correlation (r) |
Sig. |
||
|
M3& SENSEX |
25 |
.722 |
.000 |
|
|
M3 & Capital Goods |
25 |
.669 |
.000 |
|
|
M3 & Consumer Discretionary Goods |
25 |
.848 |
.000 |
|
|
M3 & Consumer Durable Goods |
25 |
.761 |
.000 |
|
|
M3 & FMCG |
25 |
.648 |
.000 |
|
|
M3 & INFRA |
25 |
.849 |
.000 |
|
|
M3 & INDUSTIES |
25 |
.770 |
.000 |
|
|
M3 & MANUFACTURING |
25 |
.719 |
.000 |
|
|
M3 & UTILITIES |
25 |
.760 |
.000 |
|
|
M3 & BANKEX |
25 |
.840 |
.000 |
|
Source: Data from the website of Bombay Stock Exchange and Reserve Bank of India on fortnight basis
Table 6 depicts the status of correlation between selected BSE indices and Money Supply. There is strong uphill (positive) linear relationship between Money Supply return and indices of almost all the indices selected for the study (r > +0.70). However, there is a moderate uphill positive correlation for Capital Goods and FMCG (r >+0.50 and < 0.69).
Table – 7 Paired Samples Test of Demonetisation and Money Supply (M3) Data
|
Paired Differences |
T |
df |
Sig. (2-tailed) |
||||||
|
Mean |
Std. Deviation |
Std. Error Mean |
95% Confidence Interval of the Difference |
||||||
|
Lower |
Upper |
||||||||
|
M3 – SENSEX |
94466.77 |
1801.22655 |
360.24531 |
93723.26182 |
95210.28138 |
262.229 |
24 |
.000 |
|
|
M3 - CAP_GDS |
107205.10 |
1910.74237 |
382.14847 |
106416.38871 |
107993.82009 |
280.533 |
24 |
.000 |
|
|
M3 – CDG |
119151.96 |
2277.77280 |
455.55456 |
118211.74960 |
120092.18640 |
261.554 |
24 |
.000 |
|
|
M3 - C_DURG |
109539.68 |
1681.48459 |
336.29692 |
108845.60368 |
110233.76912 |
325.723 |
24 |
.000 |
|
|
M3 – FMCG |
113695.98 |
2204.41023 |
440.88205 |
112786.04898 |
114605.92062 |
257.883 |
24 |
.000 |
|
|
M3 – INFRA |
122073.92 |
2461.14348 |
492.22870 |
121058.01390 |
123089.83410 |
248.002 |
24 |
.000 |
|
|
M3 – INDUSTR |
119230.72 |
2326.62136 |
465.32427 |
118270.34151 |
120191.10569 |
256.231 |
24 |
.000 |
|
|
M3 - MANUFAC |
121890.29 |
2464.19133 |
492.83827 |
120873.13101 |
122907.46739 |
247.323 |
24 |
.000 |
|
|
M3 - UTILITIES |
120477.40 |
2375.30563 |
475.06113 |
119496.93002 |
121457.88598 |
253.604 |
24 |
.000 |
|
|
M3 - BANKEX |
100136.04 |
1401.96766 |
280.39353 |
99557.34179 |
100714.74941 |
357.127 |
24 |
.000 |
|
Source: Data from the website of Bombay Stock Exchange and Reserve Bank of India on fortnight basis
Table 7 depicts the result of pair sample t test for money supply and its impact on demonetisation during the period of study. Pair sample t-test conducted to test the third hypothesis reveals that there is significant impact of demonetisation on selected indices for the study as p<0.05null hypotheses rejected.
The present study has been conducted in order to analyze the impact of demonetization on Indian capital market with special reference to performance and volatility of the Bombay Stock Exchange sectoral indices. It is observed that mean return during the post demonetization period improved for all the indices selected for the study. Paired sample t-statistics indicates that demonetization has significant impact on different sectoral indices considered for study except manufacturing.
The study reveals that demonetization has significant impact on selected indices for the study except manufacturing where p value is less than 0.05. Another parameter considered to evaluate the impact of demand was volatility for which beta value was used. Beta value reveals that stock of manufacturing sector; FMCG and consumer discretionary goods were highly sensitive in the post demonetization period. However, indices were less sensitive in the post demonetization period followed by infrastructure.
Third parameter considered for the study was evaluating the impact of demonetization on selected BSE indices where money supply (M3) was considered as dummy variable for demonetization. Statistical analysis indicate that there is significant impact of demonetization on almost all sectoral indices selected for the study as the correlation between M3 and sectoral indices return is positive. There is strong positive uphill correlation.
Abraham, A., Seyyed, F. J., & Alsakran, S. A. (2002). Testing the random walk behavior and efficiency of the Gulf stock markets. Financial Review , 37 (3), 469-480.
Aga, M. & Kocaman, B. (2008). Efficient market hypothesis and emerging capital markets: empirical evidence from Istanbul stock exchange. International Research Journal of Finance and Economics , 13 (10), 131-144.
Angel, M. and Shirley, J. (2017). Impact of Demonetization in India. International Journal of Trend in Research and Development. Special Issue .
Bantwa, A. (2017). A Study on Impact of Demonetization on Indian Stock Market and Selected Sectors of Indian Economy. Pacific Business Review International, 10(3), 94-101.
Borges, M. R. (2010). Efficient market hypothesis in European stock markets. The European Journal of Finance , 16 (7), 711-726.
Burse, S. (2018). The impact of Demonetization on India and Indians. International Journal of Scientific and Research Publications, 8 (1), 150-156.
Degutis, A. & Novickyte, L. (2014). The efficient market hypothesis: A critical review of literature and methodology. Ekonomika , 93 (2), 7.
Gupta, R.K. (2014). Weak form efficiency of India stock market with reference to BSE. International Journal of Research in Business Management (IMPACT: IJRBM) (P) , 23474572.
Hadi, M.M. (2006). Review of capital market efficiency: Some evidence from Jordanian market. International Research Journal of Finance and Economics , 3 , 13-27
Harper, A. & Jin, Z. (2012). Examining market efficiency in India: An empirical analysis of the random walk hypothesis. Journal of Finance and Accountancy , 10 , 1.
Jensen, M.C. (1978). Some anomalous evidence regarding market efficiency. Journal of financial economics , 6 (2-3), 95-101.
Kumar, S. & Kumar, L. (2014). Market Efficiency in India: A Study of Random Walk Hypothesis of Indian Stock Market (BSE). Global Journal of Enterprise Information System , 6 (4), 16-20.
Lo, A.W. & MacKinlay, A.C. (1988). Stock market prices do not follow random walks :Evidence from a simple specification test. Review of financial studies , 1 (1), 41-66.
Mathivannan, S., & Selvakumar, M. (2015). Test of Random Walk Theory in the National Stock Exchange. Asian Journal of Managerial Science , 4 (2), 21-25.
Mohamed Suhana, Ali Alizah and Abdullah Nuriza (2011), ‘Malaysian Sectoral Indices VS Macroeconomic Factors, Any Correlation?, International Conference on Economics and Finance Research, Vol. 4
P Lakshmi Swarna (2013), ‘Volatility Patterns in Various Sectoral Indices in Indian Stock Market’, Global Journal of Management and Business Studies, Vol. 3 No. 8
Patel Samveg (2012), ‘The effect of Macroeconomic Determinants on the Performance of the Indian Stock Market’, Management Review Volume XXII.
SaeedSadia (2012), ‘Macroeconomic Factors and Sectoral Indices: A Study of Karachi Stock Exchange (Pakistan)’, European Journal of Business and Management, Vol. 4 No. 17
Stiglitz, J. E. (1981). Pareto optimality and competition. The Journal of Finance , 36 (2), 235-251.
Sunil, T. & Shenoy, S.V. (2017). Impact of Demonetization on Stocks of Selected Sectors – An Event Study. International Journal of Research in Finance and Marketing, 7(5), 29-38.
Timmermann, A., & Granger, C. W. (2004). Efficient market hypothesis and forecasting. International Journal of forecasting , 20 (1), 15-27.
Tripathi, Parashar and Jaiswal (2014), “Impact of Macroeconomic Variables on Sectoral Indices in India”, Pacific Business Review International Volume 6, Issue 12.