|
Yensen Ni Department of Management Sciences Tamkang University New Taipei, Taiwan |
Min-Yuh Day Department of Information Management Tamkang University 25137 New Taipei, Taiwan |
Paoyu Huang* Department of International Business Soochow University Taipei, Taiwan |
Apart from the moving average (MA) trading rule that is widely applied by market participants, technical analysis indicators, such as relative strength indicator (RSI) and stochastic oscillator indicator (SOI), are used in trading stocks. In this study, we investigate whether data frequency yields different results for trading signals triggered by RSI, SOI, and MA. We reveal that the use of weekly data rather than daily data improves performance regardless of the utilized RSI, SOI, and MA technical trading rules. This result indicates that data frequency is important for technical analysis. The use of long positions is preferred when overshooting signals triggered by RSI and SOI and trading signals, including golden and death crosses based on MA.
Keywords:Data Frequency, Overreaction, Investment Strategies, Technical Analysis, Trading Signals.
In accordance with the efficient market hypothesis, share prices are difficult to predict. This premise seems challenged by the overreaction hypothesis, which indicates that market participants may overreact to information, especially private information, due to excessive self-confidence and herding behavior, which cause them to chase share prices and investors’ sentiments. Volatility ultimately increases in such cases. SOI and RSI are used by practitioners in trading stocks because they provide information that is related to stock price overreaction, herding behavior, and investors’ sentiments. Whether data frequency, such as daily and weekly data, is important in trading signals triggered by RSI and SOI remains unclear. This study investigates whether market participants outperform the market when trading signals are triggered by RSI and SOI and whether trading signals measured by daily and weekly data yield different results. To evaluate the relevant literature, we survey the studies related to data frequency, market inefficiency and efficiency, herding behavior, overreaction, investor sentiment, momentum, contrarian strategy, and technical analysis (Section 2). We investigate whether investors outperform the market by trading stocks as overreaction trading signals emitted by RSI and SOI regardless of whether daily or weekly data are used. We use DJ30, SSE50, and FTSE100 constituent stocks as our samples because they are regarded as representative indices worldwide. We also use an event study approach to determine whether one-, two-, three-, four-, and five-day (five-week) cumulative abnormal returns are significantly different from zero. We compare the performance of using RSI and SOI trading rules with that of applying the MA trading rule, which is widely utilized by many practitioners. We reveal the following essential findings. First, the application of trading rules by using weekly data yields considerably higher profits than the utilization of daily data does. This result indicates that data frequency is important in trading stocks, as shown by the trading signals triggered by RSI and SOI. Second, investors may use long positions on these constituent stocks, as shown by either oversold or overbought signals triggered by RSI and SOI. Similar findings are revealed by using trading rules emitted by MA, that is, investors are suggested to buy constituent stocks as MA crossovers, including golden and death crossovers due to MA. These findings may be significant for investors. Third, trading performance when trading signals are triggered by RSI and SOI is better than that when trading signals are triggered by MA. This finding may be explained by the fact that MA is more popular among investors than RSI and SOI trading rules are because of the concern about market efficiency. This study provides several contributions to the relevant literature as follows. First, determining whether market participants can outperform the market, as shown in the overshooting signals emitted by RSI and SOI, by using either daily data or weekly data is seldom investigated comprehensively. Second, we propose appropriate strategies as trading signals emitted by diverse technical trading rules, including SOI, RSI, and MA, which may be valuable for market participants in trading stocks. Third, we use the constituent stocks of DJ30, SSE50, and FTSE100, which are three worldwide representative indices, because investors can buy or sell these stocks instead of index spots. Fourth, data frequency is important in trading these constituent stocks due to the excellent performance provided by weekly data relative to daily data, especially when considering transaction costs. The remaining part of this paper is presented as follows. Section 2 reviews the relevant literature. Section 3 introduces the study design and data. Section 4 presents the empirical results. Section 5 provides the concluding remarks and recommendations.
Baumeister and Kilian (2015) indicate that the advantage of forecasting monthly oil prices will be based on a daily or weekly basis. Duan and Whinston (2008) suggest that daily data will obtain rapid information transmission compared with the weekly data. Investors will probably obtain more information from daily data than that from weekly data. However, investors are often concerned with long-term investments. Thus, investors giving considerable attention to information released daily may not guarantee a high return. Therefore, the appropriate time interval for the data is related to the data structure. Narayan and Sharma (2015) use several frequencies of data in terms of exchange rates and revealed that data frequencies are important economically. Nevertheless, whether the use of weekly or daily data leads to high profitability is seldom studied.
Fama (1998) argue that anomalies may be caused by different methodologies used, but most of the long-term anomalies may not occur by using adequate methodologies. Chordia and Subrahmanyam (2008) indicate that liquidity stimulates arbitrage activity, thereby enhancing market efficiency. Wang et al. (2010) find that price-limited reform improves the efficiency in the long term. Rizvi et al. (2014) show that market development on the stock market is more efficient than before even in stock market crisis periods. Nonetheless, Lehmann (1990) demonstrates that the variation in stock returns may respond to changes in expected returns. Butler and Malaikah (1992) suggest that market inefficiency is probably affected with institutional factors. Hamid et al. (2017) reveal that investors can benefit from the arbitrage process among profitable opportunities across many countries in the Asia-Pacific region because monthly prices follow no random patterns in these countries. Recently, Urquhart (2016) reveals that Bitcoin markets may not be regarded as inefficient markets, but they may develop into efficient markets.
Investor sentiment plays an important role in financial decision-making behavior. Hott (2009) explains price bubbles through herding behavior. Chang and Lin (2015) indicate that herding behavior occurs in less sophisticated equity markets, and several indices are closely correlated with herding occurrence. Blasco and Ferreruela (2012) confirm that herding directly influences volatility, which shows that herding is useful in volatility forecasting. Philippas et al. (2013) show that weakened investors’ sentiment is significantly related to the occurrence of herding behavior. Ni, Liao, and Huang (2015) demonstrate that investors may be beneficial for purchasing SSE’s constituent stocks as death crosses occur due to stock price overreaction. Mahani and Poteshman (2008) discover that inexperienced market participants may overreact to released news; consequently, mispriced stocks will be distant from fundamentals. Economou, Hassapis, and Philippas (2018) demonstrate the significant impact of investors’ fear on herding behavior in developed stock markets. With regard to investor investment behavior, Lee, Jiang, and Indro (2002) indicate that the investor sentiments may be changed by bullish markets, which may result in downward revisions in volatility and high future excess returns, and vice versa for bearish markets. Chan and Fong (2004) find that publication in terms of investors’ sentiments may temporarily affect stock prices regardless of the competence of these publications in forecasting stock prices. Kling and Gao (2008) demonstrate that investor sentiments and stock returns present no long-term relation. Chen, Chong, and Duan (2010) discover that stock market turnover is positively related to market sentiment, which indicates that stock markets may not be completely rational. Schmeling (2009) reveals that investor sentiment will be high for regions without substantial market integrity. More recently, literature has emerged aboutsentiment analysis and finance big data analytics for investment decision support. Kraus and Feuerriegel (2017) propose a deep learning approach for financial decision support with sentiment analysis of financial news. Feuerriegel and Prendinger (2016) suggest that financial disclosures are essential for the decision-making in finance and propose news-based trading strategies for decision-making with supervised and reinforcement learning. Shynkevich et al. (2016) use financial news from different categories with machine learning approach for predicting health-care stock prices. Brasileiro et al. (2017) demonstrate an automatic trading method by discovering patterns in financial market data for investment decision support.
Investment strategies that are widely used are momentum and contrarian strategies. Thus, we survey the relevant literature regarding these two strategies. With regard to contrarian strategies, Conrad and Kaul (1997) demonstrate that substantial contrarian profits are mainly generated by bid–ask spread. Chou and Chung (2007) note that contrarian profits are revealed in Japan stock markets from one-month to two-year horizon. Antoniou and Spyrou (2005) indicate that the serial correlation shown in stock returns may cause significant short-term profits by adopting contrarian strategies. With regard to momentum strategies, Chui and Wei (2010) illustrate that momentum profits will be positively influenced with transaction costs, the familiarity of market to foreigners, and analyst forecasting dispersion and negatively influenced with volatility and firm scale. Hoitash and Krishnan (2008) find that momentum strategies may be proper when trading the stocks of highly speculative firms. Naughton and Veeraraghavan (2008) show a strong momentum effect around earning announcements. Asness (2011) indicates that momentum strategies may be successful in Japanese stock markets
Menkhoff and Taylor (2007) discover that stock markets may not be completely rational because technical analysis may utilize the valuable information related to official interventions. With regard to technical analysis, the MA trading rules frequently adopted by practitioners are also investigated widely by academicians. Shintani et al. (2012) reveal that the MA crosses caused by MA can forecast share prices. Hong and Satchell (2015) argue that the MA trading rule is an easy way of using price autocorrelation to utilize momentum profits. Nevertheless, Chiang et al. (2012) also state that the use of overreaction signals triggered by the SOI may predict the movement of shock prices. Wang et al. (2012) find that investment institutions often use the overreaction signals emitted by SOI in trading stocks. Shik and Chong (2007) reveal that using the RSI trading rule will utilize profits in currency trading. Chong and Ng (2008) examine the RSI to determine whether investing stocks in accordance with the RSI trading rules is profitable. Furthermore, according to the overreaction hypothesis (DeBondt & Thaler, 1985, 1987), the trading rule of either RSI or SOI may be related to the overreaction hypothesis because investors are suggested to trade stocks as overreaction signals triggered by the RSI and SOI. In addition, MA technical trading rules are widely used compared with RSI and SOI trading rules. Hence, with consideration of data frequency, such as daily and weekly data, the present study mainly focuses on whether market participants will overcome the market by using the technical trading rule due to the RSI and SOI instead of MA.
The overreaction signals emitted by the technical indicators may contain valuable information. Consequently, many market participants may consider these indicators, including RSI and SOI, in trading stocks. Given that overreaction trading signals can be transmitted by these technical indicators, we explored whether investors will profit by using these technical indicators and compared the profitability of using them in trading the constituent stocks in terms of DJ30, SSE50, and FTSE100. In general, the overbought and oversold zones are set when the RSI values are > 70 and <30, respectively, in accordance with the RSI trading rules. The overbought and oversold zones are set at K values of> 80 and <20, respectively, in accordance with the SOI trading rule. These trading rules are also introduced in detail in the websites . In the present study, we first set overbought (oversold) signals triggered by RSI and SOI as our investigated events . Second, we measure the one-, two-, three-, four-, and five-day (five-week) CARs when these events occurred. Third, the standard event study approach is used to observe share price movements after these events occurred. Fourth, we further explore whether these trading signals measured by daily and weekly data will yield different results. In accordance with the event study approach, we define day (week) 0 as our investigated events that occurred and used the daily (weakly) stock index returns, including DJ30, SSE50, and FTSE100 indices, as substitutes for market returns. With the use of data from day −155 to −6 day (week) before the day (week) of our investigated events, we obtain the expected returns by utilizing the market model. We also measure abnormal returns (ARs) as the difference between actual and expected returns measured by the market model. Moreover, ARs from AR(1) to AR(t) are cumulated to measure the CARs, that is, CAR(t). Subsequently, we calculated one-, two-, three-, four-, and five-day (week) CARs as short-term windows recommended by relevant literature (Chopra, Lakonishok, & Ritter, 1992; Marshall, Young, & Rose, 2006; Ahern, 2009). We further examine whether these CARs are different from 0 with statistical significance. In the present study, we show our revealed results as overreaction signals triggered by RSI and SOI for these constituent stocks in columns (1)–(3) of Tables 3 and 4 for daily and weekly data, respectively.
This study uses the daily and weekly data for these constituent stocks from the Datastream over the data period of 2007–2016 (10-year data) as our samples. Figure 1 indicates an upward trend in the DJ30 index after the 2008 stock market crisis and a relatively stable trend in the FTSE100 index. Two peaks are shown in 2007 and 2015 for the SSE50 index.
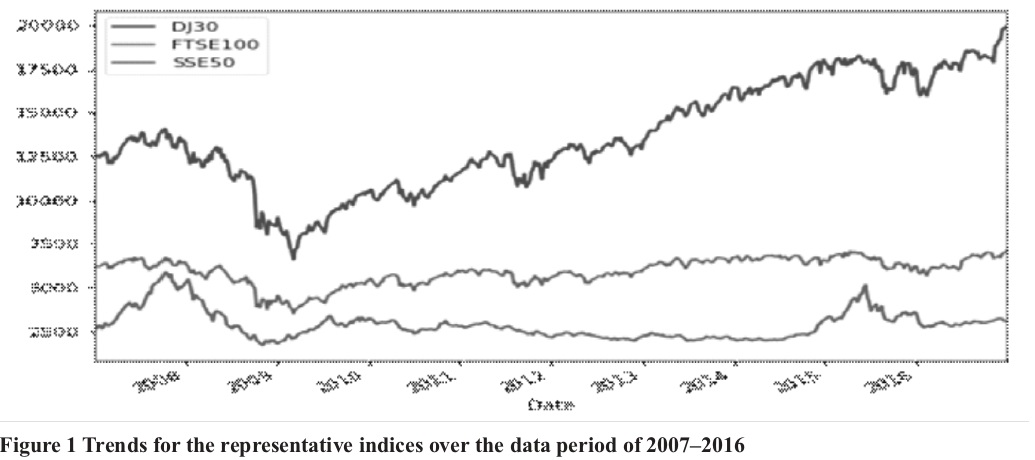
Table 1 shows the descriptive statistics, including means, medians, standard deviations, minima, and maxima, for these three indices from 2007 to 2016.
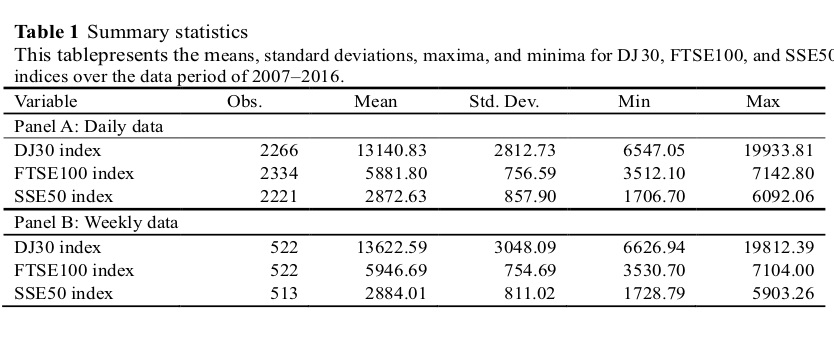
Table 1 also presents the ranges of these stock indices. The minimum and maximum values for the three indices indicate a wide range, especially for the SSE index. The minimum value may result from the 2008 stock market crisis. These statistical values show that the SSE index is more volatile than those of DJ30 and FTSE100 indices. We also explore whether investors will overcome the markets by trading these constituent stocks as overbought (oversold) signals emitted by RSI and SOI. Table 2 provides a list of the samples of overbought (oversold) trading signals that occurred for these constituent stocks.
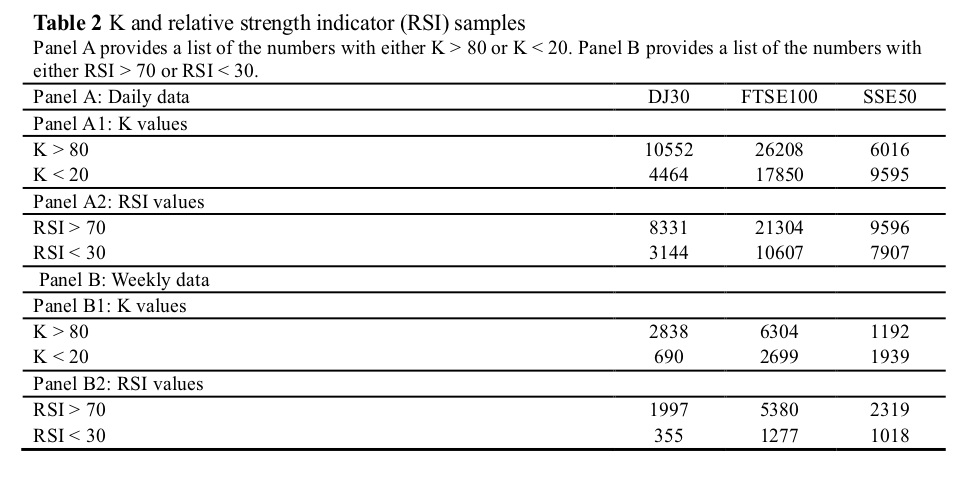
The overbought trading signals are higher than those of oversold trading signals for either daily data shown in Panel A or weekly data shown in Panel B, which may result from upward trends for these indices during the data period. With regard to the trading signals triggered by RSI and SOI, the samples of overbought (oversold) trading signals triggered by the K value are higher than those triggered by RSI, which may result from the different measures of overbought (oversold) trading signals for RSI and SOI.
We measure the one-, two-, three-, four-, and five-day (five-week) CARs as overbought (oversold) signals emitted by RSI and SOI. Results show the CARs and their t-values for trading these constituent stocks as either the overbought trading signals emitted by RSI and SOI in Panels A1–B1 of Table 3 (daily data) and Table 4 (weekly data) or the oversold signals triggered by RSI and SOI in Panels A2–B2 of Tables 3 and 4, respectively.
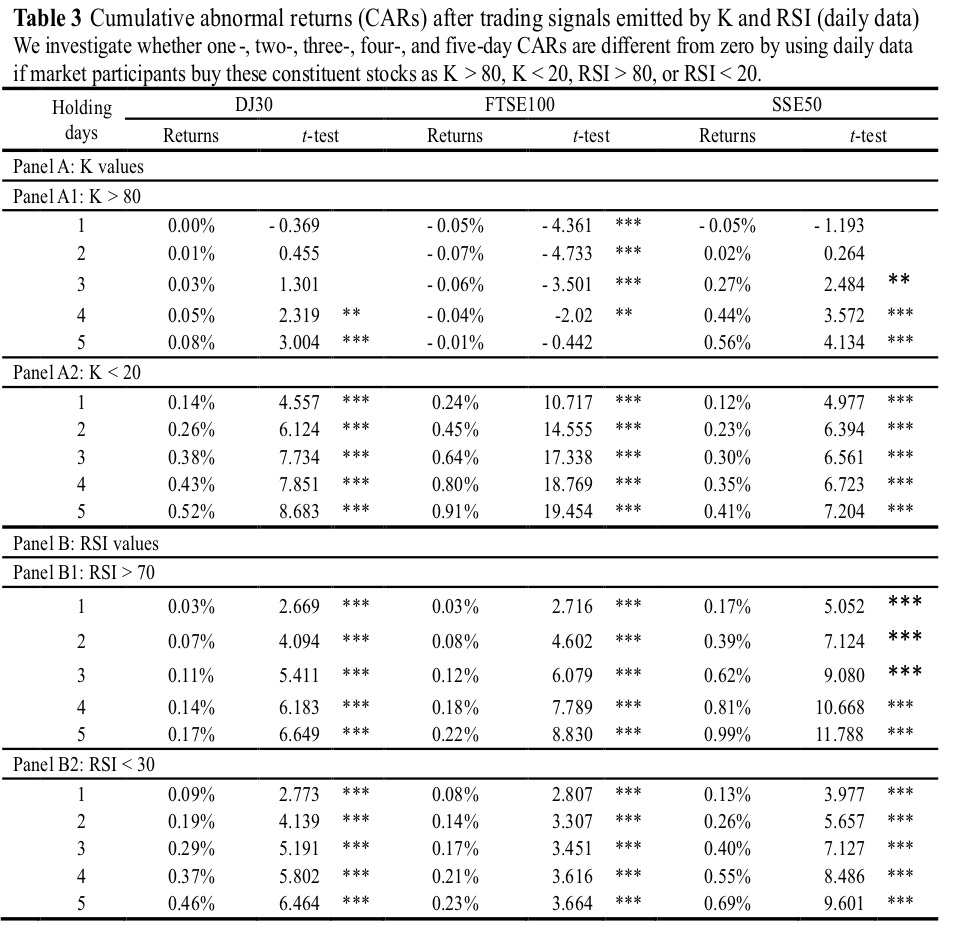
Table 3 shows that CARs(5) are almost positive for investors buying these constituent stocks as overreaction signals, including overbought and oversold signals triggered by either RSI or SOI. Moreover, the performance of trading the constituent stocks of FTSE100 when K < 20 improves the performance (CAR(5) = 0.91%), as shown by the overreaction signals emitted by SOI. However, the performance of trading SSE50 constituent stocks when RSI > 70 will improve the performance (CAR(5) = 0.99%) as shown by the overreaction signals emitted by RSI. We also reveal that investors should use long positions regardless of either overbought or oversold signals shown by RSI and SOI, except in the case of trading FTSE100 constituent stocks when K > 80. Thus, investors should not use the contrarian instead of momentum strategies for trading these constituent stocks as overbought signals. Contrarian strategies should be used for trading these stocks as oversold signals triggered by SOI or RSI.
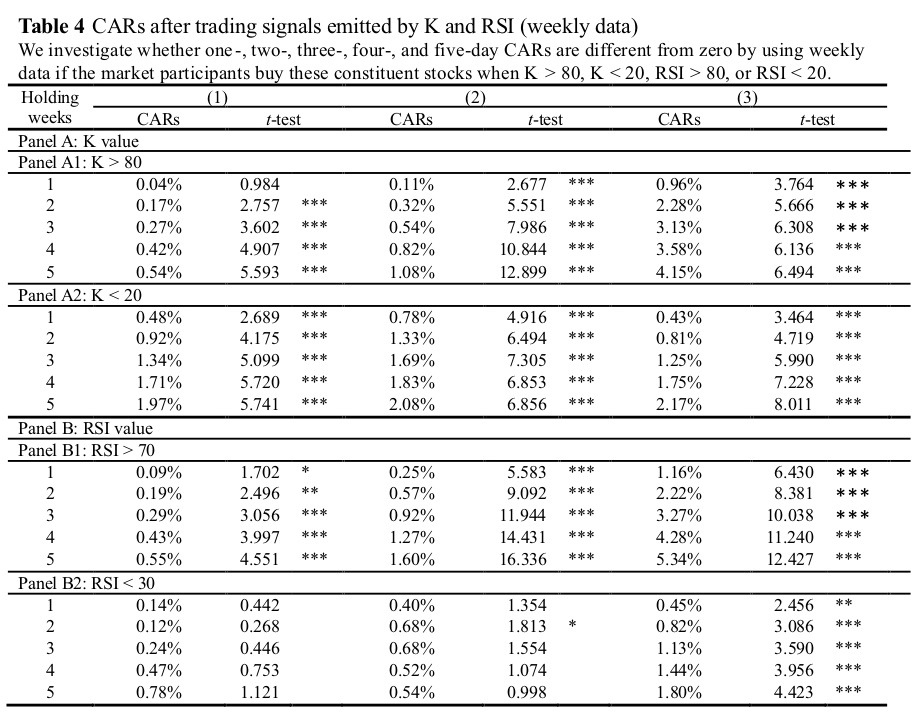
When weekly data are used instead of daily data, the results shown in Table 4 provide positive results for market participants in the following aspects. First, the highest CAR(5) is over 5% (5.34%) when using the long position on the constituent stocks of SSE50 when K < 20. This value is considerably higher than that of the highest CAR(5) of less than 1% (i.e., 0.99%) for daily data in Table 3. Second, with the use of long positions as either overbought or oversold signals triggered by RSI and SOI, the CAR(5) for the constituent stocks of SSE50 is considerably better than those for the constituent stocks of FTSE100 and DJ30. These results may indicate that the Chinese stock market is not as mature as the US and UK stock markets, thereby resulting in its market inefficiency. Consequently, investors may use long positions for the stocks listed in the China Stock Exchange as overreaction signals emitted by the RSI and SOI. Third, similar to the findings shown in Table 3, this study suggests that investors may utilize momentum strategies when trading these constituent stocks as overbought signals triggered by SOI or RSI. However, they use the contrarian strategies when trading these stocks as oversold signals triggered by SOI or RSI. Therefore, although overbought signals are triggered by RSI and SOI, market participants should not use short positions on trading these constituent stocks. This observation implied that using short positions on these constituent stocks may be unreasonable for investors even when overbought trading signals occurred.
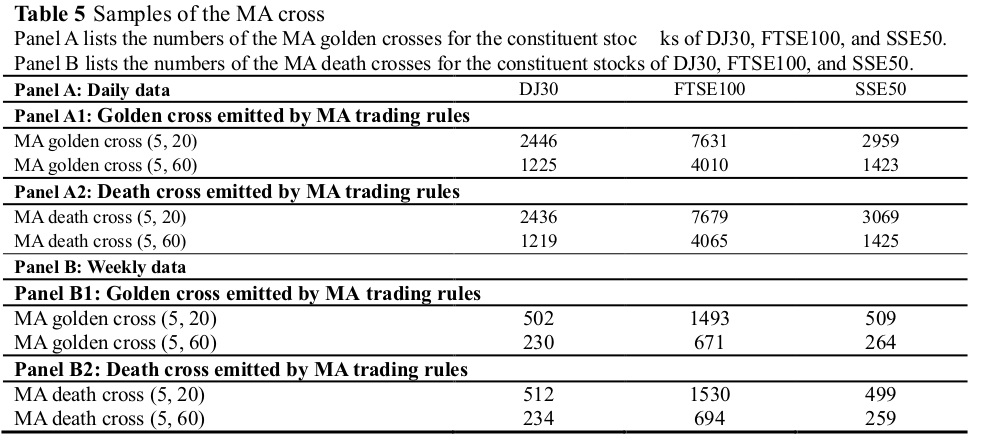
The MA trading rule is widely explored in relevant studies (Bessembinder and Chan, 1995; Brock et al., 1992). We further investigate whether market participants will display improved performance by using the MA trading rules . In the present study,we use the MA (5, 20) trading rule, which adopts 5-day (5-week) and 20-day (20-week) MA as the short-term and long-term MAs, respectively. These MAs are commonly applied by investment practitioners for further investigation. Table 4 lists the numbers of trading signals (i.e., golden cross (death cross) ) that occurred for the constituent stocks of these indices. The samples of golden crosses emitted by various MA trading rules are similar to those of death crosses emitted by diverse MA trading rules.
We also use the event study approach to measure the CARs for trading these constituent stocks as either golden cross (i.e., buying signals) or death cross (i.e., selling signals) emitted by these MA trading rules, including MA(5,20) and MA(5,60). We present the results for CARs and their statistics for trading the constituent stocks of DJ30, FTSE100, and SSE50 as golden and death crosses using the daily data (weekly data) in Panels A–B of Table 6 (Table 7).
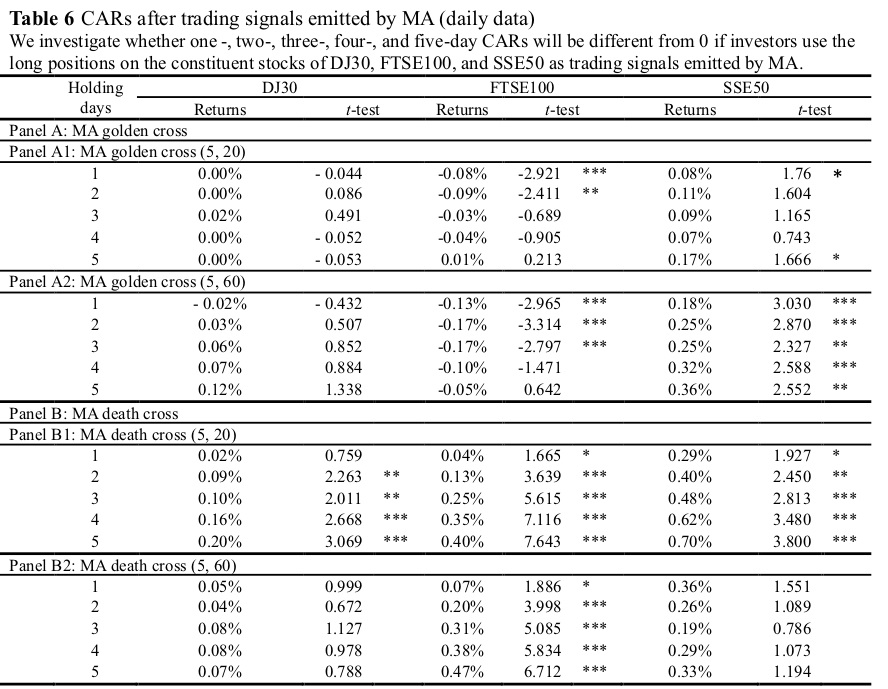
Results show that investors should use long positions on these constituent stocks when either golden or death crosses occurred, especially for the constituent stocks of SSE50. These results are similar to those revealed in RSI and SOI. Thus, investors should buy these constituent stocks when either golden or death crosses occurred. However, the CARs(5) shown in Table 6 may not be as high as those shown in Table 4, thereby indicating that using either the RSI and SOI trading rule is better than using the MA trading rule for trading these constituent stocks. Comparison of the results shown in Table 6 with those in Table 4 demonstrate that the CARs(5) shown in Table 6 are considerably less than 1%. These results indicated that investors may not outperform the markets, especially when considering transaction costs
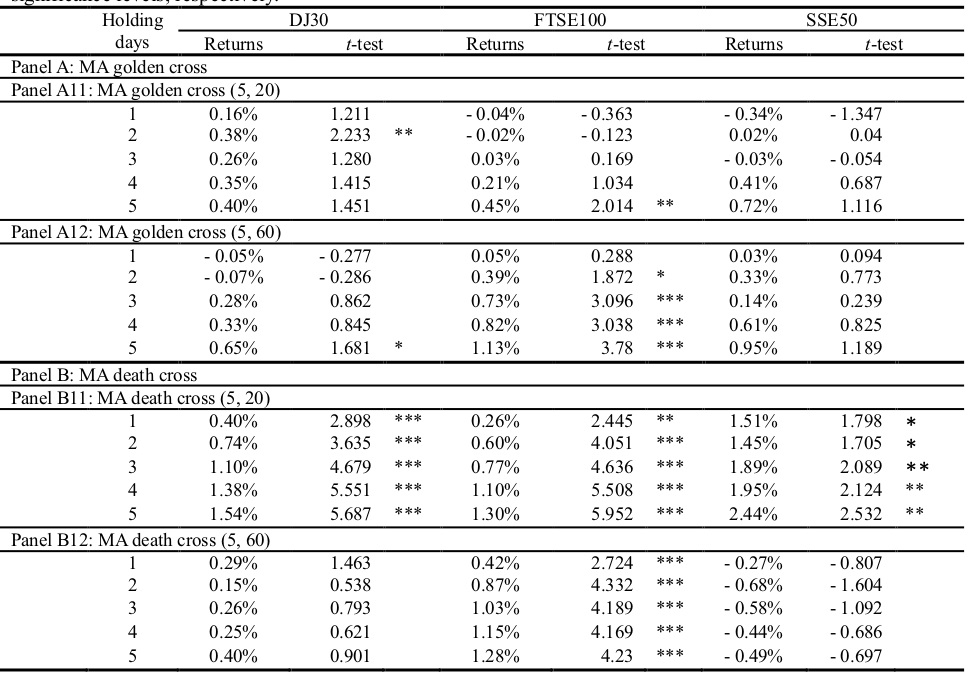
The CARs(5) shown in Table 7 are better than those in Table 6, which are similar to the results shown in Tables 3 and 4. Therefore, data frequency is important for the profitability in trading these constituent stocks and when using technical trading rules, such as MA, SOI, and RSI. Similar to the results shown in Table 6, investors should buy constituent stocks when either the golden cross or death cross is emitted. Additionally, market participants should use either momentum strategies when golden crosses are emitted or contrarian strategies when death crosses are triggered. Nonetheless, we find that the CARs(5) shown in Table 4 are considerably better than those in Table 7, which indicates that the profitability of using either SOI or RSI trading rules is superior to that of utilizing MA trading rules regardless whether daily and weekly data are used. The reduced performance of MA trading rules may be due to the market efficiency concerns. Thus, the abnormal profits may decline by using MA trading rules because market participants are familiar with the MA trading rule over other technical trading rules.
We investigate whether investors can outperform the markets by using overshooting trading signals emitted by RSI and SOI and considering data frequency, such as daily and weekly data. We examine whether investors can achieve satisfactory CARs as trading signals emitted by RSI and SOI by using the event study approach. We also compare the performances of using RSI and SOI trading rules with those of using the MA trading rule, which is widely utilized by practitioners. First, we show that the use of weekly data will achieve better performance than that using daily data regardless of whether RSI, SOI, or MA trading rules are used. This result demonstrates that data frequency is important for trading rules in terms of technical analysis. Second, market participants should use long positions as either overshooting trading signals emitted by RSI and SOI or trading signals emitted by MA. Third, investors should adopt RSI and SOI trading rules instead of the MA trading rule because well-known trading rules may not achieve high profits due to the market efficiency concern. This study contributes to the existing literature in the following aspects. First, we investigate whether investors will outperform the market by using either daily or weekly data as trading signals emitted by various technical trading rules. Second, investors should use long positions as overshooting trading signals, including overbought and oversold trading signals, emitted by RSI and SOI, as well as the trading signals (including golden and death crosses) by MA. Our results are beneficial for market participants. Third, we use the constituent stocks of three representative indices, namely, DJ30, FTSE100, and SSE50, because investors may be unable to trade index spots instead of index futures. Fourth, we show that data frequency is important in trading stocks because of the better performance of weekly data than that of daily data. This study also presents two valuable implications. First, technical trading rules are important. Otherwise, technical trading rules may not exist on numerous websites. Technical trading rules can also be influenced with the trading stocks of market participants. Second, valuable and unreleased information is possibly disclosed by technical trading indicators because the emitted trading signals may not constantly occur at random. Third, the trading signals emitted by SOI, RSI, and MA may provide valuable information for profit exploitation. Therefore, investors may consider these technical indicators because several technical indicators provide individual ntributions.
Ahern, K. R. (2009). Sample selection and event study estimation. Journal of Empirical Finance, 16(3), 466-482. Brown, N. C., Wei, K. D., & Wermers, R. (2013). Analyst recommendations, mutual fund herding, and overreaction in stock prices. Management Science, 60(1), 1-20. Butler, K. C., & Malaikah, S. J. (1992). Efficiency and inefficiency in thinly traded stock markets: Kuwait and Saudi Arabia. Journal of Banking & Finance, 16(1), 197-210. Brasileiro, R. C., Souza, V. L., & Oliveira, A. L. (2017). Automatic trading method based on piecewise aggregate approximation and multi-swarm of improved self-adaptive particle swarm optimization with validation. Decision Support Systems, 104, 79-91. Chan, S. Y., & Fong, W. M. (2004). Individual investors’ sentiment and temporary stock price pressure. Journal of Business Finance & Accounting, 31(5‐6), 823-836. Chen, H., Chong, T. T. L., & Duan, X. (2010). A principal-component approach to measuring investor sentiment. Quantitative Finance, 10(4), 339-347. Chiang, Y. C., Ke, M. C., Liao, T. L., & Wang, C. D. (2012). Are technical trading strategies still profitable? Evidence from the Taiwan Stock Index Futures Market. Applied Financial Economics, 22(12), 955-965. Chopra, N., Lakonishok, J., & Ritter, J. R. (1992). Measuring Abnormal Performance - Do Stocks Overreact. Journal of Financial Economics, 31(2), 235-268. Chordia, T., Roll, R., & Subrahmanyam, A. (2008). Liquidity and market efficiency. Journal of Financial Economics, 87(2), 249-268. Conrad, J., Gultekin, M. N., & Kaul, G. (1997). Profitability of short-term contrarian strategies: Implications for market efficiency. Journal of Business & Economic Statistics, 15(3), 379-386. Debondt, W. F. M., & Thaler, R. H. (1985). Does the Stock-Market Overreact. Journal of Finance, 40(3), 793-805. Debondt, W. F. M., & Thaler, R. H. (1987). Further Evidence on Investor Overreaction and Stock-Market Seasonality. Journal of Finance, 42(3), 557-581. Duan, W., Gu, B., & Whinston, A. B. (2008). Do online reviews matter?—An empirical investigation of panel data. Decision support systems, 45(4), 1007-1016. Economou, F., Hassapis, C., & Philippas, N. (2018). Investors’ fear and herding in the stock market. Applied Economics, 50(34-35), 3654-3663. Fama, E. F. (1965). The behavior of stock-market prices. The Journal of Business, 38(1), 34-105. Fama, E. F. (1991). Efficient capital markets: II. Journal of Finance, 46(5), 1575-1617. Fama, E. F. (1998). Market efficiency, long-term returns, and behavioral finance. Journal of Financial Economics, 49(3), 283-306. Feuerriegel, S., & Prendinger, H. (2016). News-based trading strategies. Decision Support Systems, 90, 65-74. Hamid, K., Suleman, M. T., Ali Shah, S. Z., Akash, I., & Shahid, R. (2017). Testing the weak form of efficient market hypothesis: Empirical evidence from Asia-Pacific markets. International Research Journal of Finance and Economics, 58, 121-133. Huang, P., & Ni, Y. (2017). Board structure and stock price informativeness in terms of moving average rules. The Quarterly Review of Economics and Finance, 63, 161-169. Kling, G., & Gao, L. (2008). Chinese institutional investors’ sentiment. Journal of International Financial Markets, Institutions and Money, 18(4), 374-387. Koch, A. (2017). Herd behavior and mutual fund performance. Management Science, 63(11), 3849-3873. Kumar, A., Page, J. K., & Spalt, O. G. (2013). Investor sentiment and return comovements: Evidence from stock splits and headquarters changes. Review of Finance, 17(3), 921-953. Kraus, M., & Feuerriegel, S. (2017). Decision support from financial disclosures with deep neural networks and transfer learning. Decision Support Systems, 104, 38-48. Lee, W. Y., Jiang, C. X., & Indro, D. C. (2002). Stock market volatility, excess returns, and the role of investor sentiment. Journal of Banking & Finance, 26(12), 2277-2299. Lehmann, B. N. (1990). Fads, martingales, and market efficiency. The Quarterly Journal of Economics, 105(1), 1-28. Malkiel, B. G., & Fama, E. F. (1970). Efficient capital markets: A review of theory and empirical work. Journal of Finance, 25(2), 383-417. Marshall, B. R., Young, M. R., & Rose, L. C. (2006). Candlestick technical trading strategies: Can they create value for investors? Journal of Banking & Finance, 30(8), 2303-2323. Naughton, T., Truong, C., & Veeraraghavan, M. (2008). Momentum strategies and stock returns: Chinese evidence. Pacific-Basin Finance Journal, 16(4), 476-492. Ni, Y., Liao, Y.-C., & Huang, P. (2015). MA trading rules, herding behaviors, and stock market overreaction. International Review of Economics & Finance, 39, 253-265. Schmeling, M. (2009). Investor sentiment and stock returns: Some international evidence. Journal of Empirical Finance, 16(3), 394-408. Shynkevich, Y., McGinnity, T. M., Coleman, S. A., & Belatreche, A. (2016). Forecasting movements of health-care stock prices based on different categories of news articles using multiple kernel learning. Decision Support Systems, 85, Urquhart, A. (2016). The inefficiency of Bitcoin. Economics Letters, 148, 80-82.
To save space, we will not introduce these concepts in detail because these technical indicators are introduced in detail in the following Wikipedia pages: RSI is introduced in detail here: https://en.wikipedia.org/wiki/Relative_strength_index. SOI is introduced in detail here: https://en.wikipedia.org/wiki/Stochastic_oscillator. The overbought (oversold) trading signals emitted are set when RSI > 70 (RSI < 30) for RSI and K > 80 (K < 20) for SOI. To save space, we will not introduce MA trading rules in detail in the text because they are introduced in detail on Wikipedia (https://en.wikipedia.org/wiki/Moving_average and https://en.wikipedia.org/wiki/Moving_average_crossover). MA (5, 20) is used in this study due to two main reasons. First, MA (5, 20) is widely used by practitioners. Second, MA is a 20-period MA used for measuring MA trading signals. MA trading signals, including the emitted golden and death crosses, are defined as follows: Golden cross emitted: short-term MA (SMA(t)) >long-term MA (LMA(t))and SMA(t–1)< LMA(t–1), and Death cross emitted:SMA(t) < LMA(t)and SMA(t–1) > LMA(t–1).

