|
Vinmalar J Research Scholar, PG and Research Department of Commerce (Shift1), University of Madras Loyola college, Chennai - 34, vinmalarj@gmail.com, 9710218327 No 9/2b, Satyam Apts, Tank Street, UI colony, Kodambakkam, Chennai – 600 024 |
Jacob Davis K Assistant Professor PG and Research Department of Commerce (Shift1), University of Madras Loyola college, Chennai –34, jacobdavisk@gmail.com, 9003153149, 5/11, Sammundeswari Nagar, 1st Street, T.V.K. Nagar, Perambur, Sembium, Chennai – 600 011. |
Innovations are generated very quickly and the adoption of those innovated products among the common public are analysed by five different stages of innovation theories. Innovative products are marketed in many ways through ordinary shops, malls, online, telephone marketing, etc. Those goods and services are bought only when they are of good quality, reliable, easy availability and affordable. Innovative in financial technology is termed as Fintech, which changes the mode of business from traditional way by adopting modern techniques in selling the products and the mode of payment. This study was framed out to analyse the how far the youngsters are using the various digital services in their day to day life. When was the adoption took place is also analysed. The satisfaction level is identified in using the various digital inventions.
Keywords: Innovation, Innovation Theories, Financial Technology, Youngsters, Usage of Digital Products in Day-Today Life, Satisfaction Level.
Traditional Financial Technologies had underwent a huge change throughout the last decade Zavolokina et al., (2016). Nakashima (2018), in recent years a remarkable trend is seen in all business sectors and industries by improving their business and the lifetime of a business is extended by adopting newest technologies. Fintech is a term compounded of ‘finance’ and ‘technology’ and collectively refers to industrial changes by implementing the updated technology into its production of goods and services. It is an industry which uses mobile as a centric one with the support of Information Technology (IT) to enhance the efficiency of the financial system. In terms of financial technology, the new technology and innovations are emerging to compete with traditional financial methods in delivering the financial services. The emerging industry uses the technology to improve the activities of finance. The phenomenon is that a non-financial business uses innovative technology to provide services like remittance of money, payment and settlement, and investment, without working with a financial company. Major examples are Apple Pay, Ali pay, Google Pay, Pay tm, etc. Skan et al. (2015), Fintech brings new opportunities in supporting people, for example, by allowing transparency, reducing costs or cutting middlemen and the most important one is it delivers information to be accessed. Dapp et al., (2014) Fintech can be examined as a financial service provider which is intervened by innovative technologies in order to fulfil the requirements of tomorrow via business process improvement, cost reduction, high efficiency, rapidity, flexibility and innovation. Fintech is an industry which uses mobile-centered IT technology to enhance the efficiency of the financial system.The proliferation of the mobile payment market leads the payment services as easy and convenient one and that lead to the fastest growth among Fintech services. The creation of “Apple Pay” by Apple triggered and shaped the mobile payment as a convenient one in the market. The fastest growing Korean Equivalents was “K Pay” Kim et al., (2015). Financial Technology involves the design and the delivery of financial products and services through technology. Digital technologies are in the stream of challenging the fundamentals of highly regulated financial sector which lead to the emergence of non-traditional payment and peer-t o-peer money exchanges. In the growing days technology is invading a private space and controversies about spam, cookies, cloud attacks, adware, virus, worm, Trojan, spyware, botnets, rootkits are few of the ongoing threats and problems faced by the online information technology (IT) users. Lardner (1999) examined since there was a great lack of public confidence that turned into a serious impediment to full-scale electronic commerce. In spite of many hindrances the usage of Fintech started to grow by the promotional offers provided by the organisation or e-companies. This growth can be hugely found among teenagers who are very well capable in using technology through mobiles, tab and systems. Hence this study was concentrated among youngsters especially with regard to college going students, to analyse the usage level technological services that is available on digital mode of transaction. Therefore, this study was framed to examine the influence level of Fintech in daily life. The innovation stages of adoption was used to analyse the adoption stage on each of the available products and services through online. The mode of payment after the usage of those services was also studied. Finally the satisfaction level on usage of those technical products and services was also found out.
From various studies and by viewing the tendency of humans, we can see that not everyone will immediately adopt the new invented products, services or ideas. Rather they take some time in knowing about both the positive and negative of those invented ones and take a lead to accept or adopt it. Everett Rogers, a professor of communication studies identified some fascinating personality traits which depicted how people will accept a new innovation. Thereby he brought out the five stages as Innovation Theory during 1962. Those five stages are:
1. Innovators Innovators are the individuals who first adopt the innovation at once that is been launched. Innovators will be willing to take risk, by buying the invented product or by using those services. Usually they will be youngest in age, possess the highest social class, have great financial lucidity, very social and have closet observation of the informative on those innovations. Risk tolerance will make them to adopt technologies even though which may ultimately fail where financial resources will help them in absorbing those failures.
2. Early Adopters Individuals under this stage will be stated as second fastest category of individuals adopting an innovation. These individuals play the role of opinion leaders among the other adopter categories. They are also young in age, have higher social status, have more financial lucidity, advanced education and they will be more socially forward than the late adopters and more discrete in adoption choices when compared with innovators. By their judicious choice of adoption, it will make them to maintain the central communication position
3. Early Majority Individuals as early majority will adopt an innovation after a varying degree of time. This type of adoption will slightly take longer time than the innovators and early adopters. Early majority people will tend to be slower in the adoption process. They possess the degree as above average social class status, they contact with early adopters and rarely hold the position of opinion leadership
4. Late Majority Individuals in this stage will adopt an innovation after the average members of the society have been adopted. These category of individuals approach the innovation with a doubt and after the majority of society have adopted the innovation. Late majority are generally filled with doubtfulness about an innovation. They are grouped under below average social class, have very little financial lucidity when compared with late majority and early majority. They possess very little opinion leadership.
5. Laggards Individuals in this category will be treated as the last to adopt an innovation. Individuals of this category will not be as an opinion leadership. These individuals typically have a strong disagree to accept the change and tend to be advanced in age. Laggards generally focus on traditions on a higher basis. They possess lowest social class status and lower financial fluidity. They be the oldest of all other adopter’s category. They will be in contact only with their family and close friends.
Davis (1989); Davis et al. (1989), stated that online purchase intentions must be explained in part by the Technology Acceptance Model (TAM). Gefen and Straub (2000), at present this model is a leading theory of technology acceptance in IS research. Many empirical test had shown that TAM is a parsimonious and robust model of technology acceptance behaviours in a wide variety of Information Technology (IT). Despite that TAM research has explored IT acceptance in the context of work – related activity, the theory is even applicable and it has been successfully applied to diverse non-organizational settings which was analysed in Agarwal and Karahanna (2000); Davis et al. (1989), (1992); Mathieson (1991), including e-commerce, Gefen and Straub (2000); Gefen et al. (2000); Lederer et al. (2000); Lee et al. (2001). According to TAM the intention to use new IT is determined by two beliefs dealing with i. the Perceived Usefulness (PU) in using the new IT, PU is a measure of an individual’s subjective assessment of the utility offered by the new IT in a specific task related context and ii. The Perceived Ease of Using (PEOU) new IT, PEOU is an indicator of the cognitive effort required to learn and to utilize the new IT. Udo (2001), analysed that during the period of 2000 public lacked in confidence of using online information technology and had no trust in the information society. Privacy and security concerns were the main reason for not purchasing over the web. From a sample size of 158 participants the study was concluded saying major concerns like privacy, security, threats, impersonation and forged identity, children protection, e-mail safety and censorship were treated as a block for the users to use technology. Hence successful organizations were spending their resources to ensure that IT users’ concerns are adequately addressed. Besides this Carlos Roca et al., (2009), again carried on a study in applying Augmented Technology Acceptance Mode (TAM) in the midst of 20th century among youngsters and revealed that perceived trust, usefulness and ease of use were considered as important aid to deal in online trading. Arner et al. (2015) analysed the evolution of FinTech sector among three major eras and, then, mainly focused on the challenges that were faced in from the regulatory perspective. Cuesta et al. (2015) studied about Fintech in relation to digitalization and digital transformation of the financial services especially in banking sector and identifies that there are three existing successive phases of digitalization of bank’s processes are reaction to new competition, technological adaptation and strategic positioning. Kim et al., (2015) focused his study on mobile payment services by adopting the service of Fintech. He analysed that the variable factors such as convenience and usefulness, invigorating payment type Fintech Services, were the most critical variables in terms of use. On other side institutional aspect, government regulations and stronger security stood as pathway to use the technological services for making their payment. Kim et al., (2016), examined the acceptance of Fintech in payment type in applying the Elaboration Likelihood Model and by analysing the variables that are associated with the Technology Acceptance Model. Results intimated that intention to use Fintech was because of its credibility, ease to use, privacy in information stored and its usefulness. Leong et al., (2017), studied about nurturing a Fintech ecosystem by observing a scenario of a youth who is running a microloan start up in china. This case study examined the development of Fintech which offers microloans to college students. Their findings of the study highlighted how technology offers the strategic capability for a firm to occupy a market niche in the sector of finance, also the resulted saying that Fintech improves the financial inclusion of previously excluded market segments.Fintech is been promoted which brings technologies in the field of financial industry to a new level enabling it to innovate and revolutionize the concepts of thinking about money and banking itself (Baur et al., 2015). Fintech is closely related with financial innovation, Frame and White (2009) resulted the overview of how financial innovations had been changed within three categories – new products and services, new production processes and new organizational forms. Lerner and Tufano (2011), stated that financial innovations can be viewed as an act of creating and then familiarizing new financial instruments, new financial technologies, institutions and markets. Gefen et al., (2009), explored that online trust is developed because of belief that i. the vendor has nothing to gain by cheating, ii. there are some safety mechanisms built into the website, iii. in having a typical interface and iv. easy to use. The researchers also stated that a separate and distinct interaction between the e-vendor and the buyer is created with IT Web site interface, which resembles as heart of online shopping.
Research Methodology is presented as under:
1. To determine the stages of adopting those invented digital products among youngsters
2. To analyse the mode of online payment/transfer for those online purchased goods and the influence factor for using online payment services.
3. To determine the satisfaction level in using the various digital inventions.
Universe of the study: Youngsters of college going students, of those pursuing Under Graduate and Post Graduate.
Sampling unit: The study was carried out by collecting the data from college going students of Arts and Science in Chennai city. Restricting to Loyola College and Stella Maris College.
Sample Technique: Simple random sampling technique was used.
Sample Size: Data were collected from 130 respondents in Chennai city.
The data were collected by circulating questionnaires towards the target sample of college going students of both Loyola College and Stella Maris College within Chennai city. Secondary data were collected from websites, newspaper reports, books and trade journal.
We used One Way Anova Test to analyse the association between demographic factors and the adoption stage of digital products. Linear Regression was applied to test association between demographic factors and the mode of online payment/transfer for those online purchased goods. Frequency analysis was used to rank the mode of payment with regard to online purchase / transfer of payment.Pearson Correlation was used to find out the association between the usage of digital products and its satisfaction level.
In order to meet the objectives following Null Hypotheses are proposed Ho1: There is no association between demographic factors and the adoption stage of digital products. Ho2: There is no association between demographic factors and the mode of online payment/transfer for those online purchased goods. Ho3: There is no association between the usage of digital products and its satisfaction level.
1. The data were collected randomly from all college going students of Arts and science where the study was not confined to figure out which department of student have adopted more and the satisfaction level in using the technological services. 2. A convenience sample of this study was selected from choosing the two college’s within Chennai city. 3. The sample size was limited to 130. 4. Respondent’s bias could not be ruled out in questionnaire method
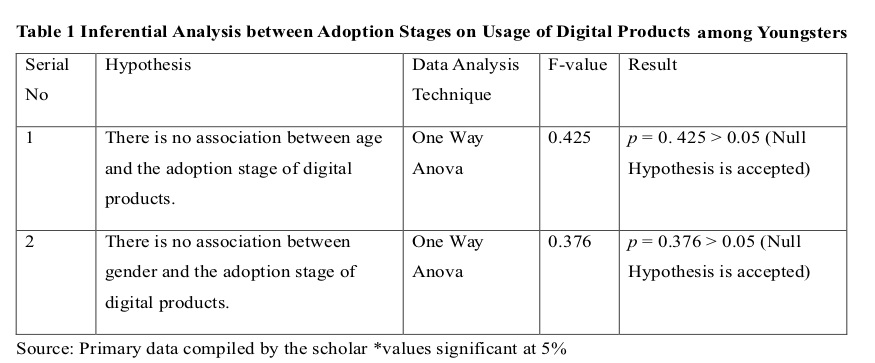
*values significant at 5%
Table 1 depicts the results of One Way Anova Test, of the association between demographic factors and the adoption stage of digital products. It is very clear that demographic factors like age and gender has no association with the adoption stage of digital products since the F-value of each is more than 0.05. These values are obtained at a significant level of 5%. In using the financial technology mode in selling the products through online, it was found that the adoption of online purchase among youngsters were differentiated into stages of innovators, early adopter, early majority, late majority and laggards. From the collected respondents it was found that 52% of respondents adopted the online mode of Mobile/DTH recharge as an innovators, followed by 50% of them started to use online facility to watch Movie/TV shows, 46% of them used the online fee payment services, 42% used buying food from online, 40% adopted the online services provided by ola, uber, for transport and below 38% the youngsters make use of other online services such as buying books / stationery, clothes, electronic items, accessories, fruits and vegetables, groceries, home and furniture items, transfer of money and only 19% of women respondents out of 64% preferred buying beauty products from online stores.
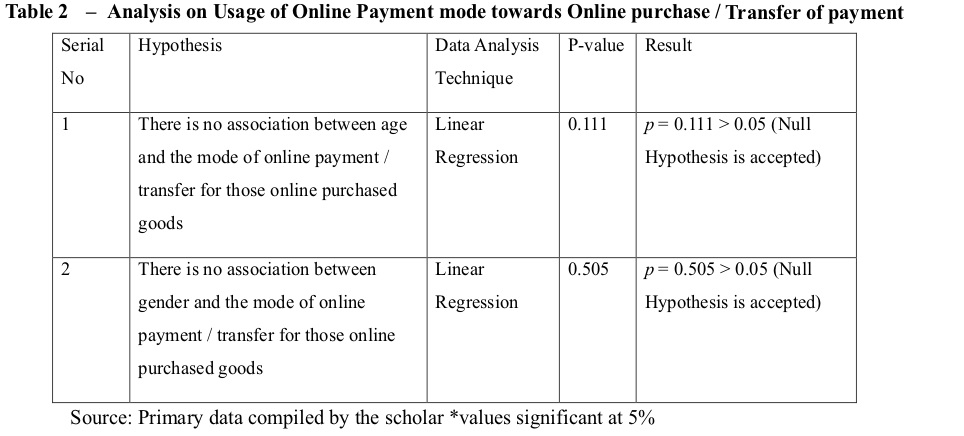
Table 2 depicts the results of Linear Regression analysis, of the association between demographic factors and the mode of online payment/transfer for those online purchased goods. It is very clear that demographic factors like age and gender has no association with the mode of online payment / transfer for those online purchased goods, since the F-value of each is more than 0.05. These values are obtained at a significant level of 5%.
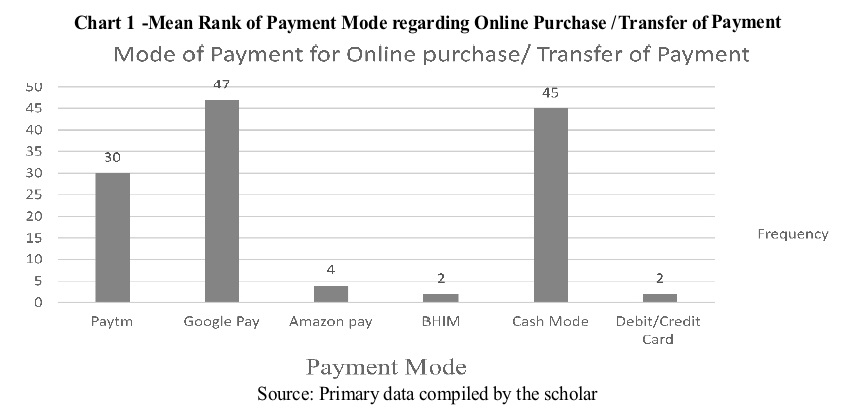
From the above chart, it’s found that majority of respondents use Google pay as their mode for payment and transfer of money. Even after the implementation of digital mode of payment for the purchase of goods or for transferring money to another account still many prefer the payment mode in cash. From this current study it was found that 45% of respondents among sample size of 130 people use cash mode towards the payment purpose.Among various applications or e-wallets being innovated google app reached the top most in usage level, which was observed from the respondents. The reasons for more usage of google pay are easy accessibility, convenience, friend’s suggestion and followed by promotional offers. On an overall by combining all the digital services offered for payment 85% of respondents use those available digital services.
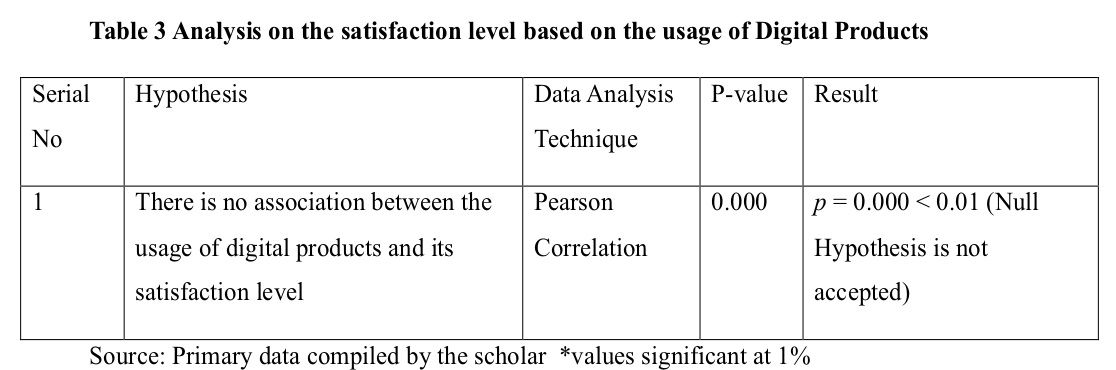
Table 3 depicts the results of Pearson Correlation, of the association between the usage of digital products and its satisfaction level. From the result we can say that there is an association between the usage of digital products and its satisfaction level. Where the F-value of is less than 0.05. These values are obtained at a significant level of 5%. On using the various digital services available people have different levels of satisfaction based on the experience when they have face while using those online technical services. In using various digital services satisfaction levels are categorised as i. Customer expectations are met, ii. Exceed customer expectation, iii. Delight in using, and iv. Amazing. From the respondents it was found that customer’s expectation are met on a higher level by Ola (transport), followed by Flipkart, Amazon, Uber (transport), Swiggy (Food), Game applications, Bank applications, Study applications, Ola (food panda), Snap Deal and lastly Uber (food).
|1. Majority of respondents are under the age group of 20–22 and 62% of respondents are under the age group of 17–19. 2. From the study it was found that 18% of respondents started to use the digital products and services by the age group of 10 and below, 55% of them started to use between the age group 11 to 15 and 56% of respondents started to use between the ager groups of 16 to 21. 3. It was analysed that only 54% of respondents always approach for online payment method, 65% of youngsters approach online payment rarely and 11 % of them never use those online payment services at all. 4. Majority of respondents are using internet bank facility for transfer of money, balance enquiry and for other services, 24% of respondents use bank application of their respective bank to avail those services and 50% of youngster use both internet bank facility and bank application. 5. From the study it was analysed that 16% of youngsters haven’t used Flipkart, 10% on Amazon, 60% on Snap deal, 25% on Swiggy, 55% on Ola - Food panda, 5% on Ola -Transport, 45 % on Uber – Food , 21% on Uber - transport, 42 % on Zomato, 26% on bank application, 20% Game applications and 30% on study applications.
As the population is increasing day by day, the family size also increases automatically where the expense ratio also gets high because of this many fail to save a part of amount at their current stage of working life in order to bear any expenses which arises at any point of time. This study was carried out to find the level of adoption stages of technological products and services among youngsters targeting college going students, their mode of online payment and their satisfaction level. The findings of the study indicate that there is no association between demographic factors and the adoption stage of digital products. There is no association between demographic factors and the mode of online payment/transfer for those online purchased goods. Majority of the youngsters use Google Pay on a huge basis towards the online payment and transfer of money. The study also revealed that, that there is an association between the usage of digital products and its satisfaction level. Technological services such as Ola, Uber, Flipkart, Amazon, Swiggy, Zomato, Bank applications, Study applications, etc. meet the customer’s expectation but they all are lacking to feel the customers as amazed through the services which they provide. On an average only 14.41 % percent of respondents are delightful in using those Technical digital services.
Zavolokina, L., Dolata, M., &Schwabe, G. (2016). FinTech–What's in a Name?. Nakashima, T. (2018). Creating credit by making use of mobility with FinTech and IoT. IATSS Research, 42(2), 61-66. . Skan, J., Dickerson, J., and Masood, S. 2015. “The Future of Fintech and Banking: Digitally disrupted or reimagined?,” (available at http://www.fintechinnovationlablondon.co.uk/media/730274/AccentureThe-Future-of-Fintech-and-Banking-digitallydisrupted-or-reima-.pdf). Dapp, T., Slomka, L., AG, D. B., & Hoffmann, R. (2014). Fintech–The digital (r) evolution in the financial sector. Deutsche Bank Research”, Frankfurt am Main. Kim, Y., Park, Y. J., Choi, J., &Yeon, J. (2015). An Empirical Study on the Adoption of “Fintech” Service: Focused on Mobile Payment Services. Advanced Science and Technology Letters, 114(26), 136-140. Lardner, J. (1999), ``I know what you did last summer and fall’’, US News & World Report, Vol. 126 No. 15, p. 55. Davis, F. D. (1989). "Perceived Usefulness, Perceived Ease of Use and User Acceptance of Information Technology," MIS Quarterly, 13(3), pp. 319-340. Davis, F. D., Bagozzi, R. P., and Warshaw, P. R. (1989). "User Acceptance of Computer Technology: A Comparison of Two Theoretical Models," Management Science, 35(8), pp. 982-1003. Gefen, D., and Straub, D. W. (2000). "The Relative Importance of Perceived Ease-of-Use in IS Adoption: A Study of E-Commerce Adoption," Journal of the Association for Information Systems, 1(8), pp. 1-30. Agarwal, R., and Karahanna, E. (2000). "Time Flies When You're Having Fun: Cognitive Absorption and Beliefs About Information Technology Usage," MIS Quarterly, 24(4), pp. 665- 694. Davis, F. D., Bagozzi, R. P., and Warshaw, P. R. (1989). "User Acceptance of Computer Technology: A Comparison of Two Theoretical Models," Management Science, 35(8), pp. 982-1003. Davis, F. D., Bagozzi, R. P., and Warshaw, P. R. (1992). "Extrinsic and Intrinsic Motivation to Use Computers in the Workplace," Journal of Applied Social Psychology, 22(14), pp. 1111- 1132. Mathieson, K. (1991) "Predicting User Intentions: Comparing the Technology Acceptance Model with the Theory of Planned Behavior," Information Systems Research, 2(3), pp. 173-191. Gefen, D., and Straub, D. W. (2000). "The Relative Importance of Perceived Ease-of-Use in IS Adoption: A Study of E-Commerce Adoption," Journal of the Association for Information Systems, 1(8), pp. 1-30. Gefen, D., Straub, D. W., and Boudreau, M.-C. (2000). "Structural Equation Modeling and Regression: Guidelines for Research Practice," Communications of the Association for Information Systems, 4(7), pp. 1-70. Lederer, A. L., Maupin, D. J., Sena, M. P., and Zhuang, Y. (2000). "The Technology Acceptance Model and the World Wide Web," Decision Support Systems, 29(3), pp. 269-282. Lee, D., Park, J., and Ahn, J.( 2001). "On the Explanation of Factors Affecting E-Commerce Adoption," Proceedings of the 22nd International Conference on Information Systems, V. Storey, S. Sarker, and J. I. DeGross (eds.), New Orleans, Louisiana, pp. 109-120. Udo, G. J. (2001). Privacy and security concerns as major barriers for e-commerce: a survey study. Information Management & Computer Security, 9(4), 165-174. Carlos Roca, J., José García, J., & José de la Vega, J. (2009). The importance of perceived trust, security and privacy in online trading systems. Information Management & Computer Security, 17(2), 96-113. Arner, D. W., Barberis, J. N., and Buckley, R. P. 2015. “The Evolution of Fintech: A New Post-Crisis Paradigm?,” (available at http://papers.ssrn.com/sol3/Papers.cfm?abstract_id=2676553). Cuesta, C., Ruesta, M., Tuesta, D., and Urbiola, P. (2015). “The digital transformation of the banking industry,” BBVA Research (available at https://www.bbvaresearch.com/wpcontent/uploads/2015/08/EN_Observatorio_Banca_Digital_vf3.pdf). Kim, Y., Park, Y. J., Choi, J., &Yeon, J. (2015). An Empirical Study on the Adoption of “Fintech” Service: Focused on Mobile Payment Services. Advanced Science and Technology Letters, 114(26), 136-140. Kim, Y., Park, Y. J., & Choi, J. (2016). The adoption of mobile payment services for “Fintech”. International Journal of Applied Engineering Research, 11(2), 1058-1061. Leong, C., Tan, B., Xiao, X., Tan, F. T. C., & Sun, Y. (2017). Nurturing a FinTech ecosystem: The case of a youth microloan startup in China. International Journal of Information Management, 37(2), 92-97. Baur, A. W., Bühler, J., Bick, M., and Bonorden, C. S. 2015. “Cryptocurrencies as a Disruption? Empirical Findings on User Adoption and Future Potential of Bitcoin and Co,” in Open and Big Data Management and Innovation, Springer, pp. 63–80. B Frame, W. S., and White, L. J. 2004. “Empirical studies of financial innovation: lots of talk, little action?,” Journal of Economic Literature (42:1), pp. 116–144. Lerner, J., and Tufano, P. 2011. “The consequences of financial innovation: a counterfactual research agenda,” National Bureau of Economic Research. Gefen, D., Karahanna, E., & Straub, D. W. (2003). Trust and TAM in online shopping: an integrated model. MIS quarterly, 27(1), 51-90.

