|
Mruthyanjaya Rao Mangipudi Department of Management Studies RTM Nagpur University Nagpur, Maharashtra, India |
KDV Prasad Department of Management Studies RTM Nagpur University Nagpur, Maharashtra, India |
Rajesh Vaidya Department of Management Studies RTM Nagpur University Nagpur, Maharashtra, India |
This empirical study reports the results of our survey research on how the Performance Management System of an organization will be affected by factors responsible improved employee performance, impact of performance management system on employee performance and factors that contribute and responsible for employee personal, knowledge level, job related and communication interpersonal competencies. A survey on 924 employees, consisting 545 men and 379 women employees working in them Commerce or IT Enabled Service companies operating around Hyderabad was carried out. A structured and undisguised questionnaire was developed and published over Google form and link was provided to the respondents. The six independent factors which make significant effect on performance management system – factors that responsible for improved employee performance, impact of performance management system on employee performance, and four employee competencies - personal, knowledge level, job-related, communication and interpersonal competency that influence the performance management system, a dependent factor were studied. The data was gathered using a 5-point Likert-type scale and the reliability of the survey instrument and internal consistencies were measured using reliability statistic Cronbach Alpha. The Cronbach alpha values ranged from 0.65 to 0.86 for men and 0.67 to 0.84 for the factors measured indicating a strong reliability of the survey instrument. The results from the multinomial logistic regression analysis suggested statistically significant association between performance management system and factors that responsible for improved employee performance(OR =0.010, 95% CI 0.002-0.071), impact of performance management systemon employee performance, (OR=0.030, 95%CI 0.001-0.685), and employee competencies personal (OR=0.160, 95% CI 0.052-0.494), communication and interpersonal competency (OR=0.05, 95% CI 0.935-436.412) significantly influencing the performance system. Statistically, significant gender differences were observed along with the said factors influencing performance management system among the men and women employees of mCommerce industry.
Keywords: Performance Management System, Mcommerce, Cronbach Alpha, Multinomial Logistic Regression, Odd Ratio
Performance Management System defines and measures the performance, and dissects the sources of employee performance deficits. The success of an organization mostly depends on the effective performance management systems practiced to assess the employee performance. Most of the organisations align the performance management systems to its vision, mission and goals of the organisation. Performance management system is continuous and evolving to assess the emerging performance of an organisation and execution of goals and objectives of an organization (Aslam and Shah, 2009). Performance management system sets prospect of employee performance and encourages to be successful in means that is projected by the business of an organization and acts as benchmark for evaluating the performance outcome of organizations and workforce (Babu and Suhasini, 2017). Performance management system is one of the largest contributors in ensuring organizational effectiveness. Ignorance of PMS will have the potential negative impact on the performance of the employees and effect organization, and if continued could deteriorate the whole organization. There is no use how much talented people are pumped into the organization, if the organization is not in a position to develop them and grow them to their fullest potential. It is the role of HR leaders or the Management team, who are directly responsible and part of performance management, to identify what skills, abilities and competencies the employees have in them, they can’t be managed. Based on this knowledge base, employee performance improvement strategies can be formulated to make employees that there is a potential for growth within the organisation. This will keep the employees well engaged, motivated and committed, and it has its own positive impact on their overall performance. Performance is a personnel activity that has been assessed as to its sustainability or rightness in a managerial context (Paile, 2012). A perfectly executed performance management system would result in high-level employee engagement and more dedicated personnel and employee engagement conversely will influence performance of an employee (Noronha, et al. 2016). Stakeholder attachment, constant monitoring, review, propagation and learning from outcomes and leadership commitment are some of the main features of an effective performance management system (Kim, 2010). Managing and assessing performance of an employee play an important role in any organisation and performance management provides a direction to the staff by assistant from organization. The two-fold performance management system that is assessing the performance of managers to accomplish strategic objectives and staff performance assessment to accomplish both the managerial and individual requirements (Zvavahera, 2014). The performance management system empowers individual staff member and organization to accomplish planned determinations by means of system which are both systemic and organized (Esu, et al. 2009).
According to the Mercer’s 2019 Global Performance Management Survey, only 2 percent of companies believe their existing performance management system delivers exceptional value and this is a trend for the last five years. From the responses of 1154 HR leaders, the survey has identified four factors that can enhance performance management – goal alignment, effective coaching by empathetic managers, dropping performance ratings, and integrated talent strategy. Jahanshahi et al. (2011) reported that ITES giants like Tech Mahendra, Wipro, Accenture, in Hyderabad were found to be implementing effective performance management system, with a benchmarking setting of standards to make comparisons with the similar sector companies. According to Wu et al. (2003) the managers of ITES companies are using performance management practices to compare the internal change efforts by evaluating the employee performance management tools like 360-degree feedback, performance appraisals, periodically to assess the employee performance to near perfect. Some of the information technology companies around Hyderabad, use 360 degree feedback and balance scoreboard (Gupta and Kumar, 2012) routine as part of performance appraisal measurement. The introduction of performance management systems to assess the employee performance in the ITES companies has encouraged the employees (Gunasekaran et al. 2001). The managers of some ITES and mCommerce companies around Hyderabad practicing performance management systems and effectively assessing the employee perform ace using Management by Objectives (MBO). Wu et al. (2013) observed that assessment of employee performance by management by objectives will increase the motivation level of employees and employees are inspired to work in a progressive manner. According to Labour Statistics 2012, in the ITES companies the use of performance management has shown considerable improvement in the employee performance from 23.7% in 2011, to 39.7% in 2012. Jahanshahi et. al. (2011) opined that inclusion of performance management system to be considered at global levels in ITES companies and organizational goals need to be aligned with the performance system of the employees. Zhuo et al. (2010) viewed that large ITES companies like Amazon, Deloitte, and Google located in Hyderabad brought significant changes in the performance management systems including need based appraising in place of annual appraisals. Gudla and Veni (2012) in their study on PMS in IT organisations of India reported performance management system elements like performance planning, performance appraisal and review, performance improvement plans, and potential appraisal, and suggested the feedback is very important aspect for PMS success. Kumari (2017) suggested to developed a system towards 360 degree appraising for ITES companies and in other study by the same author indicated ITES companies are linking performance with rewards like promotion and suggested for communication mechanisms with an informal focus will provide competitive advantage. Mrutyanjaya Rao et al. (2019) suing multiple regression model studied the effect of factors that responsible for improved employee performance and impact of performance management system on employee factors. This study concluded both the factors significantly influencing the performance management system. Logistic regression studies Peng et al. (2002) reported the use of logistic regression for testing hypothesis of categorical outcome and one or more continuous predictor variables and categorical variable. The odds ratiois represented as the natural logarithm (logit), which is the main basis of mathematical concept for the logistic regression. The reason for running ordinary or multinomial logistic regression is the deficits of the outcomes of the multiple or linear regression. The ordinary scatterplots sometimes, are curved at the end with S-shape, and the interpretation is very difficult as this as the extremes do not follow the normal linear trend. This results in errors neither normal distributed nor constant across the whole range of data (Peng, Manz, & Keck, 2001). As with the logistic regression applies logit transformations to the dependent variable and predicts the logit, the natural logarithm of the response variable over continuous variable (Peng et al. 2002). Prasad et al. (2016) also reported the results by evaluating the factors that are influencing the performance appraisal system in agricultural research sector using multinomial logistic regression analysis. Multinomial logistic regression, an extension of ordinary logistic regression used with more than two possible discrete outcomes. The multinomial logistic regression is useful to predict the probabilities of different possible outcomes of a categorically distributed dependent variable and a set of independent variables, which may be continuous, binary and categorical. Suryawanshi et. al. (2015) using multinomial logistic regression modelled the nominal outcome variables with log odds of the outcomes as linear combination of the predictor variables. Several researchers reported multinomial logistic regression models in their stress studies and its associated factors using survey research (Suryawanshi et al., 2015; Prasad et. al. (2016) carried out a study on CBSE affiliated school teachers around Hyderabad, and reported that performance is a function of occupational stress using multinomial logistic regression model. A case study was carried out using multinomial logistic regression model to predict employee performance is a function of social support and coping in agricultural research sector employees (Mamata and Prasad, 2017). However, there are very limited research using multinomial logistic regression to predict categorical variable using binary, continuous independent variable and in particular performance management system studies. Therefore, the authors carried out this empirical research using multinomial regression model using a survey on the employees of mCommerce companies around Hyderabad.
Background and reason for this research: There are very limited studies to predict the outcome of categorical variable using logistic regression models and in particular studies related to performance management system, so this study was pursued using a survey on the employee of MCommerce companies.
Based on the identified problem, the following hypotheses are formed

H01: Factors responsible for improved employee performance factors does not influence the performance management system of mCommerce companies
H11: Factors responsible for improved employee performance influence performance management system of mCommerce companies

H02: Employee performance does not impact the performance management system of mCommerce companies
H12: Employee performance impacts the performance management system of mCommerce companies

H03: Employee personal competencies does not influence the performance management system of mCommerce companies
H13: Employee personal competencies influence the performance management system of mCommerce companies

H04: Employee knowledge level competencies does not influence the performance management system of mCommerce companies
H14: Employee knowledge competencies influence the performance management system of mCommerce companies

H05: Employee job-knowledge competencies does not influence the performance management system of mCommerce companies
H15: Employee job-knowledge competencies influence the performance management system of mCommerce companies

H06: Employee communication and interpersonal competency does not influence the performance management system of mCommerce companies
H16: Employee communication and interpersonal competency the performance management system of mCommerce companies
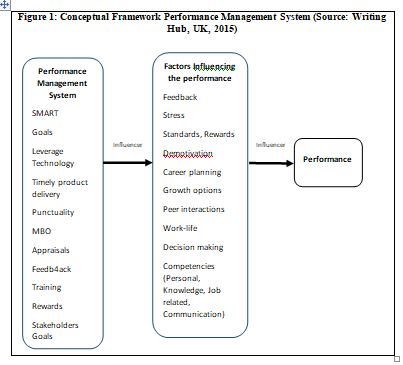
Conceptual Framework: The proposed framework was adopted based on the performance management system framework provided by Writinghub, UK (2015). The framework formulated is presented in Figure 1.
Sample size: A sample size of 924 was selected using simple random sampling where each member of the subset has equal probability of being chosen and data consists of 549 male and 375 female employees. The demographics are presented in Table 1.
|
Table 1. Age groups of employees (in years) |
||
|
Age Group |
Number |
Percent |
|
20-26 |
149 |
16.1 |
|
27-30 |
176 |
19 |
|
31-40 |
156 |
16.9 |
|
41-50 |
151 |
16.3 |
|
51-60 |
156 |
16.9 |
|
60 and above |
136 |
14.7 |
|
Total |
924 |
100 |
|
Male = n(545); female n(379) = total = 924 |
||
Research Instrument and Data Gathering: The research instrument used for this empirical study is a structured questionnaire using 4 scales 1) performance management scale with 13 factors measured on Likert-type 5-point scale with Extremely Relevant with score of 5 to Not at all Relevant with score of 0; 2) Factors responsible for employee performance improvement with 9 factors with Strongly agree 5 to Strongly disagree 0; employee performance factor that impact performance management system 5 factors Strongly agree 5 to Strongly disagree 0; personal competencies 5 factors, knowledge level competencies 3 factors, job-related competency 4 factors, communication and interpersonal competency for all the competencies the scale is Excellent with a score of 5 to Considerable Improvement needed with a score of 1. The other information on demographic variable like gender, age, qualifications, positon, marital details also gathered. All the study factors were presented in Table 2.
|
Table 2: Description of the factors studied |
||
|
Sl No |
Factors |
Items |
|
1 |
Performance Management System |
13: Efficient utilization of available resources, Maintenance of good quality standards, Maintenance of safety standards, Clearly intimating employees with work deadlines, On time product delivery, Punctuality maintained by staff members, Awareness .among employees about their work quality impact, Regular training of employees, Regular performance assessments of employees, Recognition and reward for good performance, Consideration of employees job satisfaction; Performing corporate social liabilities; Employee capability to differentiate among personal and organizational objectives |
|
2 |
Factors responsible for improved employee performance |
9: Performance feedback; Level of stress; Performance standards; Clarity about goal; Performance-based rewards; Demotivation of employees due to poor performance recognition; Lack of career planning; Constant career growth options; Regular work-related interaction with supervisor |
|
3 |
Impact on performance management system on employee performance |
5: Enhanced work life, Improved efficiency in getting work done, Improvement in work-related key competencies; Encouraged employees to participate in the decision making process; Encouraged employees in exercising their rights |
|
4 |
Personal Competencies |
5: Ability to state opinions firmly, Gaining trust of co-workers, Honest interaction with co-workers, Self-sufficiency in performing professional duties, Handling work pressure with calmness |
|
5 |
Knowledge Level Competencies |
3: Work-related knowledge, Quality awareness, Knowledge about department-related functionalities |
|
6 |
Job-Knowledge Competencies |
4: Clear presentation of ideas to the target group, Quick decision taking ability; Strive for excellence; Ability to share opinions with co-workers for a constructive agreement |
|
7 |
Communication and interpersonal competencies |
4: Ability to listen patiently to others, Ability to respond with clear ideas, Ability to persuade others for task completion, Sensitivity towards different ongoing activities in workplace |
Data Analysis: As this is an empirical investigation we have applied statistical methods to analyse the data for drawing inferences from our data. The data summarized using the descriptive analysis, hypotheses were formulated using inferential statistics, dispersion methods were used to measure the central tendency like mean, standard deviation, and variance using statistical package for social sciences ver 26. Reliability methods: To test the internal consistencies and reliability of the survey instrument the reliability statistics Cronbach alpha, split-half correlation, Spearman Brown Prophecy were measured to indicated all the items in the instrument related to the survey instrument (Gay et al. 2006). The instrument was tested with 100 employees data using SPSS ver 26 and overall Cronbach alpha was estimated as 0.70. Sometime later the data for all the employees collected (n=924), the Cronbach alpha value was measured which considerably improved to 0.82. The Cronbach values for men ranged from 0.67 to 0.86 and for women 0.63 to 0.84. The reliability statistics details were presented in Table 3. All the Cronbach alpha values are >0.6 suggesting a strong internal consistency. The second reliability measure Spearman Brown Split-Half correlation and Spear Brown Prophecy were computed to assure the overall survey instrument reliability and the values indicate strong reliabilities (Cronbach, 1951).
|
Table 3: Reliability statistics of the survey instrument (C-alpha, split-half (odd even) correlation, Spearman Brown Prophecy |
||||||
|
Factor |
Men |
Women |
||||
|
|
C-alpha |
Split-half Correlation |
Spearman Brown Prophecy |
C-alpha |
Split-half |
Spearman Brown Prophecy |
|
Performance Management System |
0.86 |
0.78 |
0.88 |
0.84 |
0.76 |
0.80 |
|
Factors responsible for improved employee performance |
0.80 |
0.75 |
0.86 |
0.78 |
0.74 |
0.80 |
|
Factors impact on performance management system |
0.72 |
0.67 |
0.81 |
0.73 |
0.67 |
0.79 |
|
Personal Competencies |
0.74 |
0.65 |
0.79 |
0.72 |
0.63 |
0.76 |
|
Knowledge Level Competencies |
0.68 |
0.64 |
0.70 |
0.63 |
0.60 |
0.68 |
|
Job-Knowledge Competencies |
0.68 |
0.62 |
0.75 |
0.67 |
0.60 |
0.72 |
|
Communication and interpersonal competencies |
0.67 |
0.66 |
0.80 |
0.66 |
0.62 |
0.76 |
The Mean, Standard Deviation, for overall factors estimated and the overall mean was 3.786 and standard deviation was 0.602. Based on this values effect of performance management system a dependent variable with the said independent variables score for low, medium and high effect were determined (Table 4). It is evident from the distribution which is symmetric the approximate range will be six times of standard deviation (σ) and a better approximation will make this to normal distribution. For this empirical study the observed data is near in near normal distribution and is nearly equal to 6 times of standard deviation (Andre Francis, 2008; Annamalai and Nandagopal, 2014). In the present study the PMS has 66 questions, and the values for these questions are between 1 and 5 totalling a value of 330 and the difference between minimum and maximum value is 264. After adjusting the values for reserve keyed questions the range is 3.56 which is more or less near to six time of standard deviation (σ=0.602). To the above value of mean the standard deviation was added and high effect value for PMS was set. The difference between the standard deviation and mean and standard deviation calculated and low effect of PMS was set and the level between low and high is medium effect of performance management system.
|
Table 4: Determination of independent variable effect on dependent variable (PMS) and rating score for PMS based on Mean and standard deviation |
|
|
Mean |
Standard Deviation |
|
x̄ = 3.786 |
σ = 0.602 |
|
(x̄ + σ ) = 3.786+0.6 = 4.386 |
High level = >4.386 |
|
(x̄ - σ ) = 3.786-0.6 = 3.186 |
Low level = <3.186 |
|
3.186 to 4.386 |
Medium Level |
In this research study the effect on performance management system caused by independent factors – Factors responsible for improved employee performance, Factors impact on performance management system, Personal Competencies, Knowledge Level Competencies, Job-related Competencies, Communication and interpersonal competencies were categorized into three levels Low effect, Moderate Effect and High effect. In SPSS system these dependent variables need to be stored as nominal variables. The multinomial logistic regression is used to predict a nominal dependent variable in the study i.e. the effect on performance management system with said independent variables. The multinomial logistic regression allows interactions between independent variables to predict the dependent variable.
|
Table 5: Case Processing Summary overall sample |
|||
|
|
N |
Marginal Percentage |
|
|
Performance Management System (effect of independent variables on PMS) |
Low |
167 |
18.1% |
|
Medium |
724 |
78.4% |
|
|
High |
33 |
3.6% |
|
|
Gender |
Male |
545 |
59.0% |
|
Female |
379 |
41.0% |
|
|
Valid |
924 |
100.0% |
|
|
Missing |
0 |
|
|
|
Total |
924 |
|
|
|
Subpopulation |
687a |
|
|
|
a. The dependent variable has only one value observed in 666 (96.9%) subpopulations. |
|||
The Case Processing Summary (Table 5) indicates us about how many cases are included in the analysis and in this study 924 valid cases are included with ‘0’ non-missing cases. N is the number of observations fitting the description in the first column. The first three values give the number of observations for performance effect – low effect, moderate effect and high effect; The percentages for each are also indicated. There are 687 subpopulations contained in the data and consist one combination of the predictor variables specified for the model.
|
Table 6 : Model fitting information to predict the performance levels in overall sample |
||||
|
Model |
Model Fitting Criteria |
Likelihood Ratio Tests |
||
|
-2 Log Likelihood |
Chi-Square |
df |
Sig. |
|
|
Intercept Only |
1109.503 |
|
|
|
|
Final |
415.325 |
694.179 |
14 |
.000 |
Model: The parameters of the model for which the model fit is calculated. "Intercept Only" is a model that does not control for any independent/predictor variables and just fits an intercept to predict the dependent/outcome variable. "Final" describes a model that includes the independent/predictor variables in this case three that maximizes the log likelihood of the outcomes appeared in the outcome variable. The final model is an improved model due to addition of the predictor variable than base or intercept only model. The differences in the -2(Log Likelihood) values associated indicates this Table 6. 2(Log Likelihood) – is a product of -2 and the log likelihoods of the null model and fitted "final" model. The likelihood of the model is used to test of whether all predictors’ regression coefficients in the model are simultaneously zero and in tests of nested models. The likelihood ratio test (Table 8.2) shows that the multinomial logistic regression model with the three predictor variables is better predictor of stress level than the multinomial logistic regression model without the three predictor variables (p-value = 0.000). This shows significance test of the model log likelihood of three independent variables. Chi-Square is the Likelihood Ratio (LR) Chi-Square test that at least one of the predictors’ regression coefficient is not equal to zero in the model. The LR Chi-Square statistic is calculated by -2*L(null model) – (-2*L(fitted model)) = 1109.503 – 415.325 = 694.179, where L(null model) is from the log likelihood with just the response variable in the model (Intercept Only) and L(fitted model) is the log likelihood from the final iteration (assuming the model converged) with all the predictors. df –is the degrees of freedom of the chi-square distribution used to test the LR Chi-Square statistic and is defined three predictors used in the two models. Sig. – This is the probability of obtaining this chi-square statistic (694.179), or one more extreme, if there is in fact no effect of the predictor variables. The small p-value from the LR test, <0.00001, would lead us to conclude that at least one of the regression coefficients in the model is not equal to zero. The parameter of the chi-square distribution used to test the null hypothesis is defined by the degrees of freedom in the prior column. Pearson chi-square (p-value = 0.568) and Deviance (p-value = 0.530) assess the goodness of fit of the model and the model with three predictor variables indicates a good fit to the data (Table 7). The Nagelkerke R-square indicates that 74.4% of the total variations in stress level occurred due to the variations among the three predictor variables (Table 8). However, these are not equivalent to R squares in ordinary linear (OLS) regression.
|
Table 7: Goodness of fit statistics |
|||
|
|
Chi-Square |
df |
Sig. |
|
Pearson |
2999.785 |
1358 |
.568 |
|
Deviance |
384.636 |
1358 |
0.530 |
|
Table 8 Effect of size to test the strength of the model Pesudo R-Square |
|
|
Cox and Snell |
.528 |
|
Nagelkerke |
.744 |
|
McFadden |
.607 |
Table 9: Likelihood ratio test: performance management system with independent factors |
||||
|
Effect (Factors) |
Model Fitting Criteria |
Likelihood Ratio Tests |
||
|
-2 Log Likelihood of Reduced Model |
Chi-Square |
Df |
Sig. |
|
|
Intercept |
415.325a |
.000 |
0 |
. |
|
Job-related factors |
417.507 |
2.182 |
2 |
.336 |
|
Improved employee performance |
485.432 |
70.107 |
2 |
.000 |
|
Personal Competencies |
438.755 |
23.430 |
2 |
.000 |
|
Knowledge Level Competencies |
424.257 |
8.933 |
2 |
.011 |
|
Communication and interpersonal competencies |
420.027 |
4.703 |
2 |
.095 |
|
Impact on PMS employee performance |
420.274 |
4.950 |
2 |
.084 |
|
Gender |
422.175 |
6.850 |
2 |
.033 |
|
The chi-square statistic is the difference in -2 log-likelihoods between the final model and a reduced model. The reduced model is formed by omitting an effect from the final model. The null hypothesis is that all parameters of that effect are 0. |
||||
|
a. This reduced model is equivalent to the final model because omitting the effect does not increase the degrees of freedom. |
||||
The -2Log likelihood or reduced are indicated in Table 9 and the results it can be observed that the four factors that responsible for improved employee performance, personal competencies, knowledge level competencies are significantly contributing to the model and influencing the performance appraisal system. The model also predicts significant gender differences.
Table: 10parameter estimates to predict effect on Performance Management System with independent factors |
|||||||||
|
Performance Management System Effect |
B |
Std. Error |
Wald |
df |
Sig. |
Exp(B) |
95% Confidence Interval for Exp(B) |
||
|
Lower Bound |
Upper Bound |
||||||||
|
Low |
Intercept |
28.645 |
3.920 |
53.402 |
1 |
.000 |
|
|
|
|
Job-Related Competencies |
.663 |
.635 |
1.090 |
1 |
.296 |
1.940 |
.559 |
6.735 |
|
|
Factors responsible for improved employee performance |
4.557 |
.976 |
21.797 |
1 |
.000 |
.010 |
.002 |
.071 |
|
|
Personal Competencies |
-1.835 |
.576 |
10.152 |
1 |
.001 |
.160 |
.052 |
.494 |
|
|
Knowledge level competencies |
-.433 |
.499 |
.754 |
1 |
.385 |
.648 |
.244 |
1.724 |
|
|
Communication and interpersonal competencies |
3.005 |
1.568 |
3.674 |
1 |
.049 |
20.196 |
.935 |
436.412 |
|
|
Impact of PMS on employee performance |
-3.923 |
1.809 |
4.705 |
1 |
.030 |
.020 |
.001 |
.685 |
|
|
[Gender=Male] |
-1.441 |
.576 |
6.267 |
1 |
.012 |
.237 |
.077 |
.731 |
|
|
[Gender=Female] |
0b |
. |
. |
0 |
. |
. |
. |
. |
|
|
Medium |
Intercept |
11.297 |
3.643 |
9.615 |
1 |
.002 |
|
|
|
|
Job-Related Competencies |
.215 |
.555 |
.150 |
1 |
.698 |
1.240 |
.418 |
3.676 |
|
|
Factors responsible for improved employee performance |
-1.717 |
.887 |
3.748 |
1 |
.047 |
.180 |
.032 |
1.022 |
|
|
Personal Competencies |
-.638 |
.516 |
1.529 |
1 |
.216 |
.528 |
.192 |
1.452 |
|
|
Knowledge level competencies |
.243 |
.448 |
.295 |
1 |
.587 |
1.275 |
.530 |
3.068 |
|
|
Communication and interpersonal competencies |
2.838 |
1.360 |
4.355 |
1 |
.037 |
17.081 |
1.188 |
245.531 |
|
|
Impact of PMS on employee performance |
-2.738 |
1.557 |
3.093 |
1 |
.079 |
.065 |
.003 |
1.368 |
|
|
[Gender=Male] |
-.822 |
.418 |
3.869 |
1 |
.049 |
.439 |
.194 |
.997 |
|
|
[Gender=Female] |
0b |
. |
. |
0 |
. |
. |
. |
. |
|
|
a. The reference category is: High. |
|||||||||
|
b. This parameter is set to zero because it is redundant. |
|||||||||
In the parameters Table 10 the comparison will be done comparing low effect (first half) and medium effect with High effect. The second half will be compared moderate effect on performance management system with High effect. For this model low effect versus high effect, for each unit increase in the improved employee performance odds of bettering performance management system in low effect group is 0.010 times (95%, CI 0.002 to 0.071), p<0.000, when compared with high effect group. In the similar way when comparing with medium effect versus high effect not improving the employee performance the odds of decreasing PMS efficiency in moderate effect group is 0.180 times (95%, CI 0.032 to 1.022) , p=0.005 when compared with high effect group and so on. From the significant values it can be observed that the model is significantly predicting the effect on Performance management system in overall sample. In the same way one-unit decrease in variables for personal competency the odds of effect on performance management system in low effect versus high effect will be (OR<1=0.160) for medium effect (OR<1=0.528) indicating a moderate effect on performance management system. The model predicted the significant gender difference in both low and medium effect when compared with high effect. Based on the multinomial logistic regression results the hypothesis can be: Reject the H01: Improved Employee performance factors does not influence the performance management system of mCommerce companies and accept the alternate hypothesis H11: Improved Employee performance factors influence performance management system of MCommerce companies Reject the null hypothesis H02: Employee performance does not impact the performance management system of mCommerce companies and accept the alternate hypothesis
H12: Employee performance impacts the performance management system of MCommerce companies

Reject the null hypothesis H03: Employee personal competencies does not influence the performance management system of mCommerce companies and accept the alternate
H13: Employee personal competencies influence the performance management system of mCommerce companies

Accept the null hypothesis H04: Employee knowledge level competencies does not influence the performance management system of MCommerce companies and reject the alternate hypothesis
H14: Employee knowledge competencies influence the performance management system of mCommerce companies

Accept the null hypothesis H05: Employee job-related competencies does not influence the performance management system of MCommerce companies and reject the
H15: Employee job-related competencies influence the performance management system of mCommerce companies

Reject the H06: Employee communication and interpersonal competency does not influence the performance management system of mCommerce companies and accept the alternate hypothesis H16: Employee communication and interpersonal competency the performance management system of mCommerce companies
As the independent factors Improved employee performance, Personal Competencies Communication and interpersonal competencies, and Impact on PMS employee performance significantly influencing the performance management system in the model.
In this study the authors made an sincere attempt to identify the association between performance management system an dependent factor with the above said six independent factors using an empirical survey with 924 employees of mCommerce/ITES companies. A large representative data was collected suing survey instruments publishing the instrument on google survey form. The authors observed a strong association between performance management system and Improved Employee performance factors, Personal Competencies, Communication and interpersonal competencies, Impact on PMS employee performance are significantly influence the performance. The results and hypotheses are in line and hypotheses are well supported with similar study carried by (Mrutyanjaya Rao et al. 2019). Significant gender differences were observed in relation the studied factors on effect of performance appraisal system.
The reason for carrying our this study is that very limited research was conducted on performance management systems using multinomial logistic regression. Most of the studies were conducted using multiple regression analysis. As the data was also collected using survey questionnaire has some nominal variables, and SPSS is used to predict a nominal dependent variable in the study i.e. the effect on performance management system with said independent variables. The multinomial logistic regression allows interactions between independent variables to predict the dependent variable. Further, not a single study was conducted on ITES/mCommerce companies using such large sample which include more than 2 lakh data points. The limitation of the study is that the authors have restricted this empirical observation to the mCommerce/ITES companies located in and around Hyderabad. The authors also faced some tough time in preparing the questionnaire which fits all the companies, as performance management system vary from company to company. The authors have included most of the items from the several companies performance appraisal systems studied, while designing the survey questionnaire to make the measure perfect. This was further confirmed by the measurement values of reliability statistics. The authors recommend gender-related parity studies to make a comparative analysis among women and men employees on the performance analysis system.
Babu, T.N., and Suhasini, N. (2017). Performance Management -Effective Tool for Talent 1Management. International Conference Emerging Trends in Engineering, Technology, Science and Management, pp 581-585.

Cronbach, L.J. (1951). Coefficients alpha and inter structure of tests. Psychometrica 16, 297-334

Esu, B.B., & Inyang, B.J. (2009). A case for performance management in the Public Sector on Nigeria., International Journal of Business and Management. 4(4), 98-105.

Francis, A.,(2008). Business Mathematics and Statistics. 6th Edition. South Western Cengage Learning EMEA, High Holborn House. 50-51 Bedford Row, London WC1R 4LR. ISBN 978-1-84480-128-2.

Gudla, S., & Veni, V. S. K. (2012). The Study of Performance Management System in IT Organizations. IOSR Journal of Business and Management, 6(3), 37-52.

Gunasekaran, A., Patel, C., & McGaughey, R. E. (2004). A framework for supply chain performance measurement. International journal of production economics, 87(3), 333-347.

Gupta, V., & Kumar, S. (2013). Impact of performance appraisal justice on employee engagement: a study of Indian professionals. Employee relations.

Jahanshahi, A. A., Mirzaie, A., & Asadollahi, A. (2011). Mobile commerce beyond electronic commerce: Issue and challenges. Asian Journal of Business and Management Sciences, 1(2), 119-129.

Kim, T., & Holzer, M. (2016). Public Employees and Performance Appraisal: A Study of Antecedents to Employees’ Perceptions of the process. Review of Public Personnel Administration, 36(1), 31-56. https://doi.org/10.1177/0734371X14549673

Kumari, N. (2017). A comparative study of performance management system in IT/ITES Industry. London Journal Press 17(1), 1-10

Kumari, N. (2017). A study of performance management system in IBM. Business and Management Reserch Journal 7(2), 19-24

Mamatha, C., & Prasad, K. D. V. Employee Performance A Function of Social Support And Coping: A Case Study with Reference to Agricultural Research Sector Employees Using Multinomial Logistic Regression.19(11), 12-21

Mangipudi Mruthyanjaya Rao, Dr. Rajesh W. Vaidya & Prasad, K.D.V. (2016).  Factors influencing the scope, significance and objectives of performance management systems: A study with reference eCommerce and mCommerce Companies in Hyderabad. International Journal of Current Research, 8(09), 38301-38307.

Mrutyanjaya Rao, Prasad, K.D.V, & Rajesh Vaidya (2019). Employee Performance as Function of Performance Management System: An Empirical Study Information Technology Enabled Services Companies around Hyderabad. European Journal of Business and Management Research 4(4), 1-7

Paile, N.J., (2012). Staff perceptions of the Implementation of Performance Management and Development System: Father SmangalisoMkhatswa Case Study, Master Thesis, University of South Africa.
Peng Chao-Ying, J., Lee, K.L., & Ingersoll, G.M. (2002). An introduction to logistic regression analysis and reporting. The Journal of Educational Research 96(1):3-14

Peng, C.Y., Manz, B.D., & Keck, J. (2001). Modelling categorical variables by logistic regression. Jounral of Health Behaviour, 25(3): 278-284

Prasad, K. D. V., & Vaidya, R. (2016). Factors Influencing the Performance Appraisal System among Women and Men: A Comparative Analysis using Multinomial Logistic Regression Approach. International Journal of Management, 7(6), 95-108

Prasad, K. D. V., Vaidya, R., & Kumar, V. A. (2016). Teacher’s Performance as a Function of Occupational Stress and Coping with Reference to CBSE Affiliated School Teachers in and around Hyderabad: A Multinomial Regression Approach. Psychology, 7, 1700-1718. http://dx.doi.org/10.4236/psych.2016.713160

Shah, F.T., & Aslam, M. M. (2009). Impact of Employee Performance Management System; To Achieve the Objectives of the Organizations. 6. Retrieved from 123seminarsonly.com.

Sumathi, A., and Nandagopal, R. (2015). Occupational stress: A study of employee stress in ITES industry. Pp. 167. Allied Publishers Private Limited, Hyderabad, India

Suryawanshi, A., Savasani, M. & Shah, J. (2015). A study of stress level of married men and women using multinomial logistic regression. International Journal of Scientific Research Publications. 5(8): 1-8.
Writinghub (2015). To assess the impact of performance management system on employee performance. Case study of Sainsbury’s. Wriringhub, United Kingdom. https://www.slideshare.net/writinghub/to-assess-the-impact-of-performance-management-system-on-employee-performance-case-study-of-sainsburys

Wu, F., Mahajan, V., & Balasubramanian, S. (2003). An analysis of e-business adoption and its impact on business performance. Journal of the Academy of Marketing science, 31(4), 425-447.

Zhuo, J., Wei, J., Chen, L., & Li, Z. (2010). SaaS-model-based approach for mobile government security. International journal of mobile communications, 8(6), 654-666.

Zvavahera, P. (2014). An evaluation of the effectiveness of performance management systems on service delivery in the Zimbabwean civil service. Journal of Management and Marketing Research, 14, 1.

